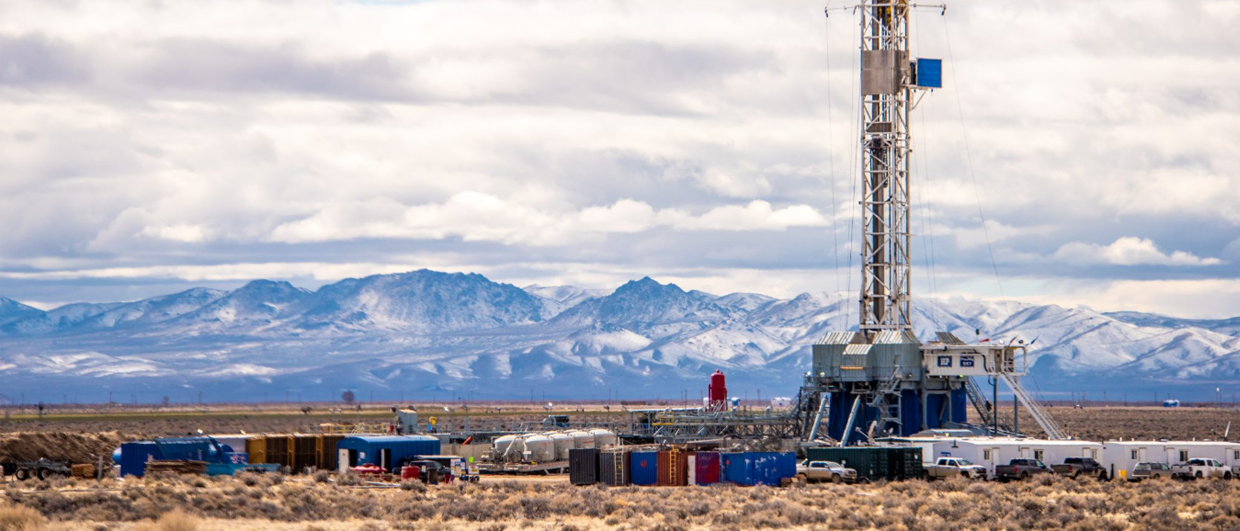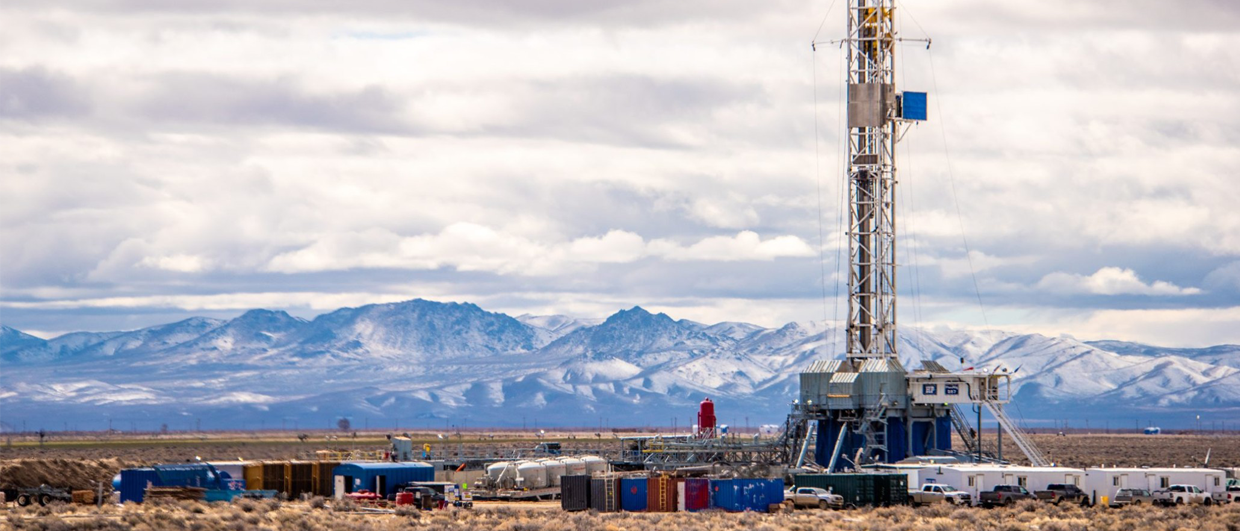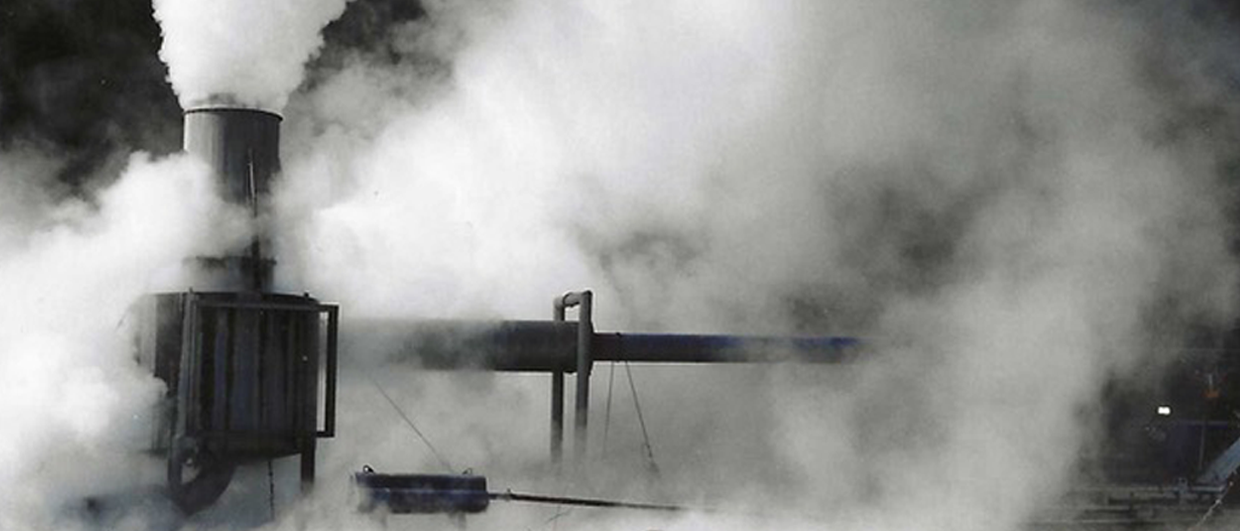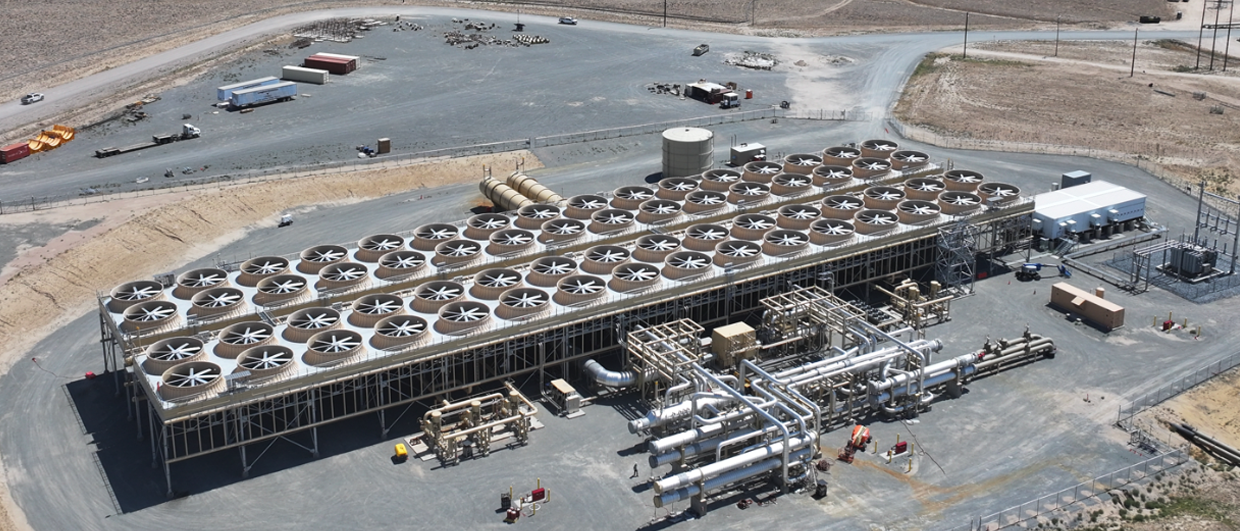
Cape Station's GeoBlock 1, which is now operational. Photo: Fervo
How Fervo is digging a deep financial hole
Fervo’s much-heralded success in raising money in their Initial Public Offering for their Enhanced Geothermal projects has come unravelled, with shareholders losing some $10 billion since the peak in May of this year. As bad as the collapse of their share price is, Fervo actually have bigger problems. A legacy of omissions, inaccuracies, and their own inexperience has put them in a deep financial hole that they will need time to dig out of – if at all

The problems started in 2023 with Project Red in Nevada. Fervo’s self-published paper described their small demonstration project as “commercial scale”. But Project Red was neither commercial (as in economically profitable), nor of significant scale.
While providing some interesting results that they could have quietly built on, instead Fervo’s initial reporting for Project Red overstated the expected flow rate and underestimated the pressure loss in the reservoir between the injection and production well. This turns out to be of fundamental importance.
Subsequent reporting also flagged temperature decline and a high degree of water loss, which Fervo say will not happen at Cape Station. But they also stated in April 2026 that Project Red had not experienced the “kind of premature thermal decline that has long plagued traditional geothermal projects”.
Fervo should have already known that this was not accurate, as their own data showed that for several months prior, Project Red had already been experiencing thermal decline, potentially much greater than most conventional geothermal projects. This has not helped their credibility.
At Cape Station, Fervo’s self-published paper in 2024 claimed that a 30-day production test achieved “a sustained output of 8-10 MW”. But the production rate was in fact not shown by their own data to be sustained over the 30 days, or even during the brief period of data that was shown. Fervo omitted the production rate data for 29 days of the 30-day test and did not include any injection rate data.
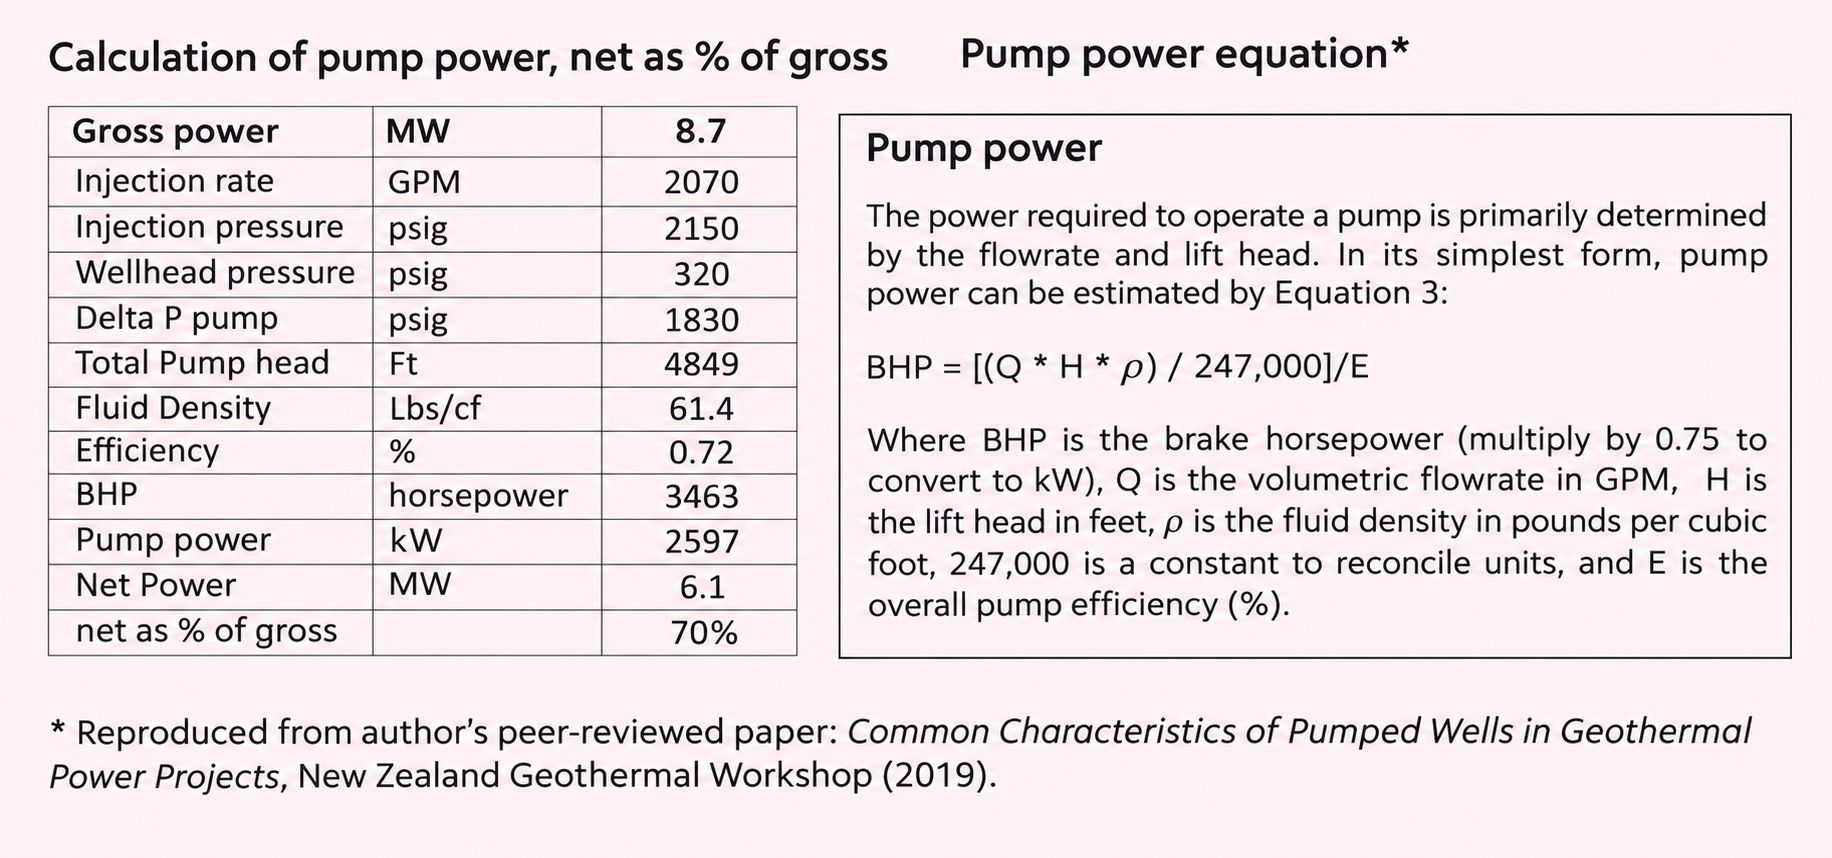
They also neglected to deduct the power required for the re-injection pumps, which used about 30% of the gross power ascribed to the production well (See Appendix 1 for pump power calculations). Critical questions of well productivity, production decline, and water loss were left unanswered at the time, and are still unanswered more than two years later. No further well test results have been shared by Fervo, a surprising omission considering that this is an unproven technology with no operating history.
Inexperience
Fervo’s lack of geothermal experience, especially in reservoir engineering, may have compromised their ability to plan or even understand their own projects. While above-ground equipment for Enhanced Geothermal projects is largely the same as for other geothermal pumped well projects that are common in Nevada and California, the reservoir is not.
To try to create a reservoir capable of commercial flow rates, Fervo drills horizontal wells and then fracks the rock between the injection and production wells. According to Fervo, the technical challenge of “successfully creating a high conductivity hydraulic connection between injection and production wells has been retired”. To put it charitably, this is an unfortunate mischaracterisation of the reservoir by Fervo. From an oil and gas perspective, it may have seemed like “high conductivity”, but not for geothermal.
In the only well test data Fervo has released so far, even the post-frack reservoir permeability between injection and production wells resulted in well productivity at the very lowest range of conventional geothermal wells. To increase the production rate at Cape Station over Project Red, Fervo drilled longer horizontals, used two injection wells to one production well, and also significantly increased injection pressure.
The result was still dismally low net power produced per well drilled, much lower than conventional geothermal wells. This low well productivity is likely the main contributor to the stubbornly high development costs at Cape Station, which has apparently finally dawned on Fervo. Only days before their IPO, Fervo revealed that their capital expenditures (Capex) would be $7,000 per installed kilowatt of capacity, not the $6,000/kW that they had predicted just the year before.
But it gets worse, as this Capex refers to gross generation, not net.
Gross capacity versus net generation – Impact on rate of return
Fervo are fond of quoting gross generation capacity of their turbines and recently declared the start of “commercial operations” for Phase 1 of Cape Station, bringing online the first of three 33 MW turbines. They say that the “GeoBlock is performing to expectations”.
But the net generation available for sales will be lower than this quoted gross after deducting the parasitic load for the re-injection pumps, which is estimated at about 30% of the gross. This means that the best achievable Capacity Factor for Cape Station, based on the only data we have so far, would start on day one at 70%.
Capacity Factor is defined here as net generation in Megawatt-hours (MWh) divided by installed capacity in MW times the number of hours in the period; e.g. an installed capacity of 100 MW would generate 876,000 MWh in one year for a 100% Capacity Factor, but for Capacity Factor of 70% net generation would only be 613,200 MWh.
In the longer term, Capacity Factor tends to degrade due to maintenance outages and the inevitable production and/or temperature declines that occur in all geothermal reservoirs (and maybe even worse for fracked reservoirs). Anyone running economics on Fervo’s projects would be well advised to consider running a range of Capacity Factors when forecasting cash flow and rate of return.
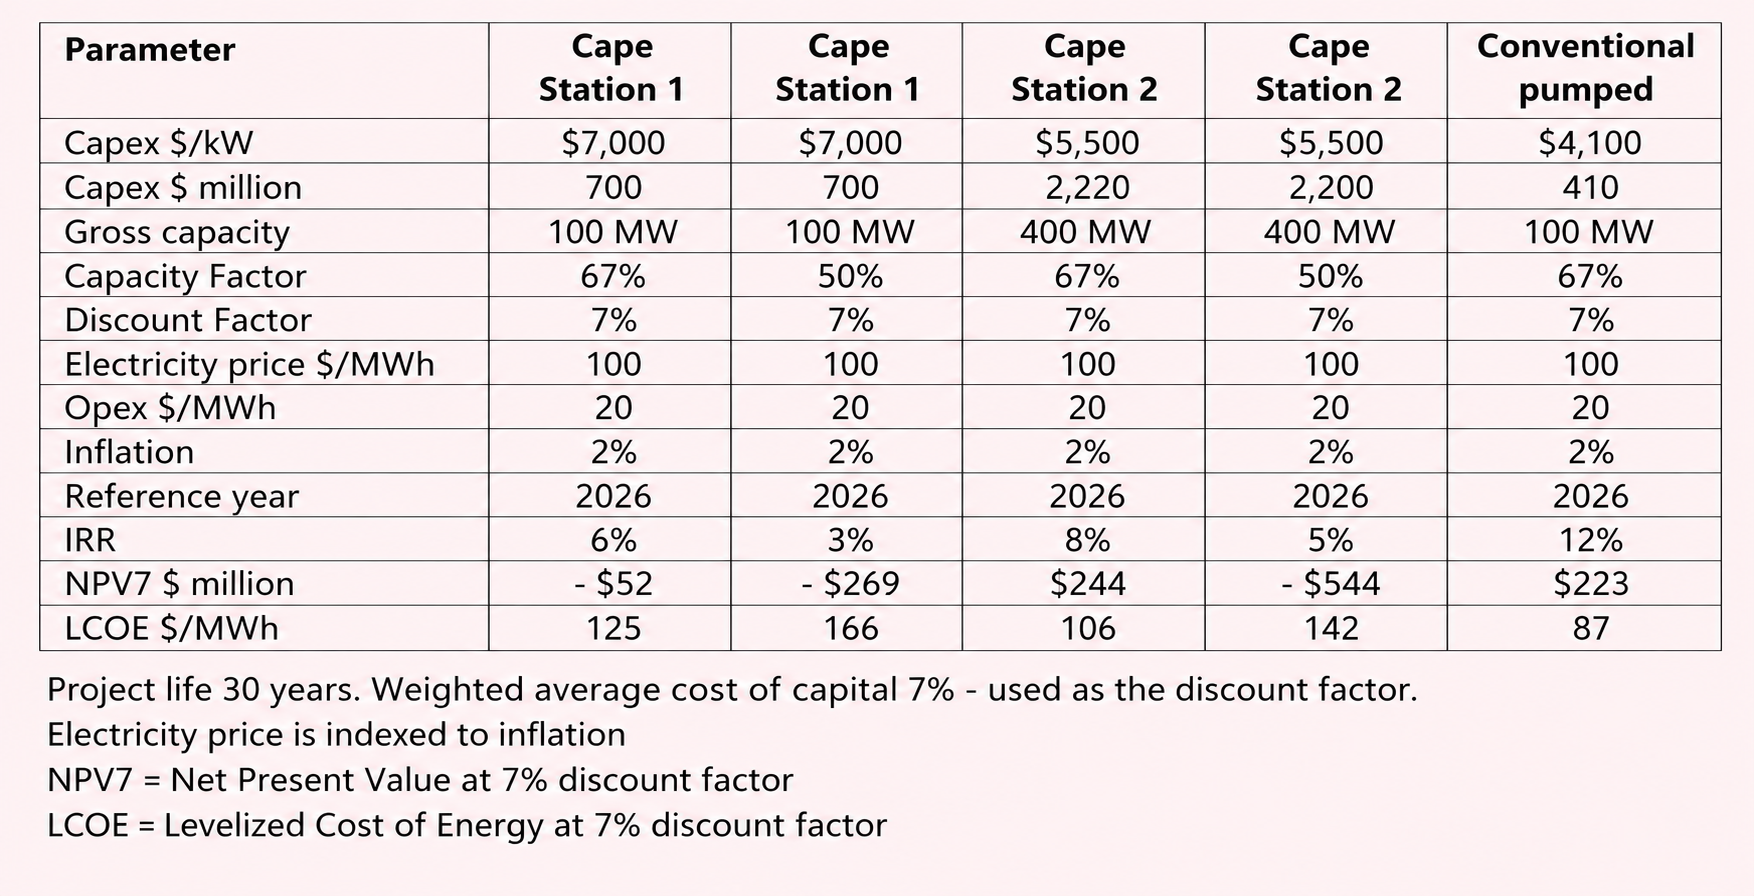
For example, using Fervo’s Capex benchmark of $7,000/kW and an average Capacity Factor of 67% (the near-perfect case with almost no maintenance downtime and no production shortfalls) results in a project with an Internal Rate of Return (IRR) of about 6%. A more realistic Capacity Factor of 50% would sink the project even deeper (IRR of 3%).
Internal Rate of Return is a fundamental measure of project economics that forms an estimate of the profitability of potential investments. IRRs lower than the cost of capital, in this case assumed to be 7%, are negative in value (they lose money). See Appendix 2 for economic inputs.
For Cape Station Phase 2, Fervo say that their goal is to reduce Capex to $5,500/kW. If, for sake of argument, they can achieve this, the Capex for Phase 2 would be $2.2 billion. The near-perfect case with a Capacity Factor of 67% would result in an IRR of 8%. But a more realistic Capacity Factor of 50% would sink that project too (IRR of 5%).
The hole
In due course, Fervo will run headlong into the Capacity Factor issue outlined above. The company may be starting to come to terms with this, which could be why they lowered their revenue forecast in their August guidance (they also cited issues with transmission system access). Their net operating income will be even lower after deducting operating expenses, and of course will have to service the non-recourse loan. There won’t be much cash flow left over, if any, which brings us to the hole.
According to Fervo, they have raised some $4 billion through various means, including venture capital, loans, and a public offering. As of their Quarter 2 reporting in August, they still had $2.1 billion of cash, but they also said they may spend up to $900 million of that by the end of the year, which would leave $1.2 billion. It’s not clear if this is sufficient to finish Phase 2 and fulfil other obligations such as overhead costs, let alone new development.
This means that Fervo will likely have to go back to raising money from investors, lenders, or the public. But things are different now. For one, the share price has collapsed, making it difficult to convince the public to buy shares at anything but basement prices. Fervo still has fervent believers, but investors and lenders may want to see proof of operating history that includes gross versus net power and production and injection data, potentially raising even more red flags. Emergency funding with junk bond-level interest rates may be a way stay afloat but this isn’t a very good option for construction loans.
The hole that Fervo dug for themselves is that Cape Station Phases 1 and 2, forecast to reach some $3 billion in drilling and construction costs, are likely uneconomic. One has to question the wisdom of committing to massive expenditures before proving that fracking could economically create a geothermal reservoir capable of delivering sufficient and sustainable flow rates without prohibitive water loss or temperature declines.
Only extended well testing with the well configuration intended for long-term production would have answered this question, which apparently Fervo haven’t done yet. At this point, they could try to reduce the parasitic load, but high injection pressures are intrinsic to their operations and there is no evidence that this issue is going away.
Fervo has suggested they may add downhole production well pumps to reduce the injection pressure. But this adds more Capex and would just shift some of the parasitic load from re-injection pumps to downhole pumps. They could try to maintain production rates by increasing the number of wells, but this means higher Capex.
There’s also no guarantee that even if production rates can be maintained, temperature declines won’t occur. Maybe they could get higher electricity prices – the above IRRs are quoted for $100/MWh – but even at $130/MW Phase 2 is barely above breakeven (IRR 8%) for a Capacity Factor of 50%.
To convince shareholders, investors, and lenders that they have a viable business model, Fervo will have to prove (not just speculate) that after burning through almost $3 billion so far, they will be able to vastly improve well productivity, achieve a near-perfect operating record, suffer no production shortfalls, and experience no material temperature declines or water loss. For that, they will need time. But having rushed their IPO and started the clock, they are running short of time and credibility.
Appendix 1 – Pump power calculations
Production parameters to estimate pump power were derived from Fervo’s first, and only, published well test data, summarised by this author in an earlier article. These parameters are input into the pump power equation as shown below.
Appendix 2 – Economic inputs
The author has performed simple discounted cash flow (DCF) analyses on Fervo’s Cape Station Phase 1 and Phase 2 projects. Results are compared to a conventional pumped geothermal project. All analyses are unrisked, unleveraged, before tax. The author encourages readers to rely on their own independent analyses and sensitivities.