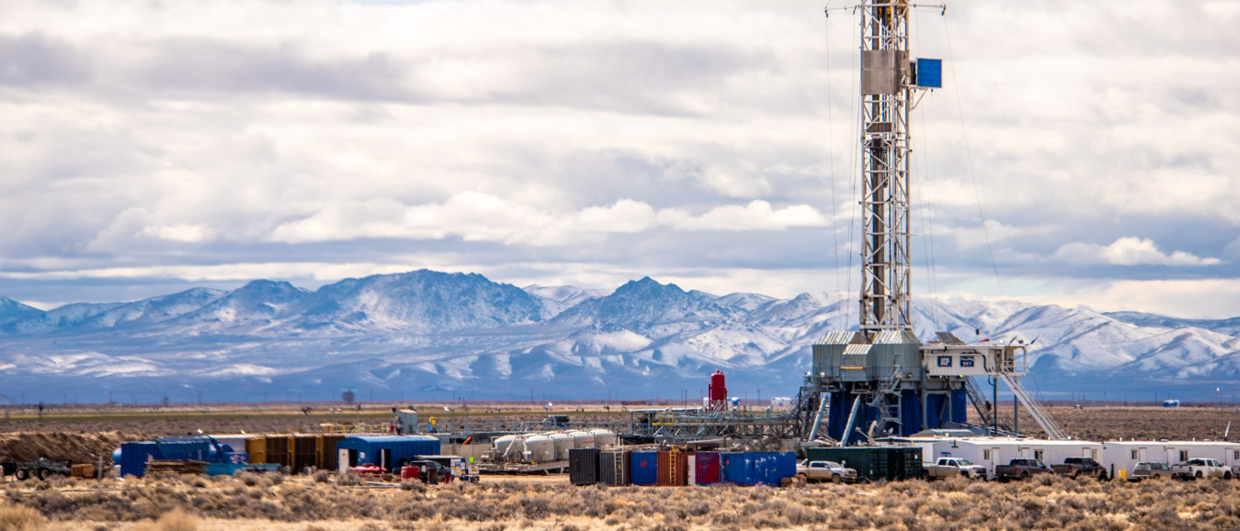
Photo: capestation.com.
The low productivity of enhanced geothermal systems
Or, how Fervo’s EGS project, created by fracking, is behaving like a low-permeability reservoir
Fervo Energy operate the world’s most well-funded Enhanced Geothermal Systems (EGS) project at Cape Station, Utah, and have published well test results from which the Productivity Index can be estimated. This analysis for Cape Station shows that this key productivity metric is at the very low end compared to conventional geothermal wells, which suggests a level of reservoir risk that deserves more attention.
The Productivity Index (PI) of a well is essentially the pressure drop required to induce a given flow rate into the well. PI is one of the most useful indicators of well performance in geothermal reservoir engineering and can also be correlated to permeability-thickness (kh), a fundamental intrinsic property of the reservoir.
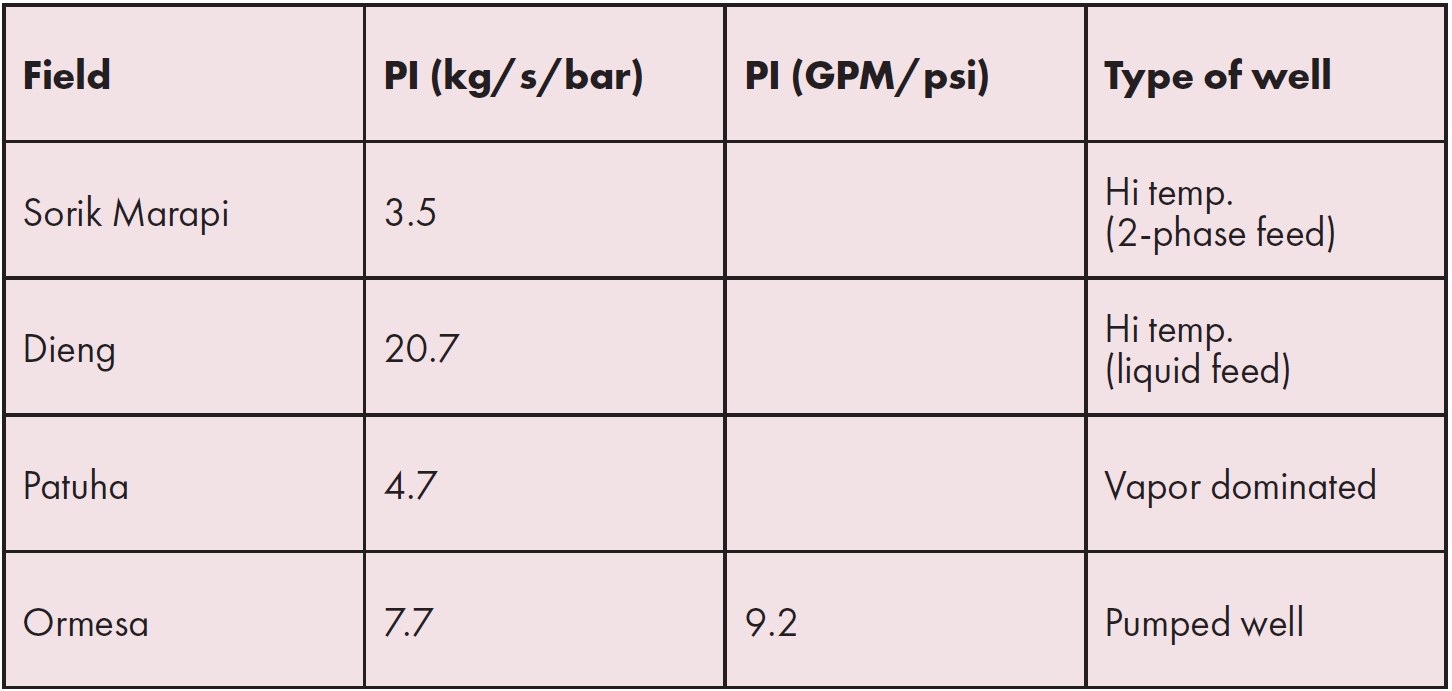
In conventional geothermal wells, downhole surveys acquired at static and flowing conditions are compared to derive the well’s PI for a known flow rate. For pumped wells, the downhole flowing pressure can be continuously monitored with a bubble tube installed just above the first stage impeller. The pump depth and design rate are determined according to the expected drawdown in the wellbore, which is a function of the well’s PI.[1] Representative PIs for some conventional geothermal fields from the author’s database are listed in Table 1.
Productivity Index for Cape Station Well
The limited production test data published by Fervo for Cape Station is from the Frisco well pad. This pad is shown as consisting of five wells, two of which are designated as injectors and one as a production well. The injection and production wells are indicated by Fervo to be completed with 7″ casing, assumed to be tied back to surface.
Fervo refer to this arrangement as a “triplet” and we assume that injection is evenly distributed between the two injectors. As shown in an earlier article, the output at the end of the 24 hours shown by Fervo is about 6.2 MW (net), and still declining. Despite reported successes in drilling and fracking, this is a relatively low result for three wells. The question is why and what is this telling us about the reservoir?
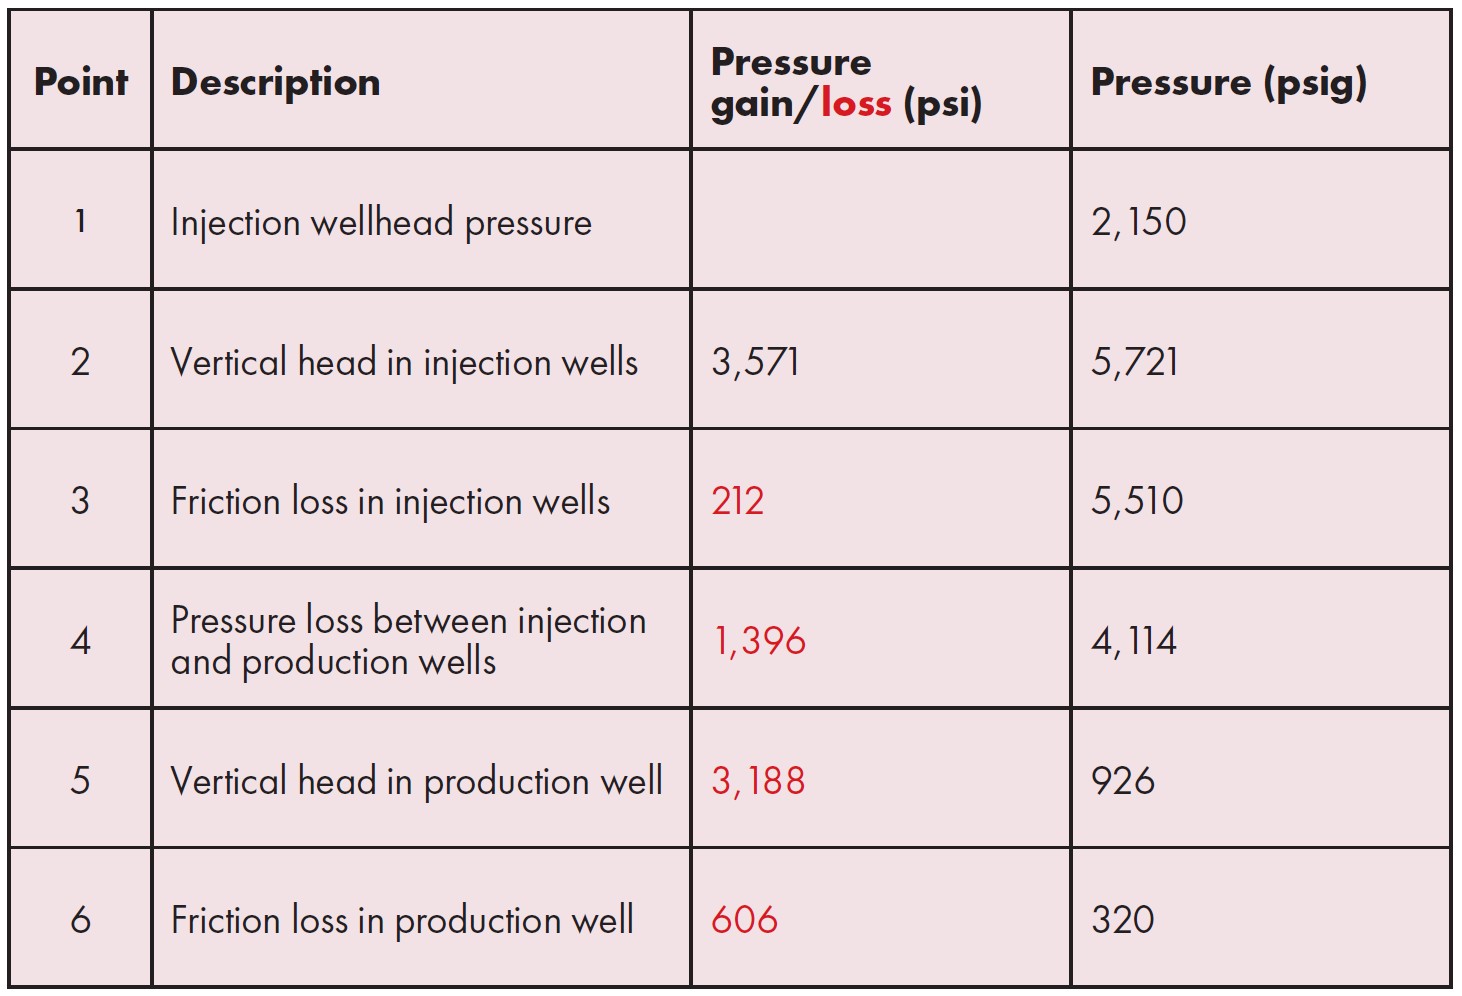
Data provided by Fervo does not include downhole flowing pressures or injection rates, but an estimate of the PI can be made by making certain assumptions and tracing the pressure from the injection wells to the production wellhead (Table 2). For purposes of this exercise, a production flow rate of 93 kg/s is used. A total injection rate of 116 kg/s is used, assuming 20% loss of injected water (Project Red data indicate a 30% loss).
The two endpoints are the injection pressure of 2150 psig (point 1) and production wellhead pressure of 320 psig (point 6). [2]. A simplified, analytical approach to tracing the pressure from the injection wells to the production wellhead is used and takes into account the weight of the water column in the wells, friction losses, and pressure losses in the formation. Vertical head calculations assume an average vertical depth of 8,500 feet and pressure gradients are based on a temperature of 176F in the injection wells and a temperature of 383F in the production well. This production temperature is given by Fervo, but the injection temperature is just a guess, based on data from Project Red in Nevada.
Friction loss in the wellbores is estimated from the Darcy-Weisbach equation using a friction factor of .023 for 7″ API casing, assuming turbulent flow regime. The friction loss is calculated for the entire wellbore to the end of the horizontal sections at 4,700 feet, so in reality, it may be less than this as flow is said to be distributed. For the given end points, lower friction loss in the wellbore would mean more of the pressure drop is in the reservoir.
In this example with the assumptions stated above, the average pressure drop between each of the injection wells and the production well is estimated at about 1,400 psi (96 bar). The flow rate of 93 kg/s is divided by this pressure drop to derive a combined PI (for the triplet system) of about 1.0 kg/s/bar. In volumetric terms, the flow rate is 1,700 gallons per minute (GPM) or 58,000 barrels per day (Bbls/d), which translates to a volumetric PI of 1.2 GPM/psi or 41 Bbls/d/psi. A similar analysis was performed for Project Red which indicated a PI of 0.4 GPM/psi, but this was for a “doublet” using one injection well.
Libbey and Murphy (2026) have plotted PIs for a number of conventional geothermal fields which range from about 0.6 to 250 kg/s/bar. The PI of 1.0 kg/s/bar estimated in this article for Cape Station falls at the low end of this range. It should be noted that conventional geothermal fields with lower PIs tend to compensate with much higher enthalpies compared to Cape Station.
Correlation to Permeability-thickness
PI is related to permeability-thickness by the diffusivity equation (Earlougher, 1977). For a given set of assumptions – steady state, radial, infinite acting – this equation can be simplified in oil field units to:
kh= 141.2*(q*B* μ)*Ln (re/rw)/(Pe – Pw)
Where kh is permeability-thickness in millidarcy-feet (md-ft), q is flow rate in Bbls/d, B is the formation volume factor of the reservoir fluid (dimensionless) – which for water at these reservoir conditions is essentially unity, is the viscosity of the fluid in centipoise (cp), Pe is the “external pressure” (in psi) which provides the driving force for flow into the well, and Pw is the flowing bottomhole pressure (also in psi).
Assuming 3.5″ for wellbore radius (rw) and an external radius (re) as the distance between injectors and producer of 500 feet, the term Ln (re/rw) can be estimated at about 7.5.
In this case, the external pressure is provided by the injection wells and the flowing bottomhole pressure is the average flowing pressure in the production wellbore (along the horizontal). The difference between these pressures (dp) drives the flow rate (q). Or put in terms of volumetric PI (q/dp) with units of Bbls/d/psi:
kh= 141.2 *B* μ * Ln (re/rw) * PI
For a flow rate of 58,000 Bbls/d, a PI of 41 Bbls/d/psi, and viscosity at reservoir conditions of 0.14 cp, the kh for the Cape Station Frisco well test can be estimated as:
kh= 141.2 *1* 0.14 * 7.5 * 41 = 6,078
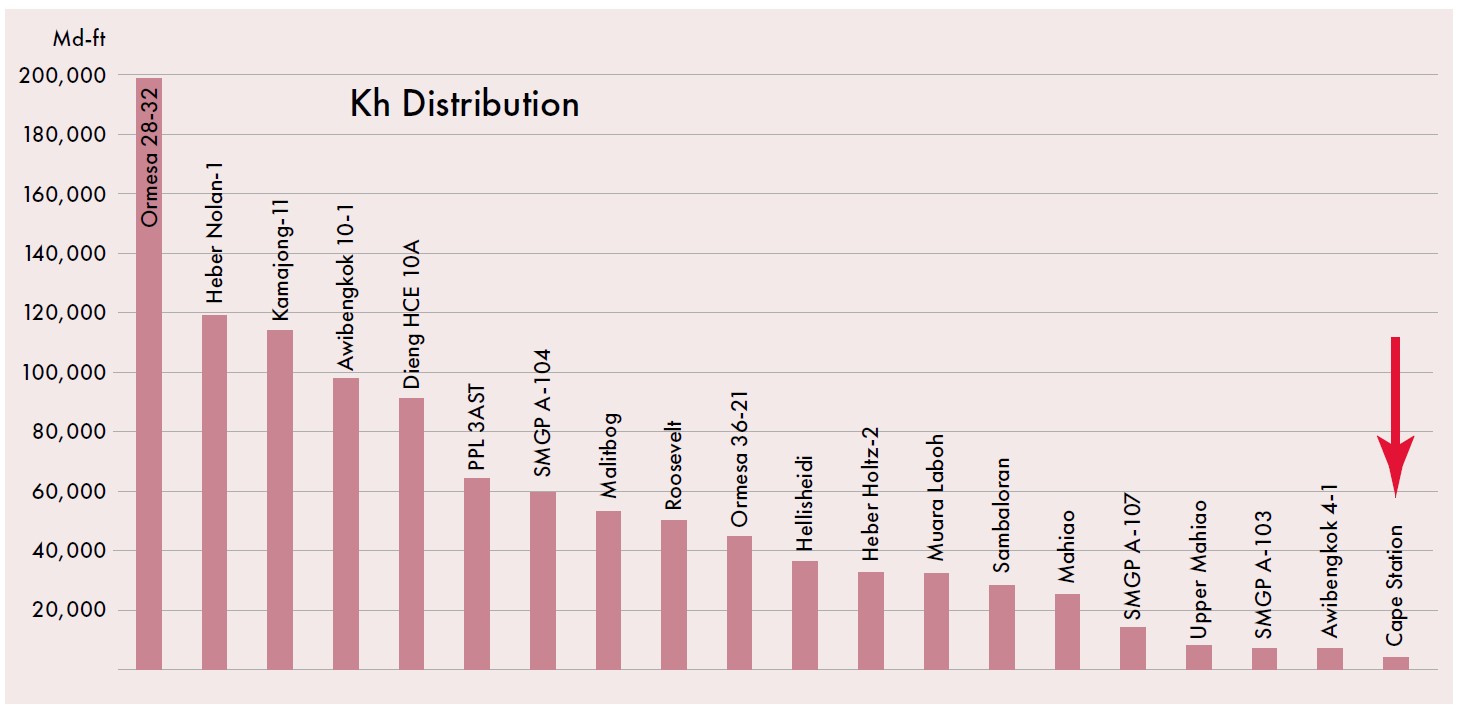
Although this is only a gross estimation based on the above assumptions, it is clear that permeability-thickness for this EGS reservoir falls at or near the very lowest end of the range compared to examples from conventional geothermal fields.
To take one specific example, average kh in the Roosevelt Hot Springs geothermal field, adjacent to the Cape Station site in Utah, is about 50,000 md-ft, almost an order of magnitude greater than the result above for Cape Station.
Interpretation
According to Fervo, the technical challenge of “successfully creating a high-conductivity hydraulic connection between injection and production wells has been retired”. But the term high-conductivity is misleading when compared to conventional geothermal reservoirs, which have on average much higher PIs and, by correlation, permeability-thickness. From a geothermal reservoir engineering perspective, this is telling us that the EGS reservoir created by fracking is behaving like a low permeability reservoir.
In effect, high injection pressures are required to overcome the pressure drop between injection and production wells. The triplet helps to distribute the pressure drop, but also means more wells would be required. Bigger casing could also help by reducing friction loss in the wells, which would result in slightly higher flow rates, but pressure drop in the reservoir is the more important factor. Downhole pumps in the production wells might help by supplying more pressure in the system – at a parasitic cost – but again the issue is the reservoir.
Implications for Well Numbers
A hard-earned lesson from the conventional geothermal industry is that low permeability reservoirs tend to require a greater number of wells than anticipated, and this may true for Cape Station as well. For example, assuming the production wells can stabilize at 80-90 kg/s and that triplets are required to maintain these rates [3], a facility to produce 100 MW (net) would likely require some 50-60 wells.
Fervo are no doubt aware of this issue as the capex estimate quoted in their recent S-1 filing is $7,000 per installed kW of generating capacity – some 50% higher than most conventional geothermal projects – probably due in large part to the high well numbers. Fervo’s warning in their S-1 filing that “we may be unable to deliver expected per- kilowatt cost reductions or step-ups in gross megawatt productivity per well” should be taken seriously until such time as they can prove this with well test data.
References:
[1] PI is also discussed in Common Characteristics of Pumped Wells in Geothermal Power Projects, E.N. Yearsley, Proceedings of the 41st New Zealand Geothermal Workshop (2019).
[2] Injection pressure is given as “between 2000 to 2300 psi”. Production wellhead pressure is read off the plot provided by Fervo.
[3] A doublet would likely have the effect reducing the production rate.