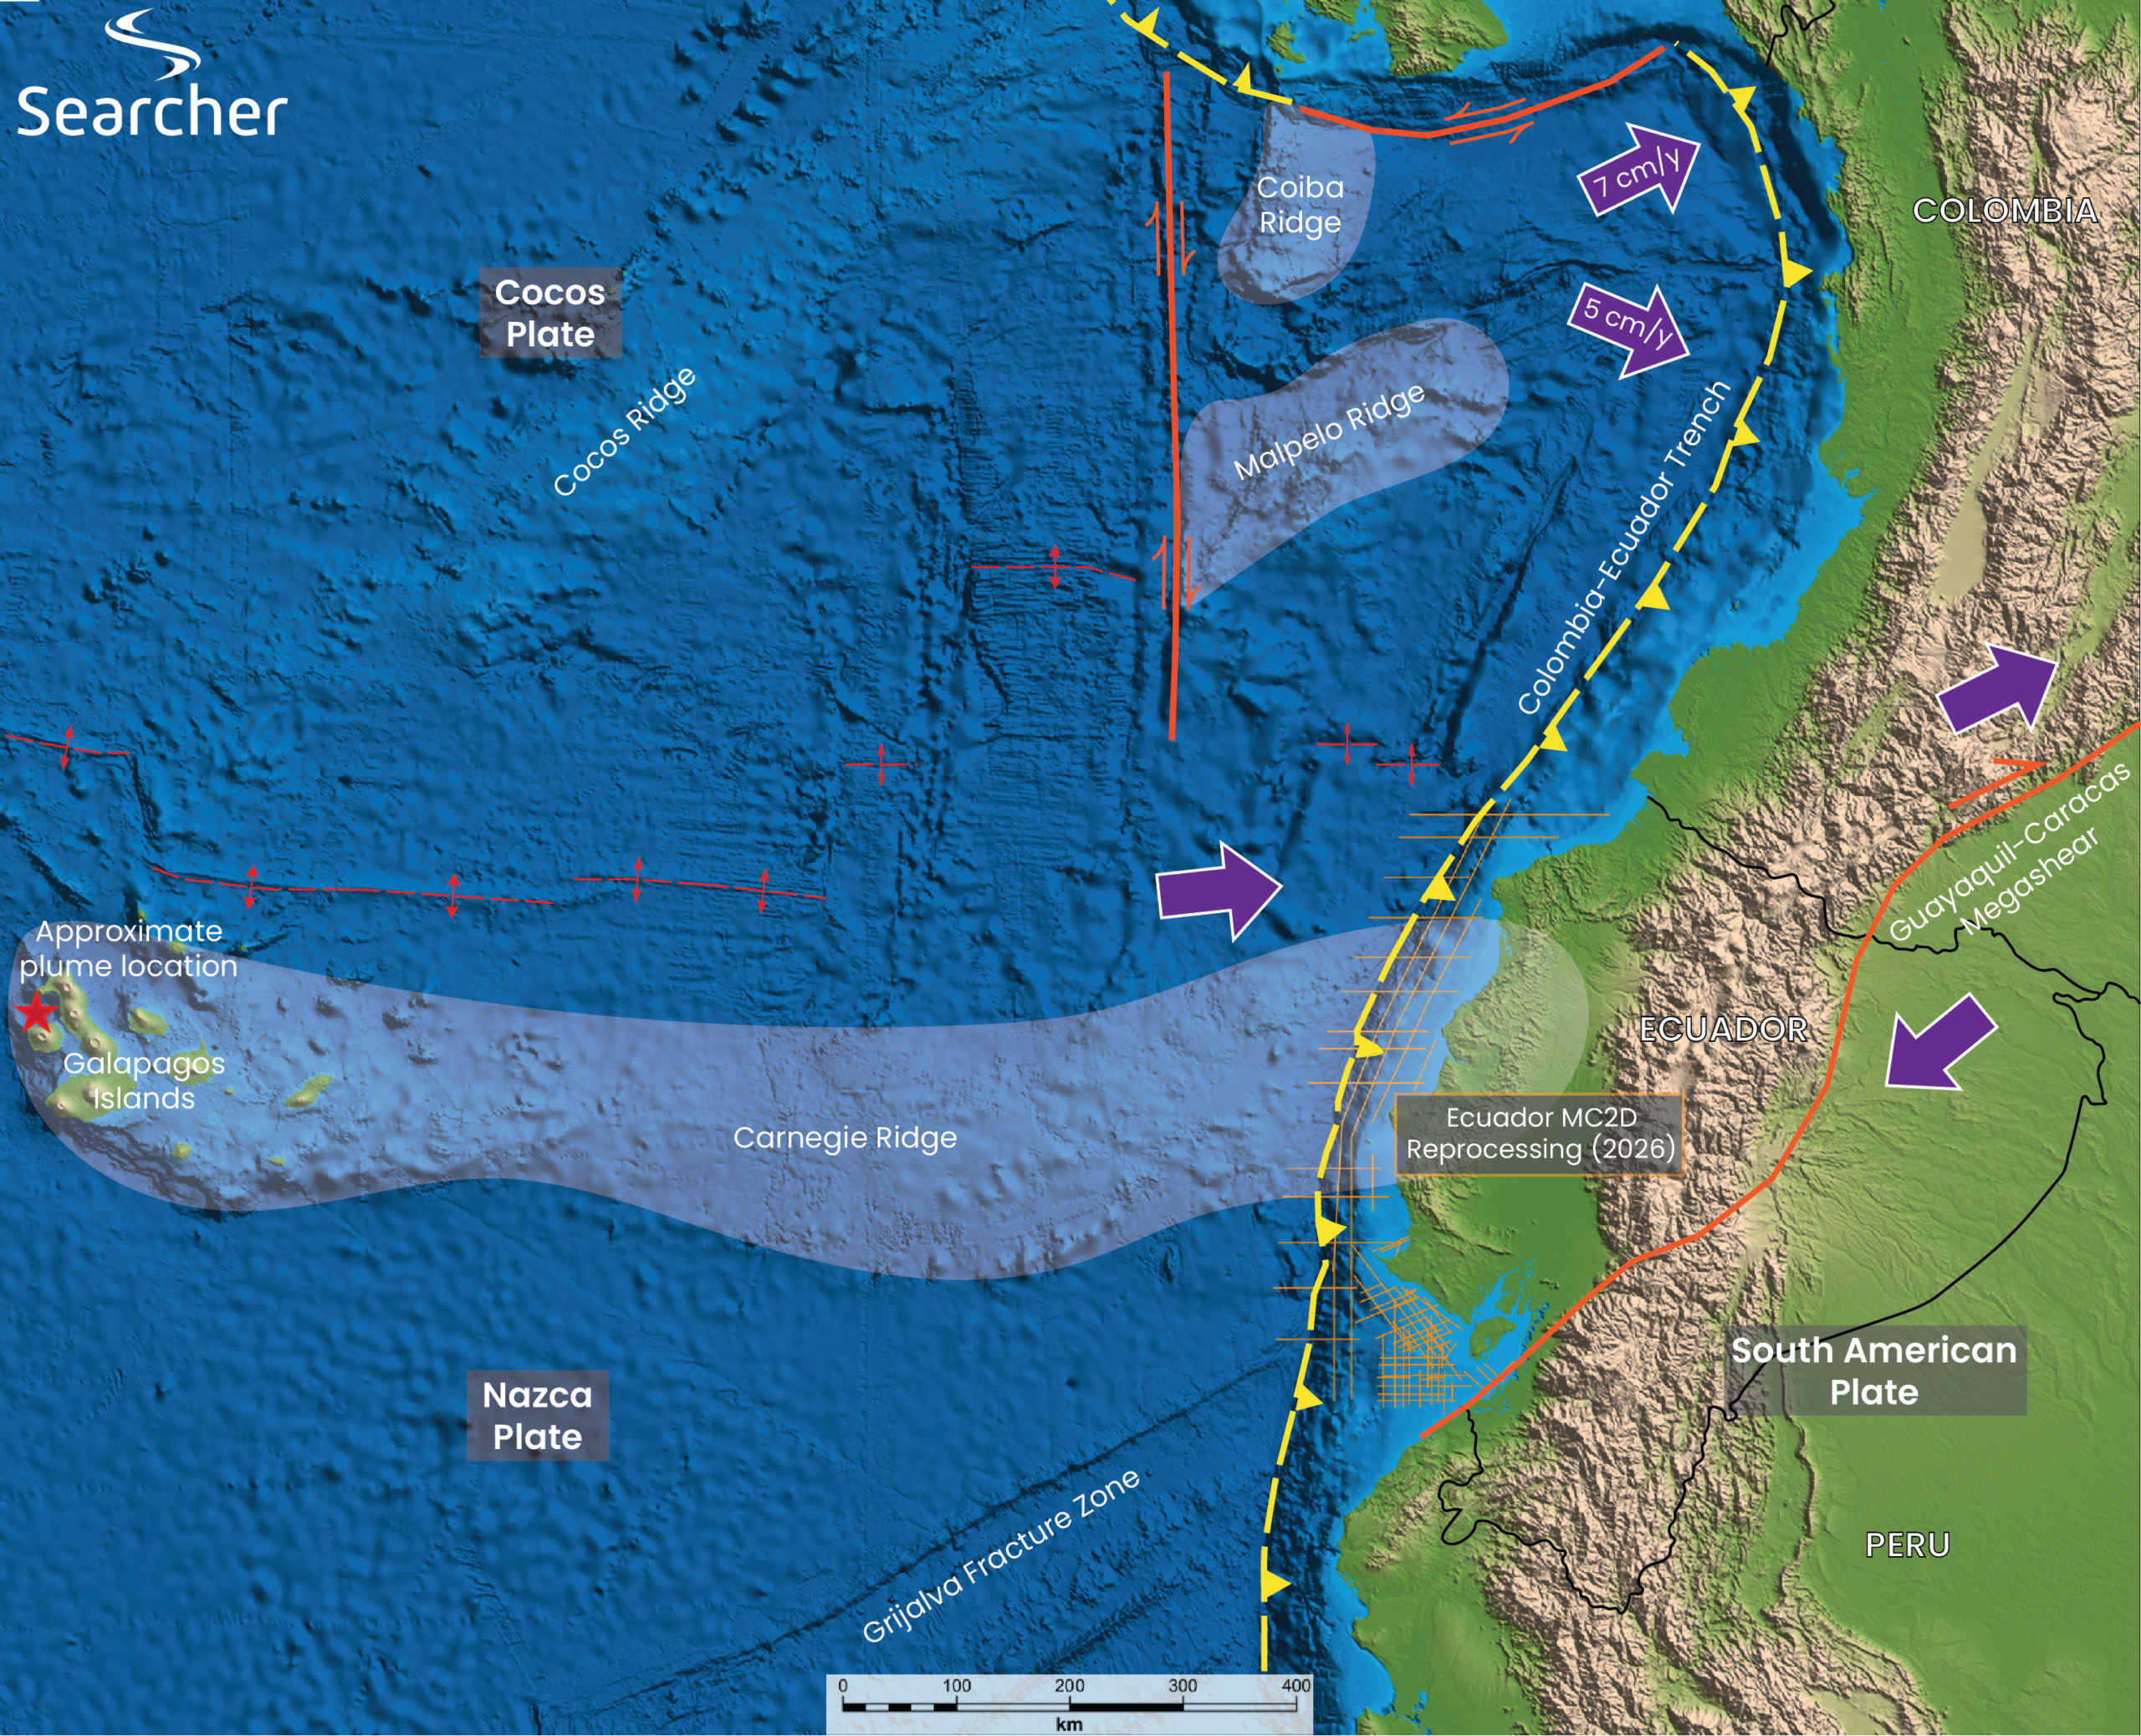
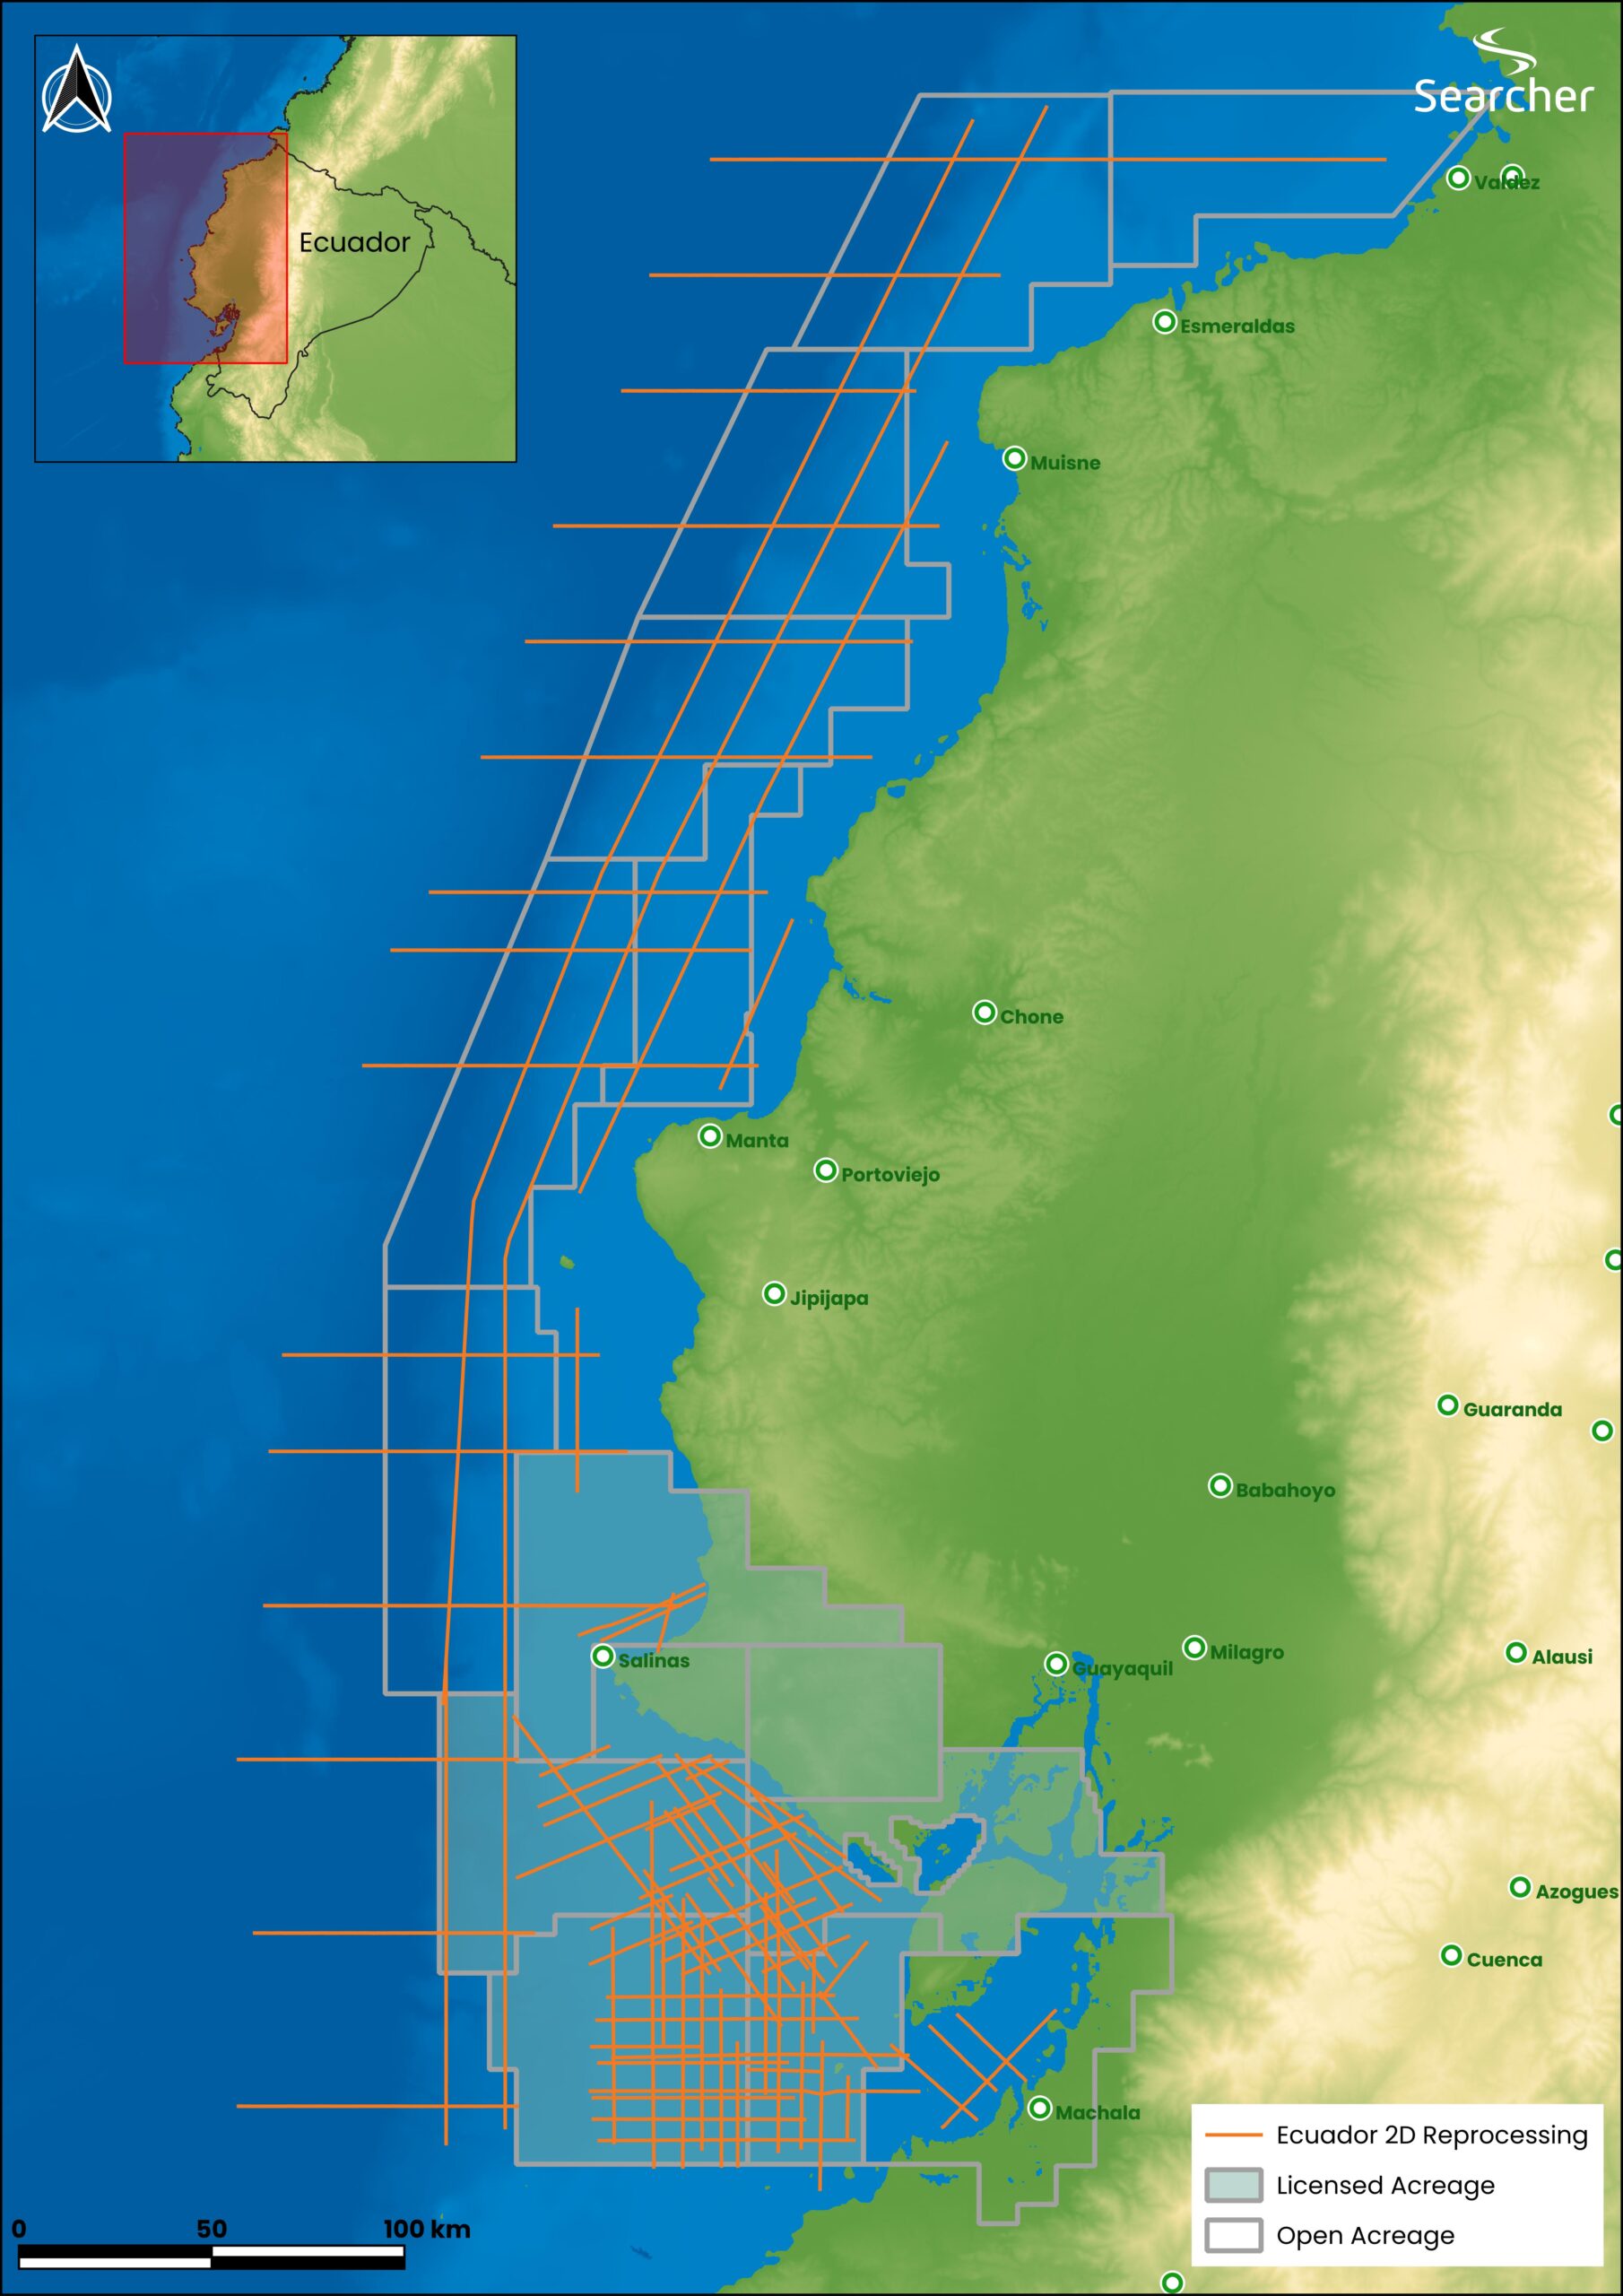
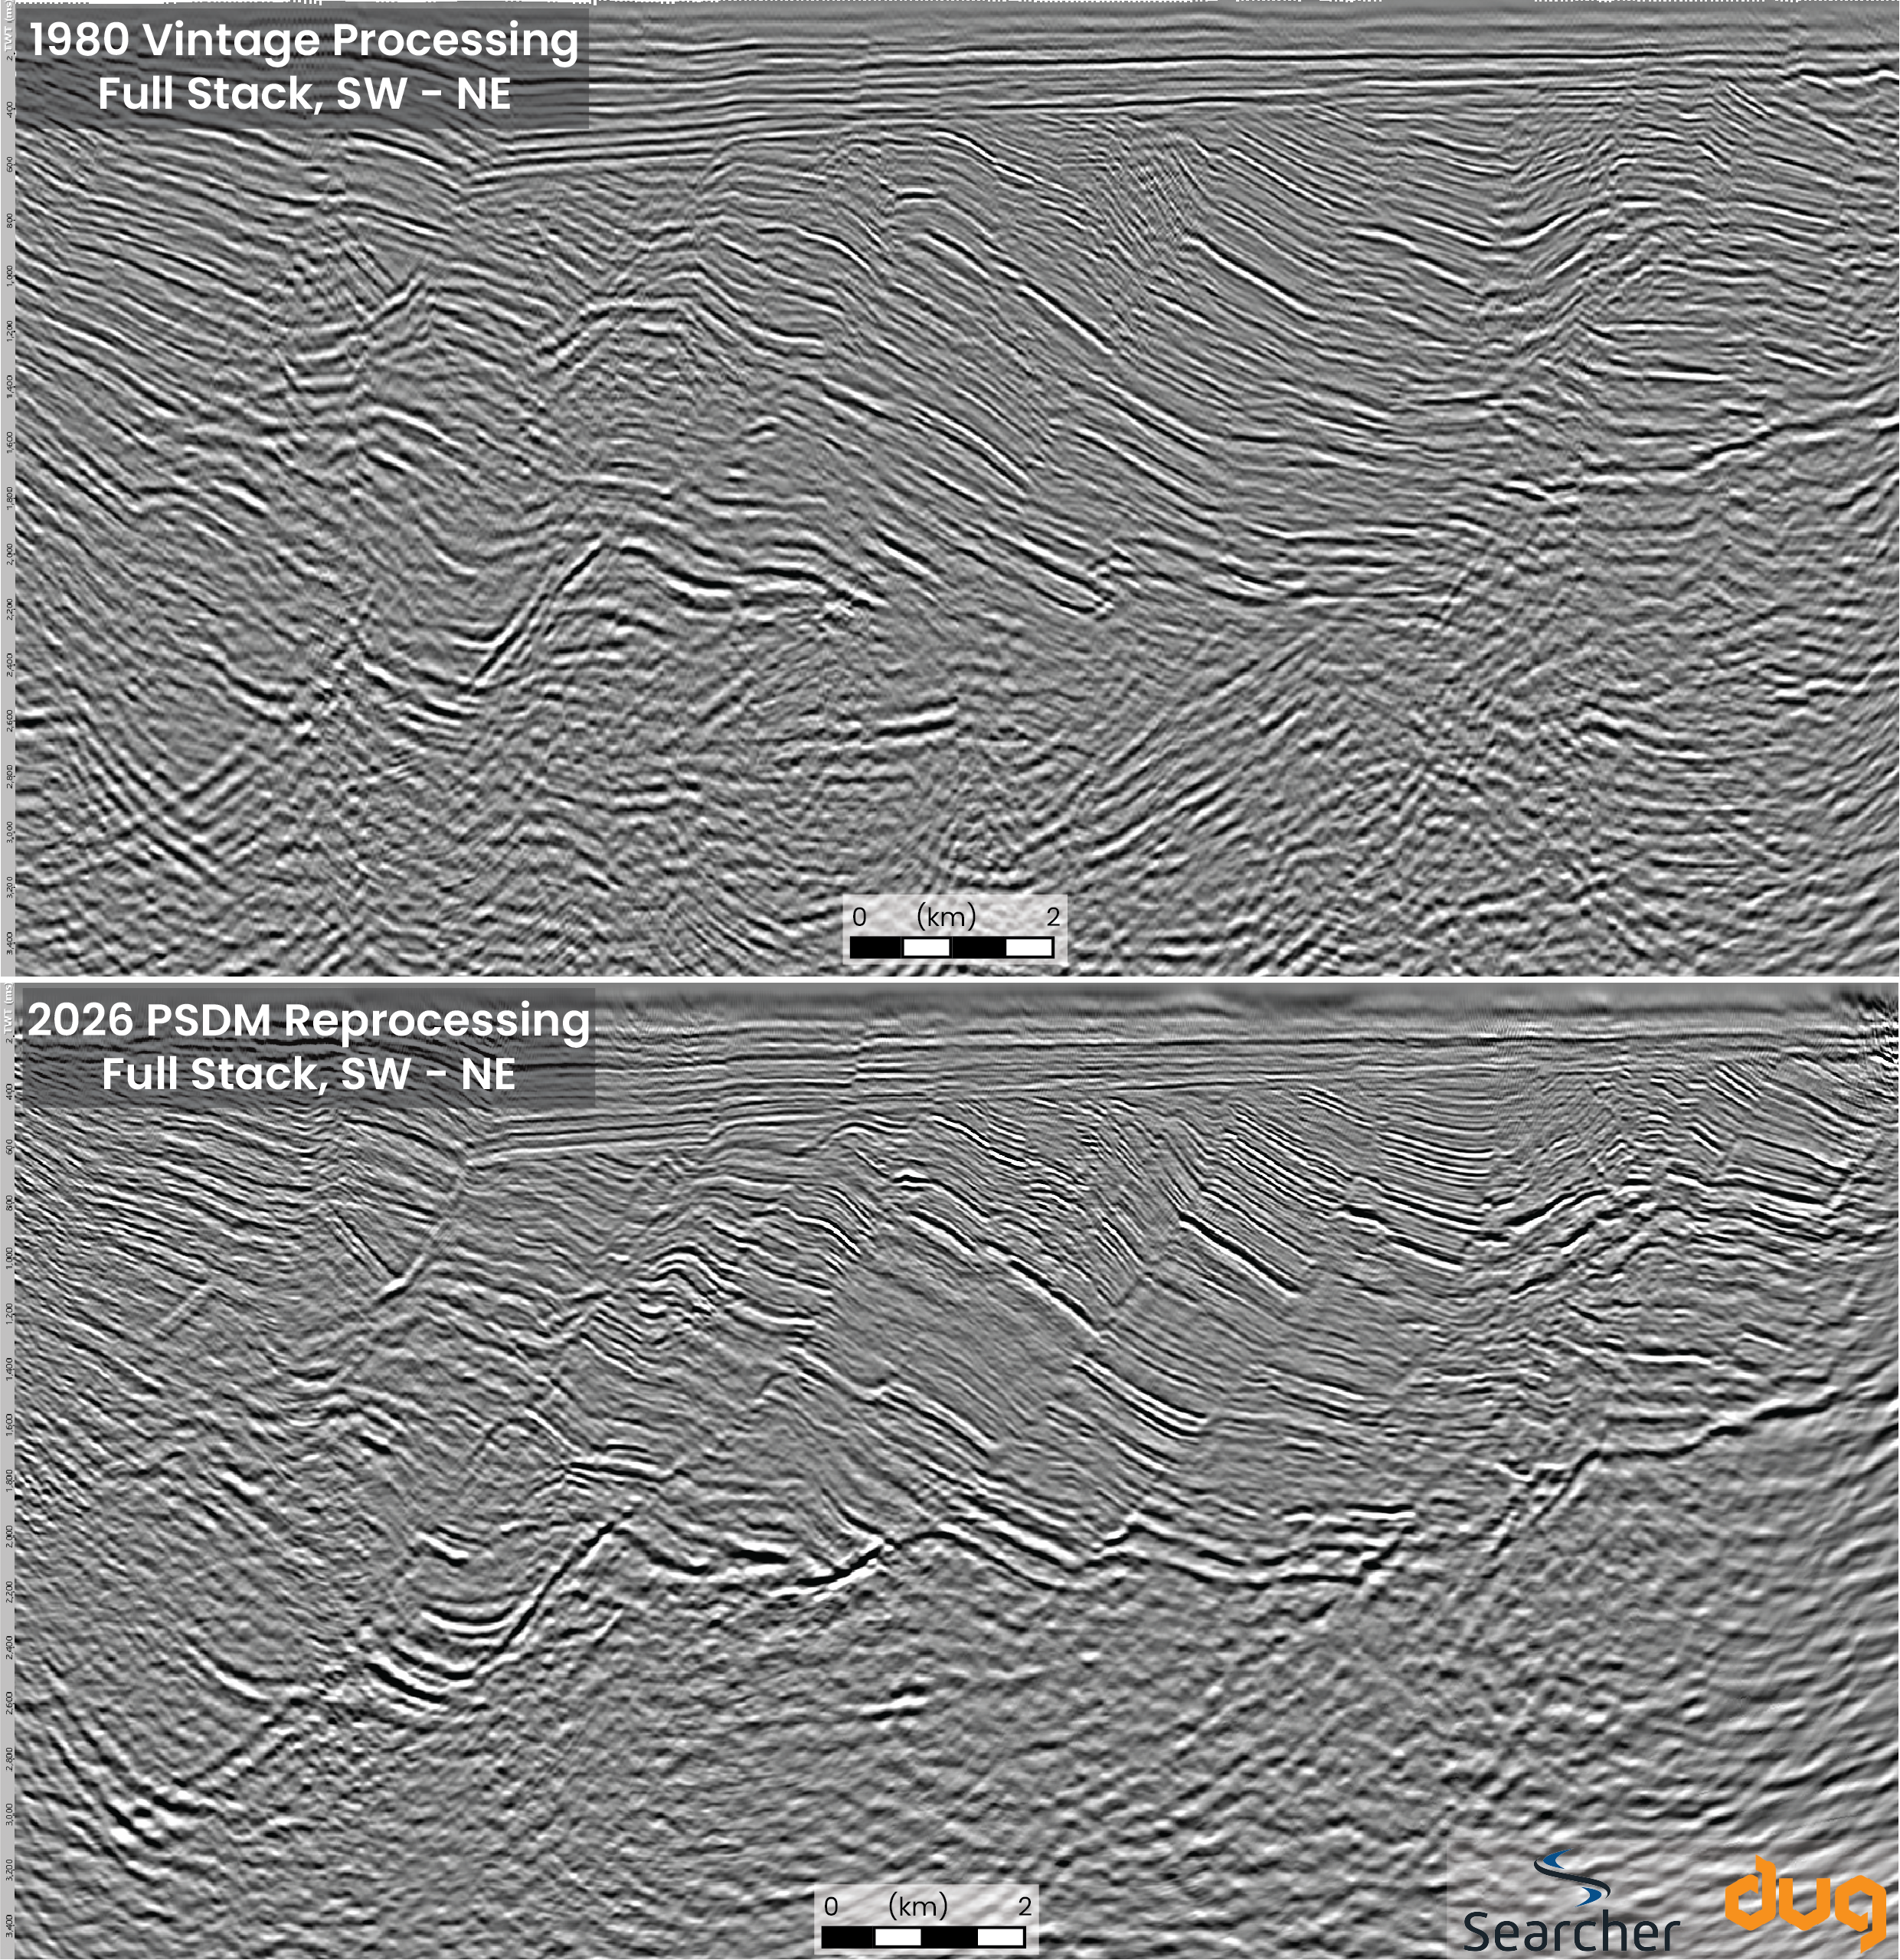
Ecuador has an estimated 8.3 Bbbl of oil reserves and a rich history of oil exploration and production within the Amazon Basin east of the Andes. To the west of the Andes, early onshore exploration resulted in a number of onshore oil discoveries, which provided much of Ecuador’s oil exports from 1920 to 1960. Taking this oil province offshore with the rudimentary seismic available in the 1960s and 1970s led to a hit-or-miss exploration affair, and despite oil, condensate and gas discoveries, the offshore sweet spot remained illusive. Until now. Reprocessing of the legacy seismic dataset, using 2026 technologies, is generating new confidence in offshore exploration. It is clear now that this offshore margin, with its large prospects (that we can now image), in shallow water, is so prospective, it’s like looking for a candy in a sweetshop. Indeed, seismic reprocessing follows much the same path as extracting sugar from sugar cane. Raw materials – the legacy offshore Ecuador datasets – are carefully pounded by modern algorithms until the sweet primary signal is distilled from the chaff of noise and multiples that made working the data so difficult for the early explorers. The destructive margin setting for Ecuador’s northern offshore margin has its own complexity in this region, as the oceanic crust being subducted includes a spreading centre, multiple fracture zones and the consumed oceanic crust carries the sunken remnant of the Galapagos plume trail (Figure 1). The Gulf of Guayaquil Basin, however, comprises a strikeslip related pull-apart basin, formed at the junction between the continent-spanning Guyaquil-Caracas Mega-shear and the obliquely subducting Nazca Plate. Into this basin, the erosional derivatives of the local Andean Granitic mountains have been constantly pouring, providing abundant quartz-rich coarse sandstone reservoirs. The Ecuadorean offshore basins have also been considered complex structurally; however, this is due partly to the woeful imaging of legacy seismic. What these legacy 2D and 3D datasets, recently made available by Searcher, do reveal is a very thick Tertiary clastic sedimentary package and an array of time variant structural styles from compressional thrusts and folds to extensional half grabens, with many, potentially huge, traps which were not optimally imaged with the legacy seismic data, and so to address this, Searcher, in collaboration with the Ministry of Energy and Mines (MEM), have reprocessed 5,000 km of 2D seismic data on this margin (Figure 2). Searcher’s reprocessing has enhanced the seismic imaging along this margin, allowing the structuration to be imaged, the prospects to be mapped and offering accurate far-angle stacks and flat gathers to address the distribution of reservoir, fluid, and source rocks in the Ecuadorean Basins. The regional subset of lines selected to be reprocessed was based on several criteria including available and usable field data, lines with the best well ties; making sure to capture interesting structures and features with potential for image enhancement; providing sufficient coverage over offshore blocks and under clusters of high confidence oil slicks; including lines covering previously identified prospects which, when reviewed by the Searcher team, still seemed viable. Outboard and to the north, over the Esmeraldas / Manabi offshore sub-basins, long strike lines were included as well as dip lines showing indications of deep reflectivity and clear BSRs (Bottom Simulating Reflectors at the base of gas hydrate zones). To the south, lines were selected to tie with Searcher’s available dataset in Peru. Several challenges are faced during the reprocessing of such old, vintage datasets. However, deghosting (removal of source and receiver ghosts) is key to improving the bandwidth of the data. By paying careful attention to maintaining data consistency over such a large area and a wide range of water depths, Zero Phasing and noise and multiple removal challenges could be overcome allowing careful velocity model building. With the final PSDM imaging uplift, structural and stratigraphic definition is greatly improved across the entire Ecuadorean margin (Figure 3). The reprocessed regional 2D seismic dataset has provided exciting insights into what was already suspected to be a prospective forearc basin (Pacific oil rush: The sequel – and this time it’s Ecuador, GEO EXPRO Vol. 21, Issue 6, 2024). In the Gulf of Guayaquil, where the producing Amistad Field has proven a working gas and condensate petroleum system, there is also a working oil generative system, and the light oil production has been successfully tested in the Golfo de Guayaquil-1 well to the south, near the border with Peru. Various other wells have reported fluorescence and oil shows, and many natural high-confidence oil slicks have been identified with satellite data. Using the reprocessed data, a set of very large prospective and undrilled structures has been imaged, based on seismic horizons that are more continuous, with higher resolution and better amplitude content. The sweetness attribute is a very useful tool for delineation and identification of the depositional environment of a sequence, distribution of reservoir facies and source rock. In the sweetness attribute display used in the Foldout image here, we are combining instantaneous amplitude (reflection strength) and instantaneous frequency (calculated by dividing the amplitude envelope by the square root of the instantaneous frequency). Use of this attribute in hydrocarbon exploration, both defining sedimentology (channel detection, lithology discrimination) and hydrocarbon detection (both in reservoirs and source rocks), has been well documented since its discovery in the 1990s. The value in the sweetness display is that it reduces the contribution of high-frequency events to the display. Areas containing higher amplitudes and lower frequencies (sandy intervals) will display the highest values for sweetness, while lower amplitude and higher frequency sediments (thinly bedded shales) will show lower values for sweetness. A first pass evaluation using the sweetness attribute (Foldout) shows events with anomalously high values (high amplitudes with low frequencies), pointing out potential source rocks of Eocene to Oligocene age. We observe that when these events are more deeply buried, strong shallow anomalies are observed above them, connected by faults acting as hydrocarbon migration conduits. The data have revealed large structures, acting as natural foci for hydrocarbon migration. Most importantly in this reprocessing project, Searcher have generated a unique set of angle stacks (near-ultra far up to 44°) which is aiding in the identification of Avo Type II, Type III and Type IV anomalies. Traps are imaged onlapping onto these large structures and / or terminating at major faults, where a series of events with strong sweetness and AVO Type II and III response have been mapped. Natural Oil slicks and seeps have been reported directly above the same areas with deeply buried source rock (Type IV anomalies) and above some of the large structures. A stacked set of potential accumulations in combined structural and stratigraphic traps of between 50 and 150 km2 has been mapped on the Far Angle Stack. Despite the hiatus of exploration in the offshore, as the early explorers suspected that the play elements were all there, and yet for the first time, the seismic imaging can keep up. Only now, offshore Ecuador, we can seek the sweet spot in the sweet shop.
“Seeking the Sweet Spot in offshore Ecuador’s Sweet Shop”
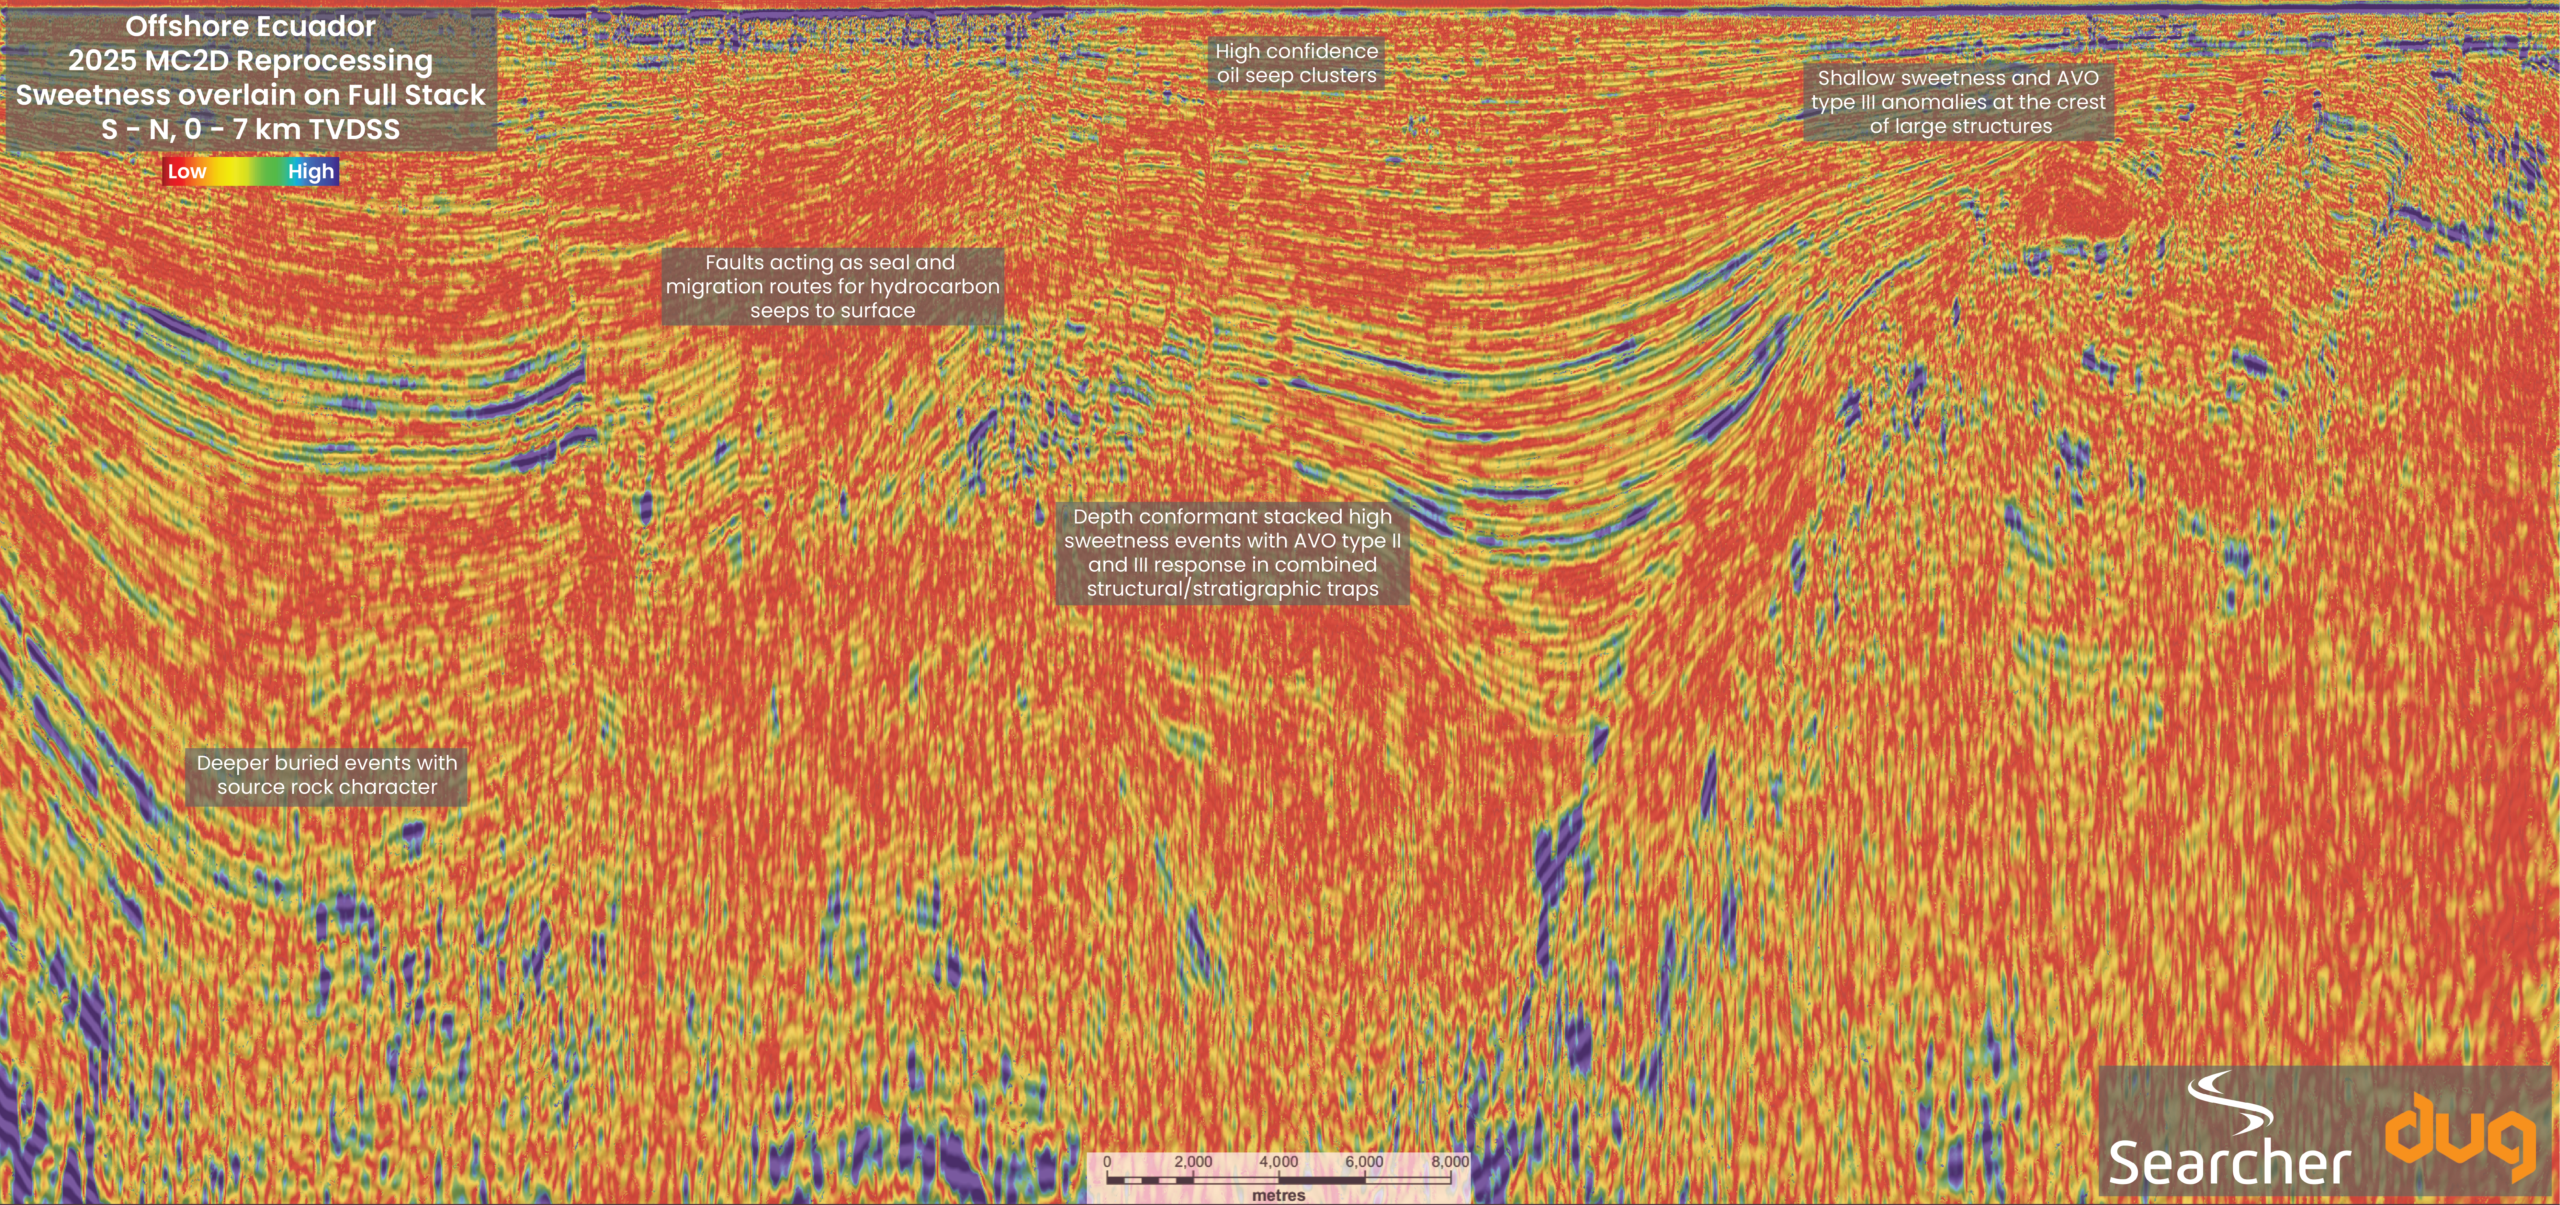 2025 reprocessed Gulf of Guayaquil 1983 2D seismic line: Final PSDM (TVDSS) sweetness attribute highlighting higher amplitudes and lower frequencies (sandy intervals) with the highest values for sweetness, while lower amplitude and higher frequency sediments (thinly bedded shales) show lower sweetness values.
Searcher use of modern processing algorithms to unleash the hidden sweetness in Ecuador’s legacy offshore seismic
Setting the scene
Seismic reprocessing
Extracting the sweetness
Related Articles