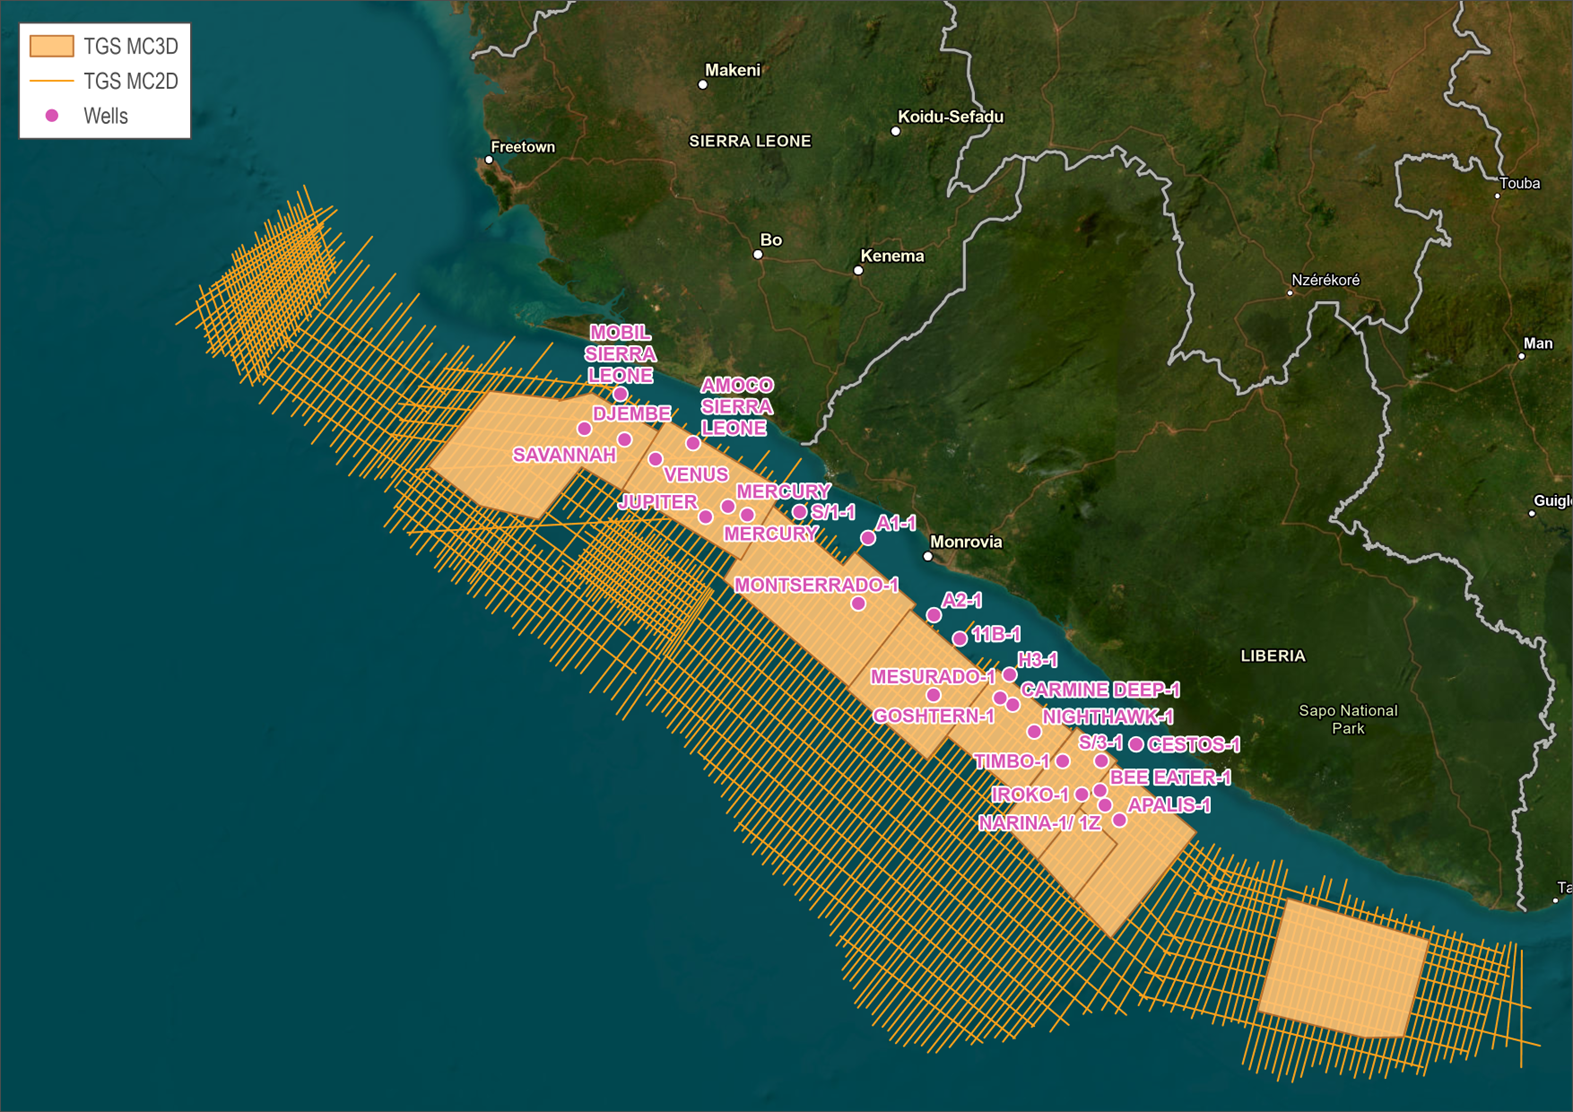
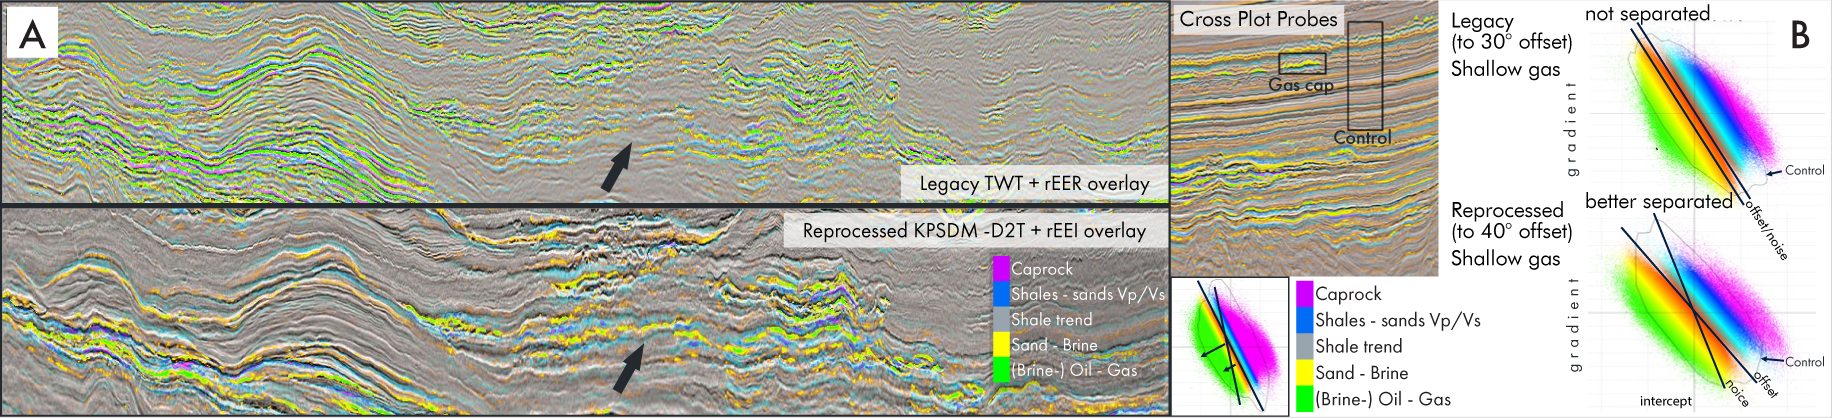
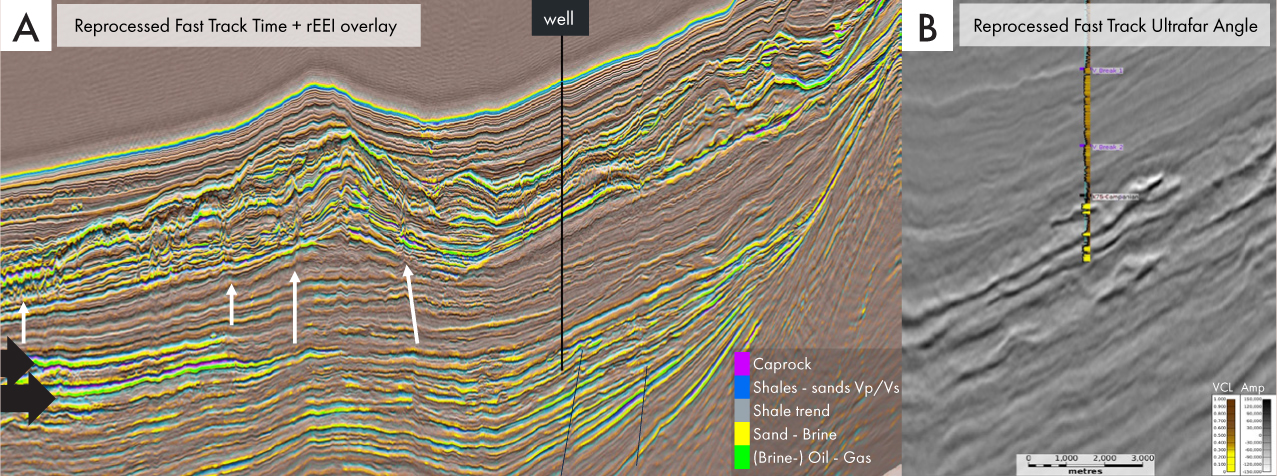
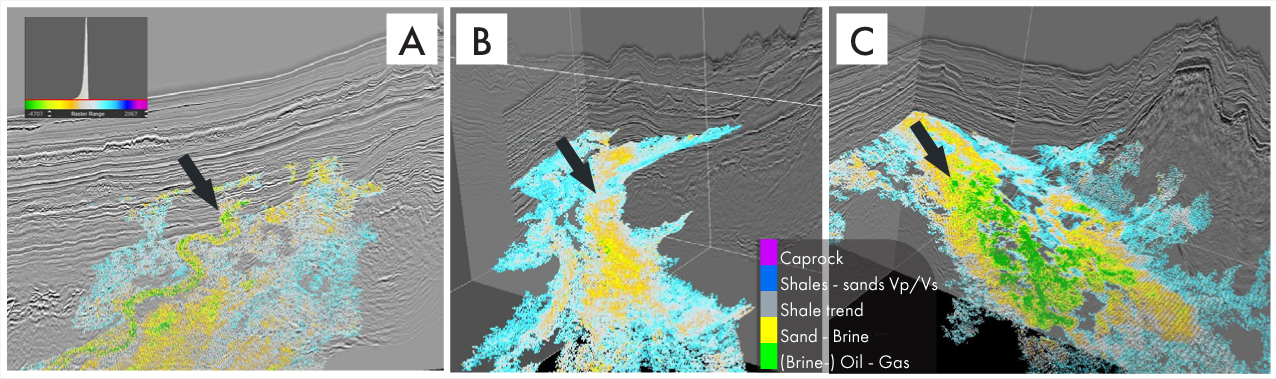
Newly broadband reprocessed pre-stack depth migrated data, utilising advanced pre-processing, velocity model building and Full waveform inversion (FWI) techniques, allow more accurate interpretation of borehole-to-seismic attribute ties. In turn, the data reveal a more complex geological context of direct hydrocarbon indicators (DHI) mapped from seismic attributes and their calibration in post-drill interpretations, which may contradict previous conclusions from prospect amplitude versus offset (AVO) analyses, and are shown by examples offshore Sierra Leone and Liberia, reprocessed in 2025 and 2026 using modern broadband workflows incorporating deghosting, advanced demultiple and FWI-based velocity model building. Figure 1 shows synrift growth sequences and post rift targets, such as Cretaceous and Paleocene shelf edge traps and mixed deepwater turbiditecontourite systems, Cretaceous source rocks, and regional seal. When reprocessed seismic AVO analysis results change conclusions for mapped targets at borehole and undrilled locations, systematic AVO QC is essential to demonstrate that amplitude fidelity is preserved during reprocessing and improvements are achieved without compromising these attributes. Workflows that interrogate and showcase that the AVO fidelity is real and robust are especially important when multiple legacy surveys are combined, and provide a crucial quantitative indicator of how acquisition differences have been reconciled during reprocessing to provide a continuous volume fit for AVO analysis. The Sierra Leone and Liberia case studies demonstrate how these improvements extend beyond individual well locations, supporting reliable regional screening with confidence in amplitude fidelity and, therefore, DHI mapping. Whilst specific QC metrics of spectral analysis, bandwidth evaluation and amplitude decay studies can be performed, this article will focus on derivative control measures of AVO. Pre-stack amplitudes across offset and angle, and the behaviour of the compressional and shear wave velocities (Vp/Vs), are visualised as impedance domain attributes such as relative extended elastic impedance (rEEI, using inversion) or reflectivity (rEER, using angle stacks) at a rotation angle of 27° (Went, 2021; Went and Hedley, 2023). These are a function of the acoustic / elastic velocity relation and provide an effective bridge between well-scale rock physics understanding and regional-scale exploration scouting. Thus, by reducing sensitivity to wavelet effects and evaluating seismic responses in intercept-gradient domain, these attributes enable subtle reservoir and fluid effects to be mapped where conventional full stack amplitudes are insufficient. Upon review of the reprocessing examples in Sierra Leone and Liberia, we can see improvements on the rEER AVO attribute overlaid on final full-stack migrated data, including amplitude continuity and seismic facies distinction (Figure 2A), lithofacies where calibrated with a borehole (Figure 3A). We can also validate the improvement in shallow gas accumulations, whose cross-plot response evolved from being ambiguous on legacy data to a consistent class IV on reprocessed partial angle attributes (Figure 2B). As shallow gas features are first-instance DHIs indicating fluids in the subsurface, understanding what we see and how the seismic attributes calibrate with these insights is a first step in mapping possible targets, charge and migration path scenarios on modern seismic 3D images. Residual ambiguity in amplitude behavior on modern processed and QC’d data can often no longer be attributed primarily to processing artefacts and must instead be interpreted in terms of lithology, reservoir quality, diagenesis and pore space alteration. Figure 3 showcases the ongoing Liberia elastic FWI broadband reprocessing of several vintage 3D surveys. Post-drill assessment of the well to seismic ties the main target to brine sands, imaged on the ultra-far angle stack as Vp/Vs soft anomaly and interpreted as clean reservoir quality sands (Figure 3B), whereas on legacy amplitudes the well was interpreted as a hydrocarbon charge. This suggests that the low impedance anomalies downdip may be fluid related (Figure 3A). Modern 3D seismic with systematic AVO QC tied with well data rock physics for specific reservoirs allows interpreters to map anomalies more confidently. Such calibration also provides some indication of fluid-over-brine anomalies in basins that, during post-drill interpretation, have been revealed to contain both hard and soft sands, and a strong lithology anomaly in the impedance space (Went et al, 2024). Many such effects can be observed in the 3D images of the upper slope across the Sierra Leone and Liberia Basins. With structural image improvements and better continuity and clarity of seismic facies and attributes after reprocessing and AVO QC, as discussed in Figure 2, and re-interpretation of borehole rock physics, and updated well-to-seismic tie and Vp/Vs calibration, as discussed in Figure 3, Figure 4 shows initial results of analysis of known targets on the rejuvenated data set offshore Sierra Leone. The 3D composites display seismic full stack sections combined with wavelet similarity of the far offset stack (25 – 35 degrees) over mapped fairways. The Upper Cretaceous meandering channel (Figure 4A) highlights a maximum soft on the far stack, which is highlighted in green and likely indicates a fluid anomaly, in contrast with the surrounding complex highlighted in yellow being merely a lithology anomaly over the background shale trend. The slope channel fan complex (Figure 4B) also maps as a brine anomaly at this reservoir level over the top of a large slope-to-basin fan complex and indicates this layer is unlikely being charged. The deeper reservoirs of the older and larger stacked fan complex (Figure 4C) seemingly map with a hydrocarbon anomaly over the crest of the stratigraphic trap of the splay. While tools such as deghosting, advanced demultiple and FWI consistently improve pre-stack amplitude stability and bandwidth, enhanced data quality does not automatically lead to simpler or less ambiguous interpretation. Instead, improved imaging often reveals geological complexity that was previously unresolved in legacy datasets, shifting the primary source of uncertainty from data quality to subsurface geology and rock physics variability. Legacy seismic data often mask geological complexity through limited bandwidth, unstable amplitudes and incomplete offset coverage, resulting in seemingly cleaner data but ultimately distracting from key risks associated with reservoir quality, diagenesis and pore space mineralisation, potentially leading to misinterpretations. Modern broadband reprocessing removes many of these limitations, producing datasets that are demonstrably fit for purpose from a geophysical perspective but more sensitive to geological variability. Integrated and iterative interpretation workflows provide a structured and scalable approach to recognising this shift and to derisking exploration decisions.
What to do if reprocessed seismic changes the view on your prospect?
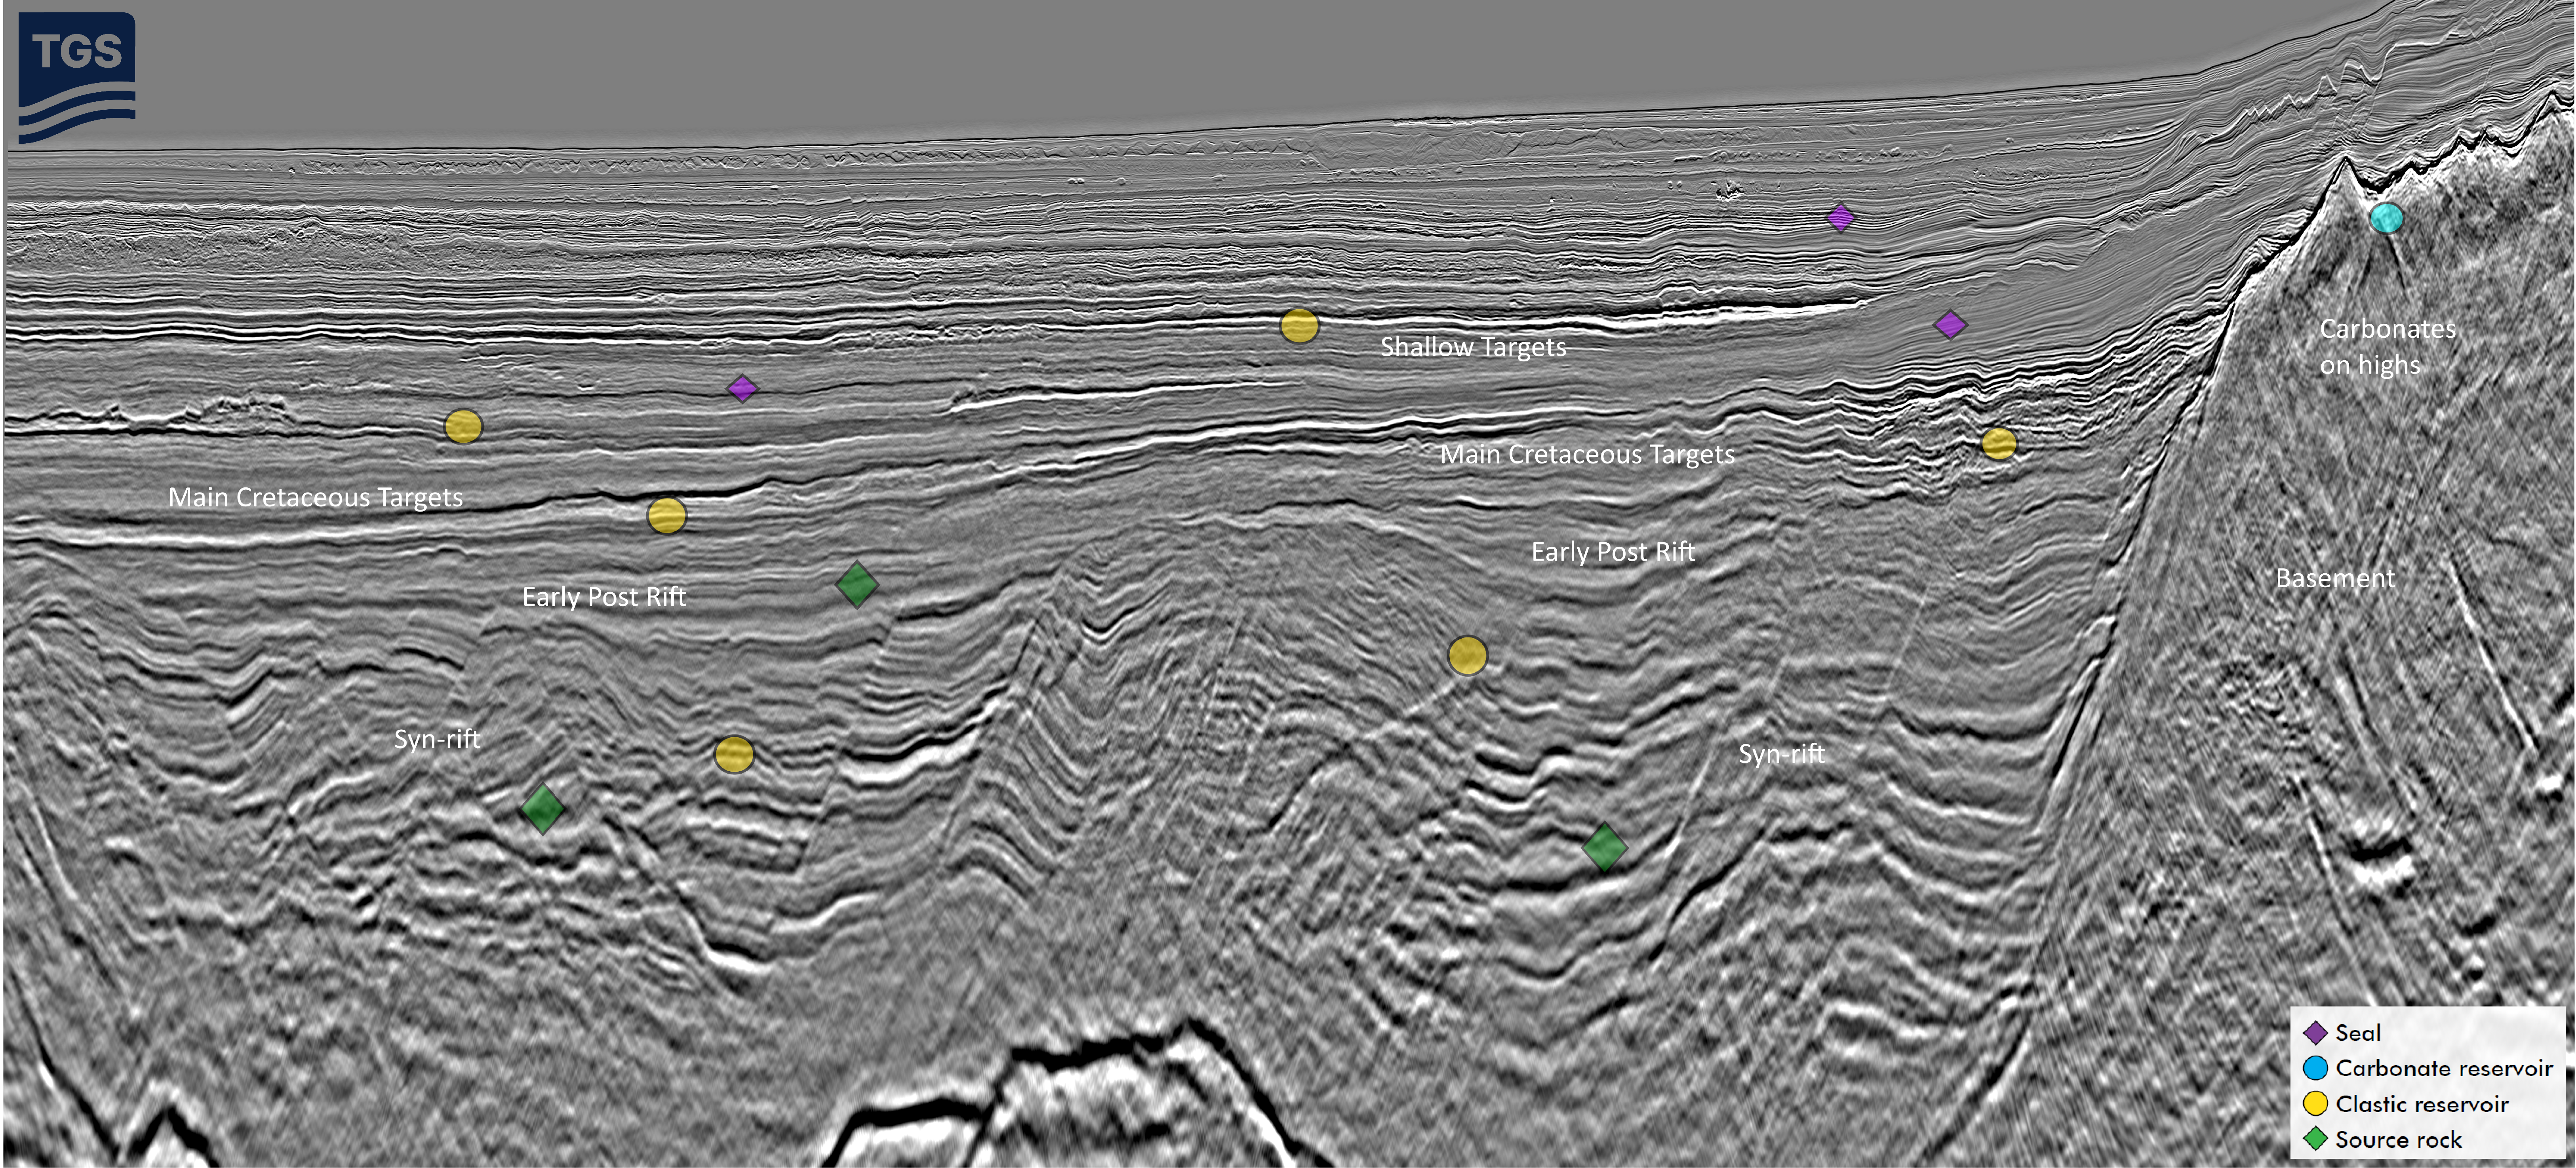 Figure 1: Seismic: 3D depth section across Sierra Leone.
New broadband reprocessing reveals geological complexities around postdrill well-to-seismic calibration
Better assessing the drivers behind impedance anomalies
Why more data requires a more integrated approach
Related Articles