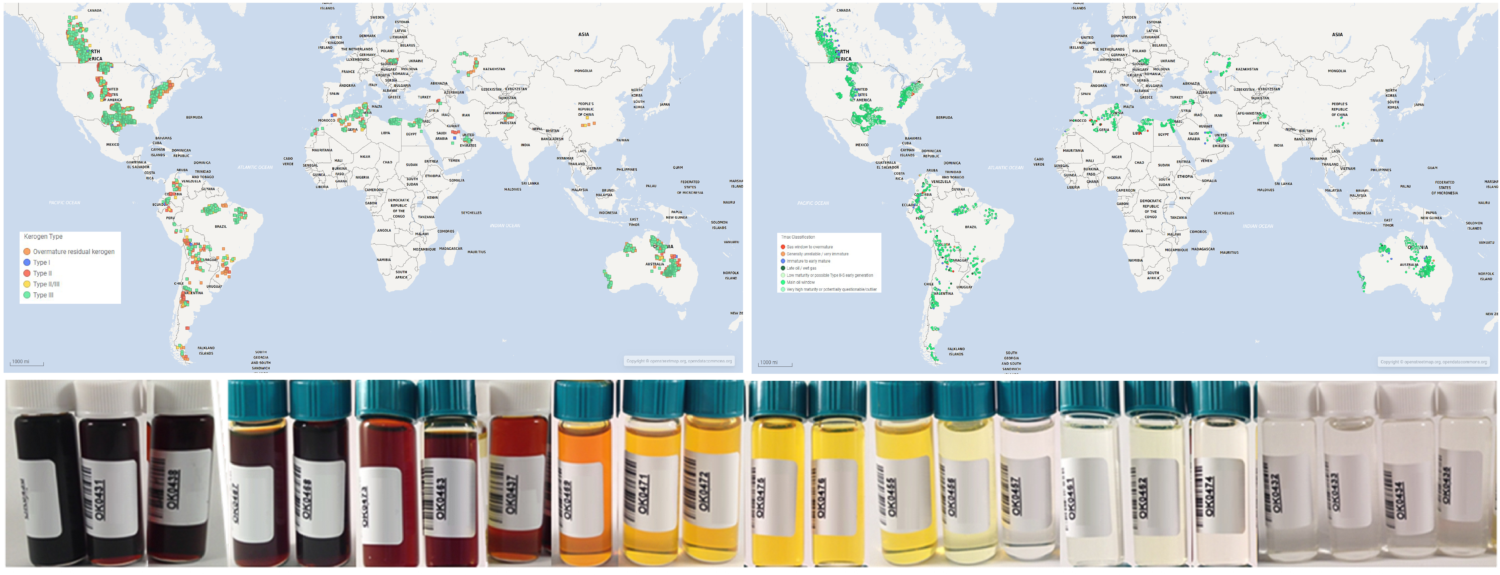
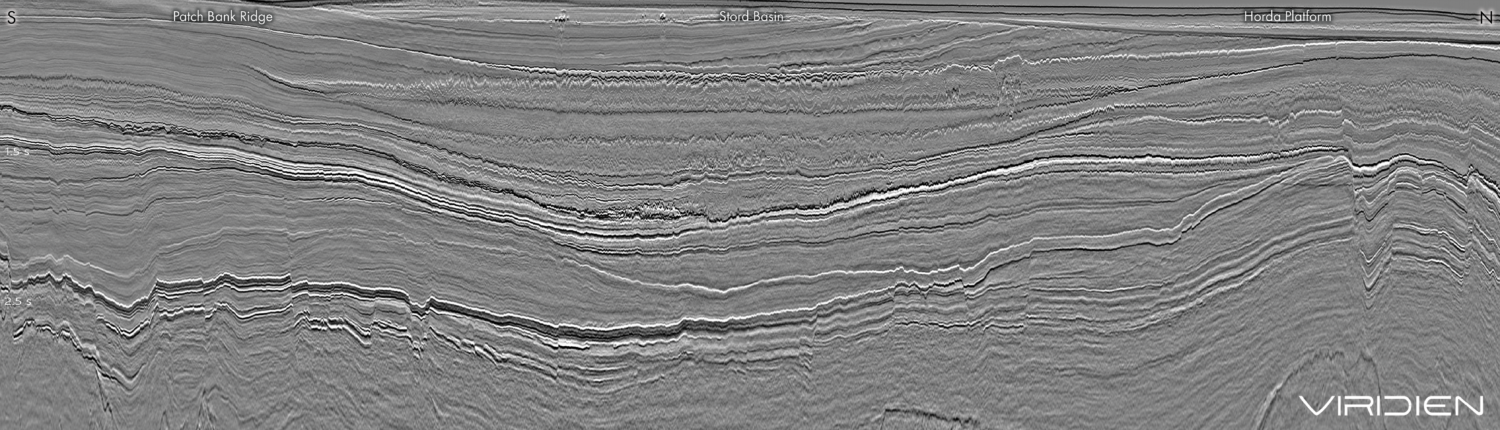
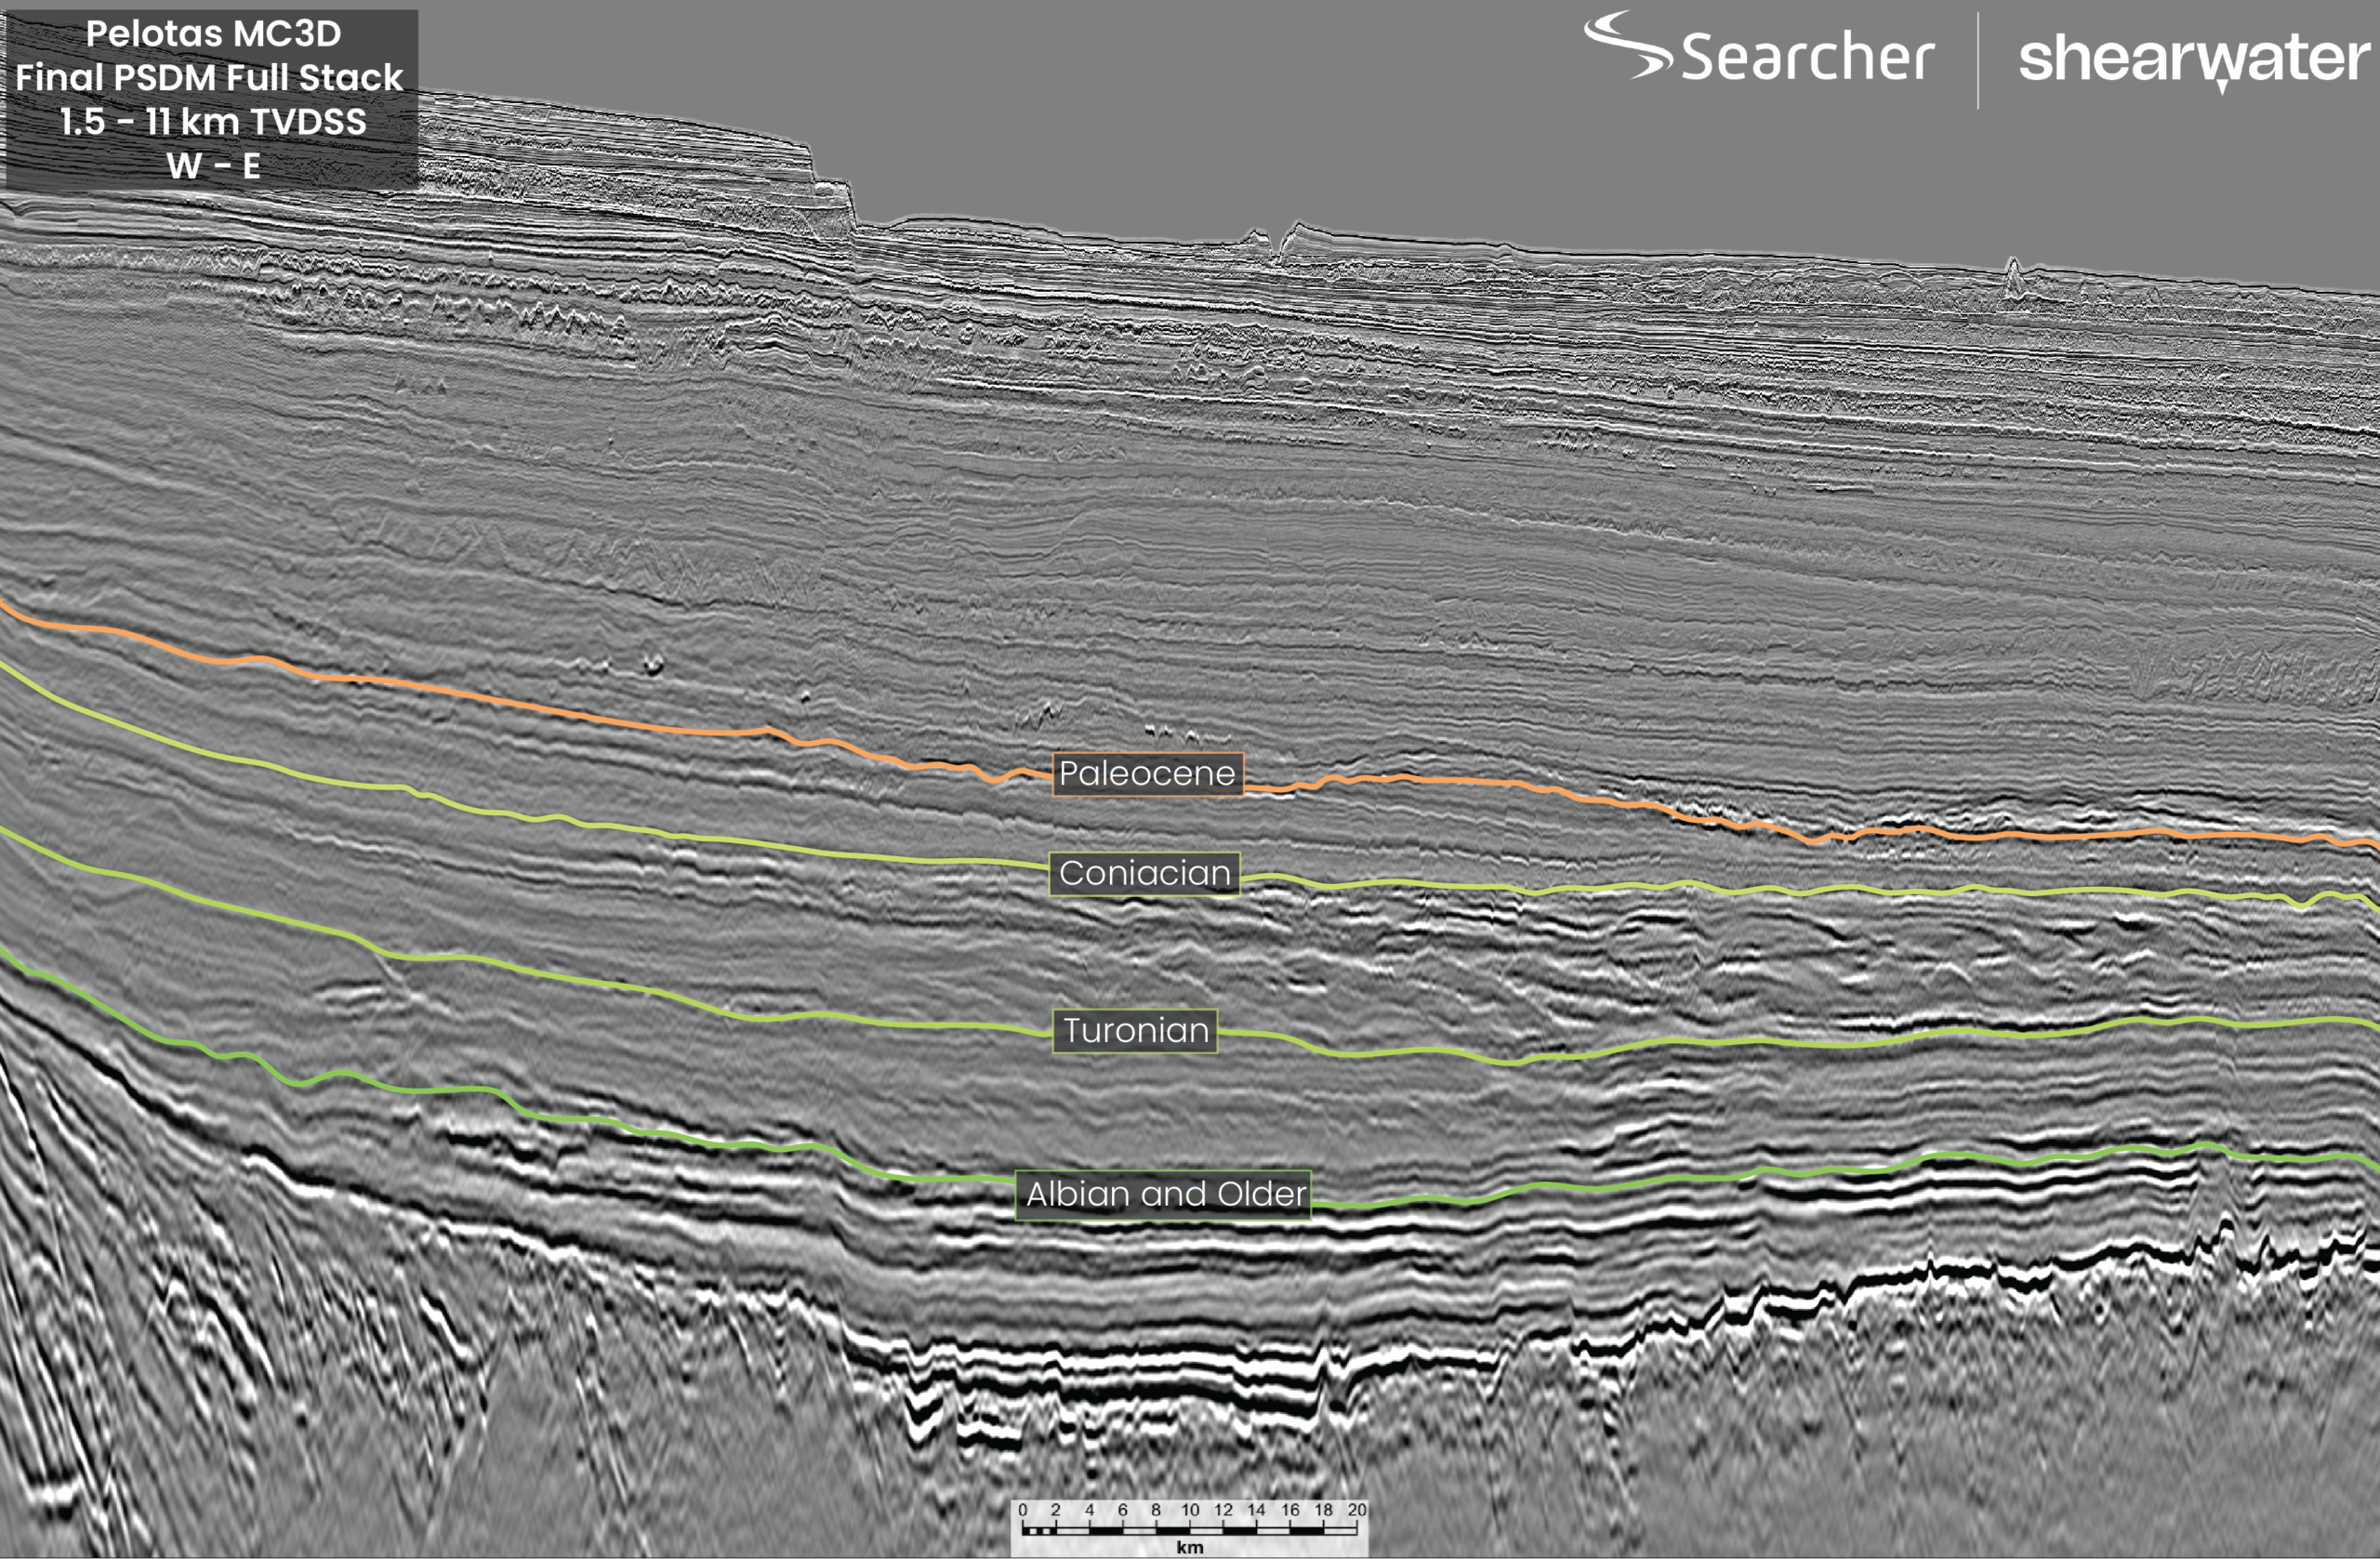
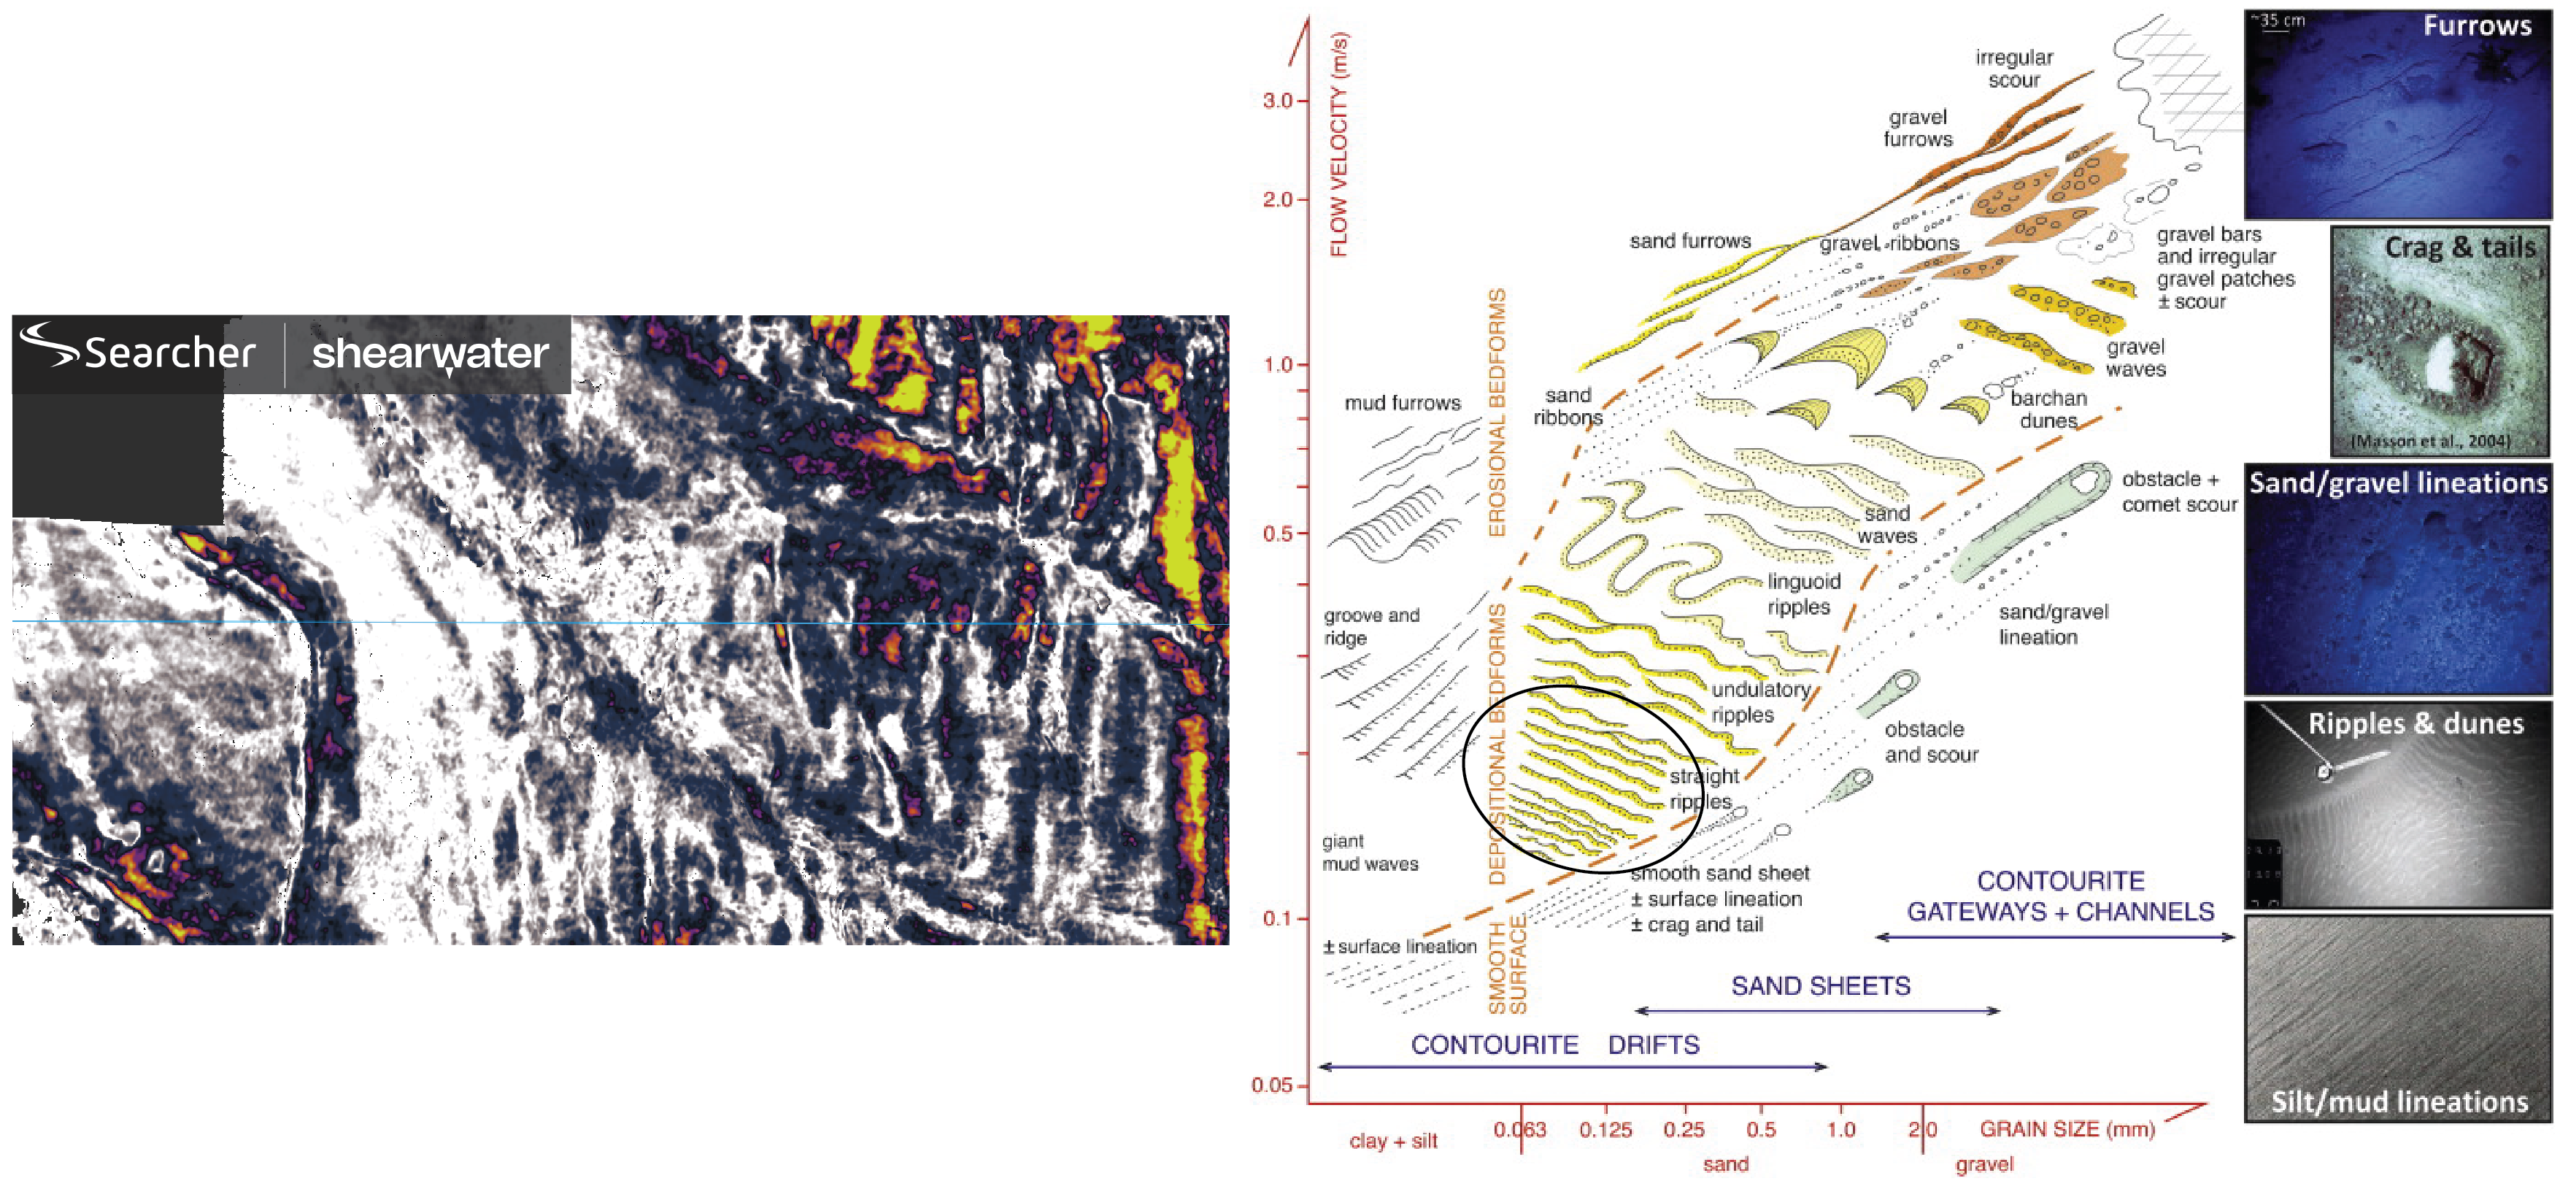
After the Aptian source lying on top of the early-drift oceanic crust, the second most important source rock in the South Atlantic is the Cenomanian-Turonian (CT) sequence, a pelagic organic-rich mud ubiquitously deposited in a global anoxic event. Seismic velocity inversion of 3D seismic data in the Pelotas Basin reveals a nuance to the CT-driven play, interpreted to be partly Like pieces of a jigsaw puzzle, key risk elements to any play (source, reservoir and trap) need to be located and joined together. On seismic, some source rocks stand out, impossible to ignore and in the South Atlantic, the omnipresent Cenomanian-Turonian (CT) interval deposited during a global anoxic event – Oceanic Anoxic Event (OAE2) belongs firmly in this category, at least, most of the time. Globally, the CT OAE2 has generated world-class marine source rocks; from Venezuela’s La Luna Formation to the organic-rich Canje Formation offshore Guyana, this interval has powered some of the most prolific petroleum systems on the planet. Across the South Atlantic, evidence of CT source rocks is widespread: From the MSGBC Basin to Brazil’s Pelotas Basin, and into the conjugate Walvis and Orange Basins, where TOCs can reach double digits. Although the CT interval has often been dismissed as not being buried deeply enough to be mature for hydrocarbon generation, when present, it still tends to announce itself with a signature seismic swagger – a strong low-frequency amplitude event, dimming at far angles, the unmistakable fingerprint of an AVO Type IV anomaly. Thick, organic-rich, and often hydrocarbon-charged, these intervals light up seismic sections and sweetness attributes that boost high amplitude, and low frequency amplifying this signal. So naturally, when the first 3D seismic dataset arrived in the Pelotas Basin, the expectation was clear: Use the seismic to define the source rock distribution in the basin. Whilst this worked perfectly for the Early Cretaceous Aptian Source Rock (as it had in the conjugate margin associated with the of Venus in Namibia), the Late Cretaceous CT interval was not playing ball and displayed a very different set of characters. Searcher’s and partner Shearwater’s newly acquired 3D seismic (2023-2026) revealed a well-defined Aptian source rock package emerging clearly from the data, correlating confidently with the proven system in the Orange Basin across the Atlantic. So far, so good, demonstrating this basin is incredibly prospective. When the top of the CT sequence was tied using calibration from wells on the shelf, a distinct sequence boundary appears beneath a Coniacian channel system (Figure 1). This channel complex, heavily reworked by contourite currents, forms a striking geomorphological feature in the central portion of the seismic line in Figure 1. Up-section, in the CT sequence, the contourite bedforms pass into more parallel, lower-amplitude reflections. And yet the expected Cenomanian-Turonian AVO Type IV source rock indicator anomaly? Well, this is nowhere to be seen. One explanation for the missing seismic signature lies in the contourite system itself. Persistent bottom currents may have reworked the CT interval so extensively that only fragmented remnants remain – thin, discontinuous slivers of what was once a regionally extensive source rock. RMS amplitude maps within this sequence reinforce this interpretation. The dominance of contourite bedforms, coupled with subdued amplitudes, suggests lower-energy currents reworking fine-grained sediments (Figure 2). In such an environment, the original seismic expression of a thick, organic-rich interval could easily be erased – or at least obscured. A less celebrated – but equally powerful – diagnostic of generative source can be fluid pressure disequilibrium revealed from seismic velocity inversions (decrease in velocity with increasing depth). Within the parallel seismic package overlying the contourite bedforms, a clear velocity inversion emerges. Subtle at first glance, but persistent and regionally coherent (Foldout Figure). This is no ordinary anomaly. Organic-rich source rocks are known to exhibit reduced P-wave velocities. High kerogen content lowers density, softens the rock frame, and reduces elastic stiffness. As maturity increases, kerogen transforms into hydrocarbons – fluids that are more compressible than water – further decreasing velocity. Add overpressure into the mix – common in under-compacted, fine-grained systems and velocities drop even more dramatically. Elevated pore pressure weakens grain contacts, reducing stiffness and amplifying the velocity anomaly. In short, low velocity can mean high potential. The observed inversion in the Pelotas Basin can be related to: Furthermore, this interval correlates with a proven Turonian source rock in well 2-BPS-0006A, where TOCs reach up to 4 %. And in addition, a thermal maturity model, constrained by a BSR-derived geothermal gradient, places the interval firmly within the oil window – approximately 100 to 115° C. Given the highly favourable current location of the inferred CT source rock, generated fluids can move both vertically and laterally into adjacent clastic reservoirs, so the mapped AVO Type II and III anomalies outboard and laterally connected to the CT source suddenly take on new significance (Foldout Figure). For years, seismic source rock characterization has leaned heavily on the identification of AVO Type IV anomalies. When present, they are powerful indicators – clear, confident, and easy to map. The Aptian system in the Pelotas Basin fits this model perfectly. But the CT interval in the Pelotas Basin tells a different story. Here, the absence of a classic seismic response nearly led to a missed opportunity. It took a shift in perspective – from amplitude to velocity – to reveal what had been hiding in plain sight. Not all source rocks shout – some whisper through velocity fields, subtle inversions, and secondary attributes. They require a different kind of listening. So, is the CT source rock working in the Pelotas Basin of the southern South Atlantic? The evidence is mounting. If confirmed by future drilling, it could reshape our understanding of the region’s petroleum systems – bringing it closer in line with the prolific basins further north. Because sometimes, when the amplitudes go quiet and the character you are looking for disappears, you don’t abandon the hunt; you just pick up another tool.
A Cenomanian- Turonian source rock adventure in the Pelotas Basin
reworked by contourites. The hunt for tools to chase this phenomenon is on…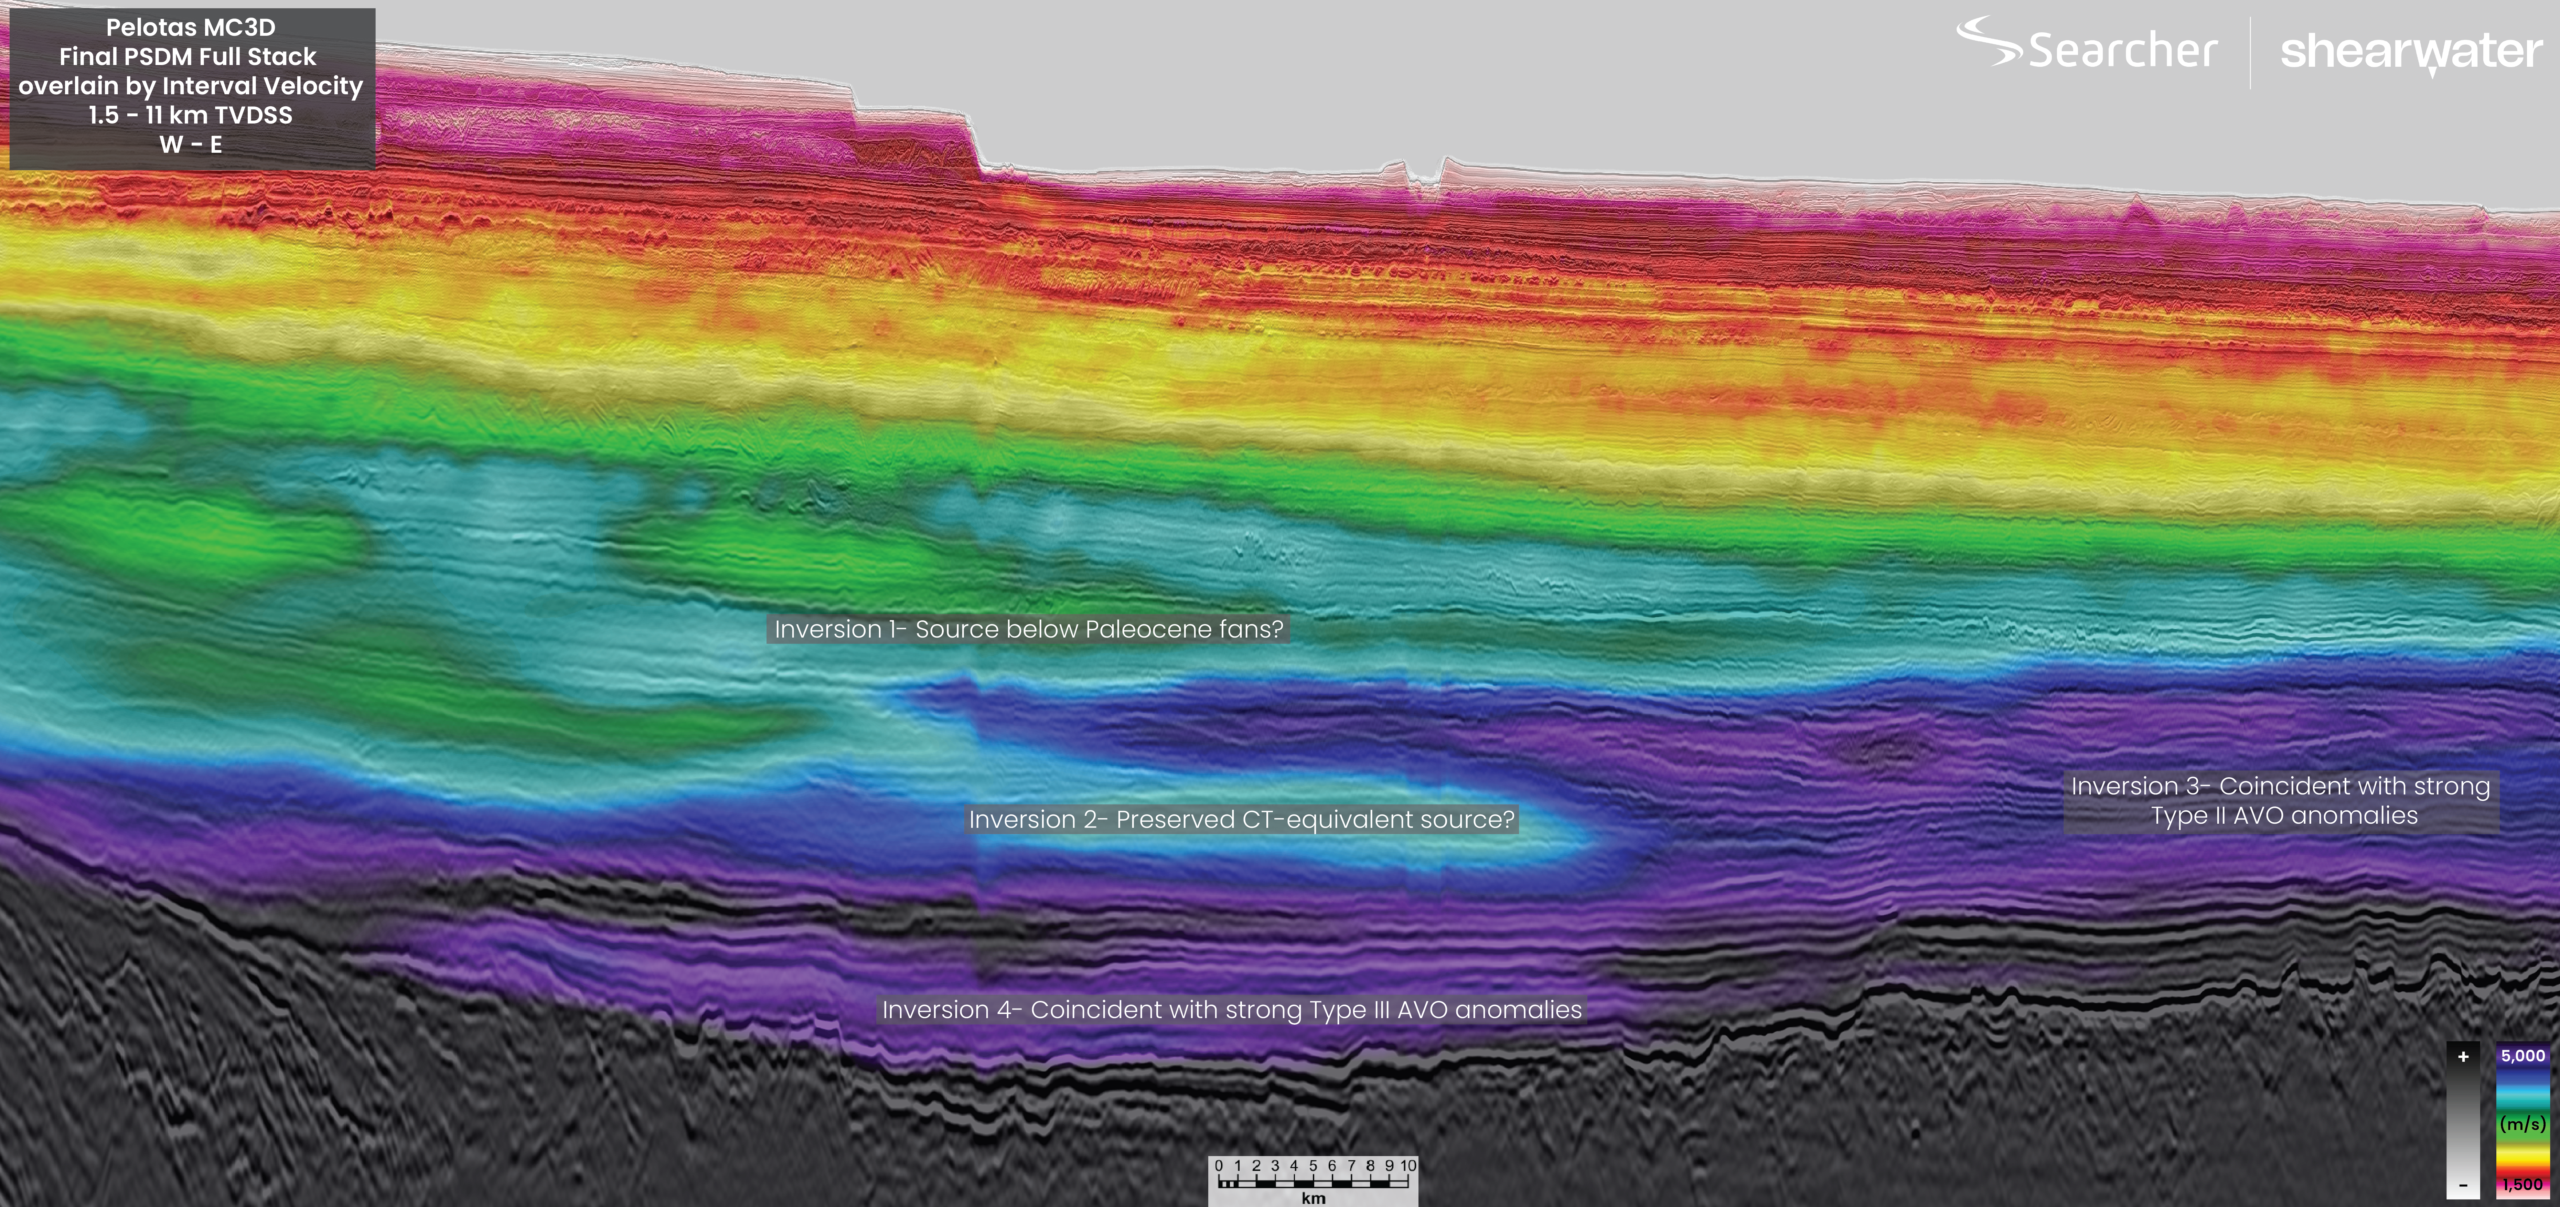
Hunting for Cenomanian-Turonian source rocks in the South Atlantic
Source hunting with 3d seismic in the Pelotas Basin
When the signal goes missing
CT source rock seismic buster
The velocity of adaptation: Rethinking source rock detection
Final call
Related Articles