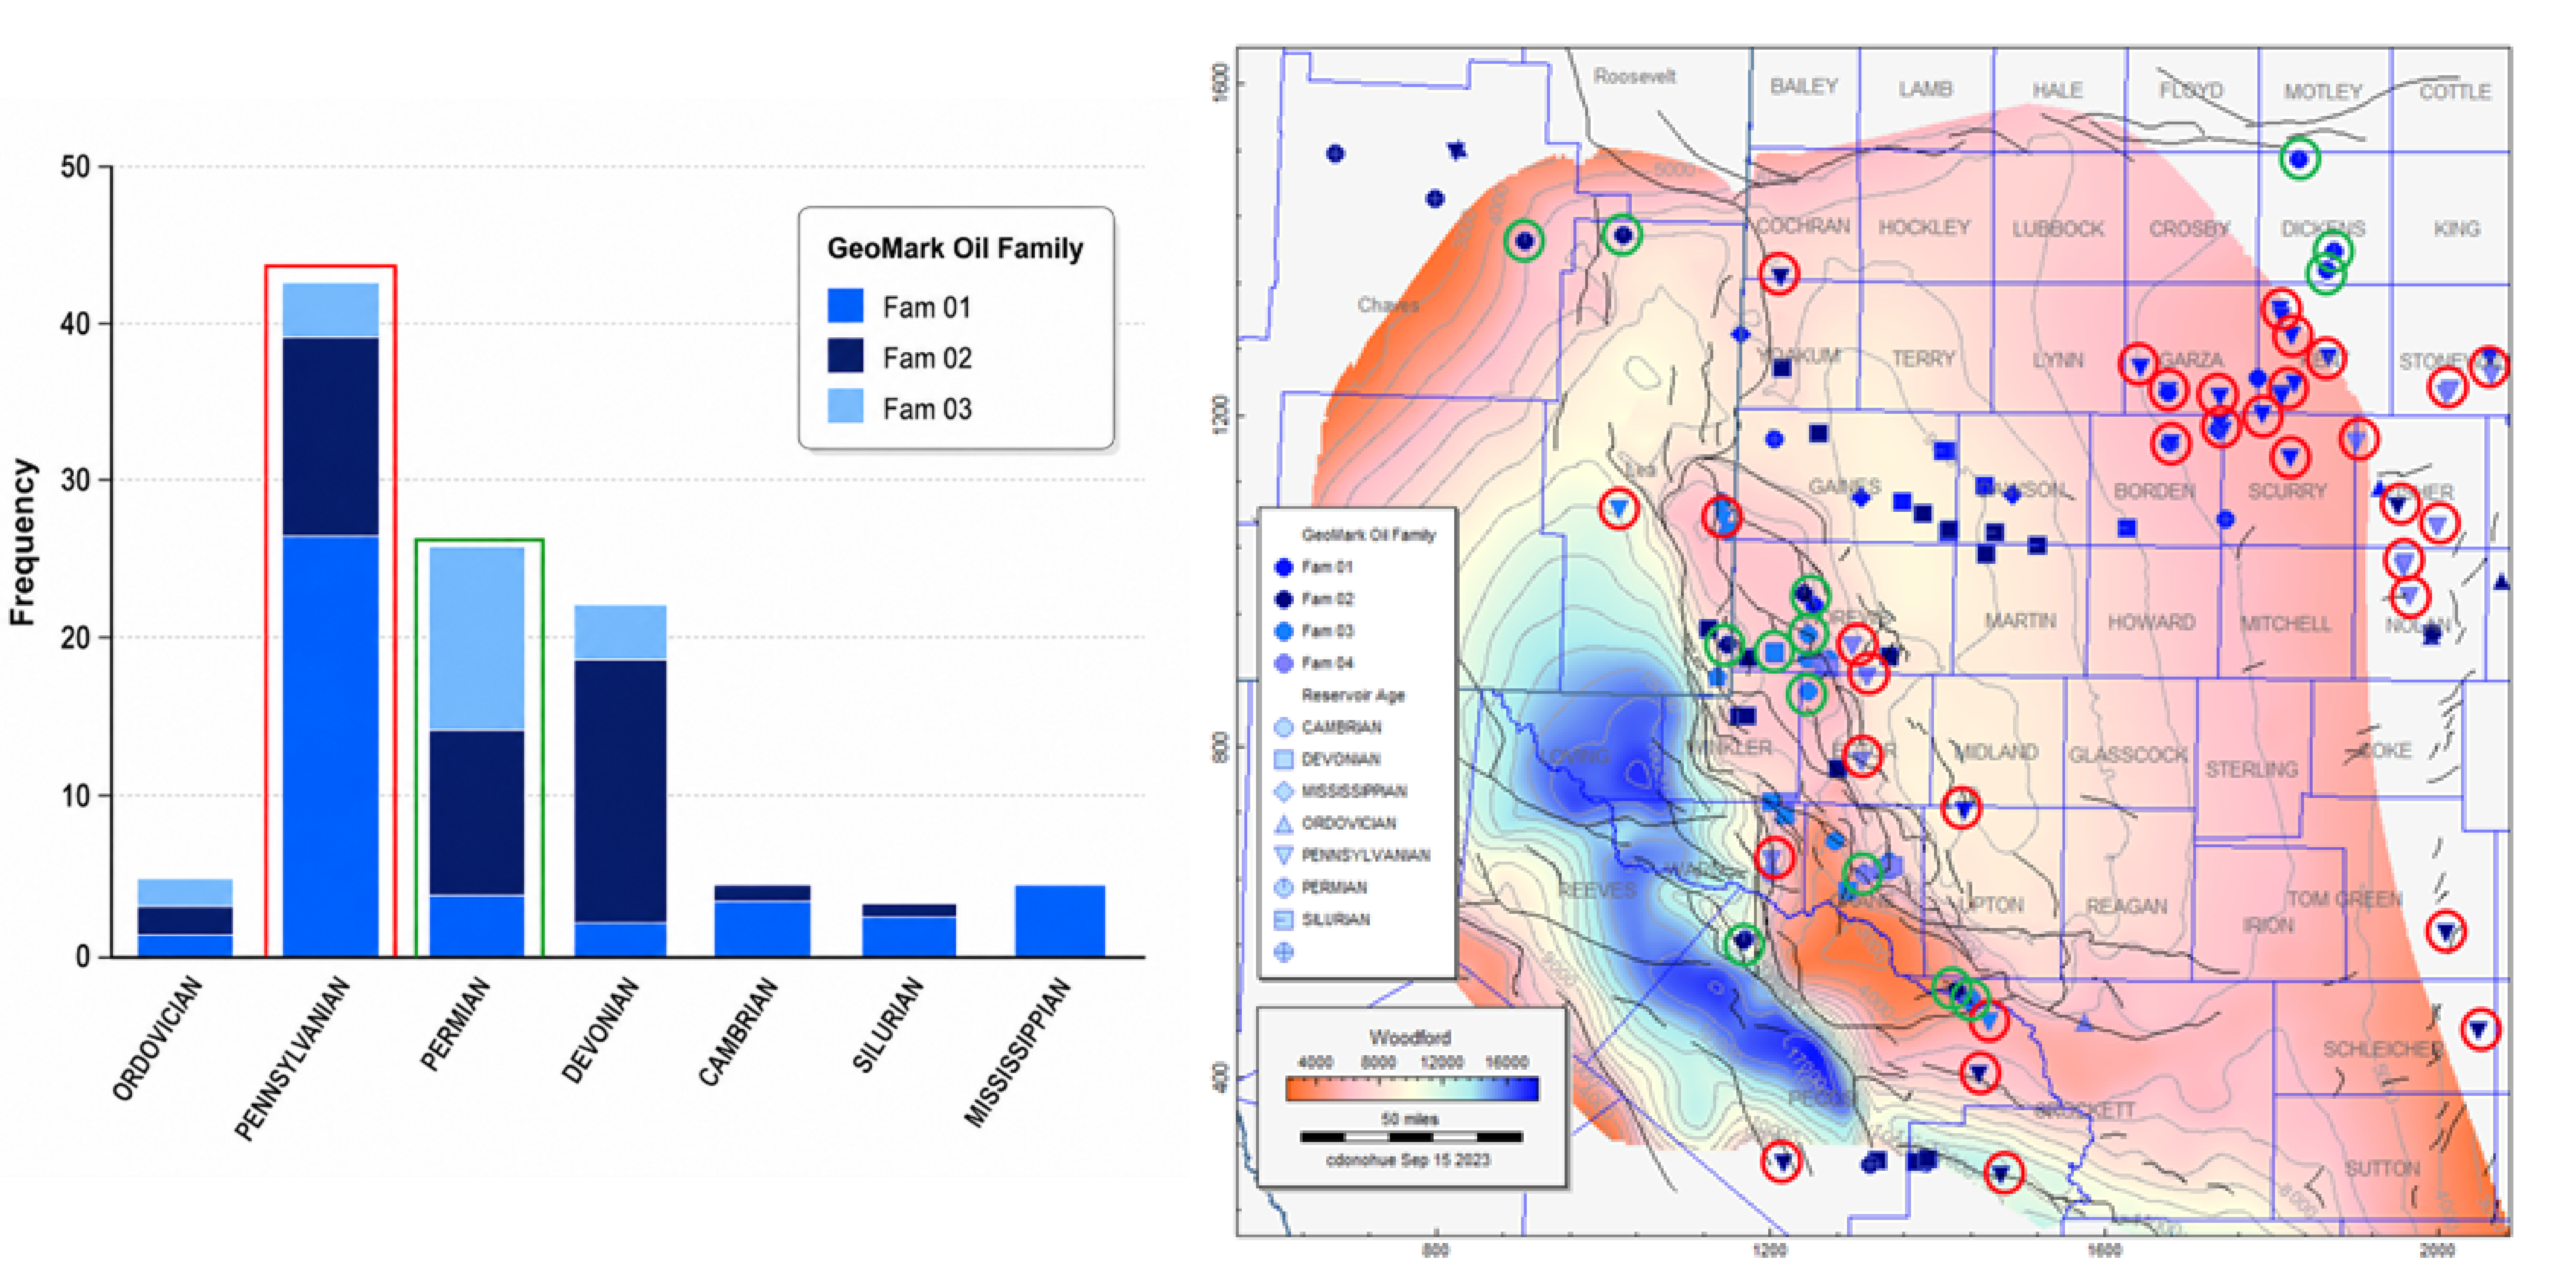
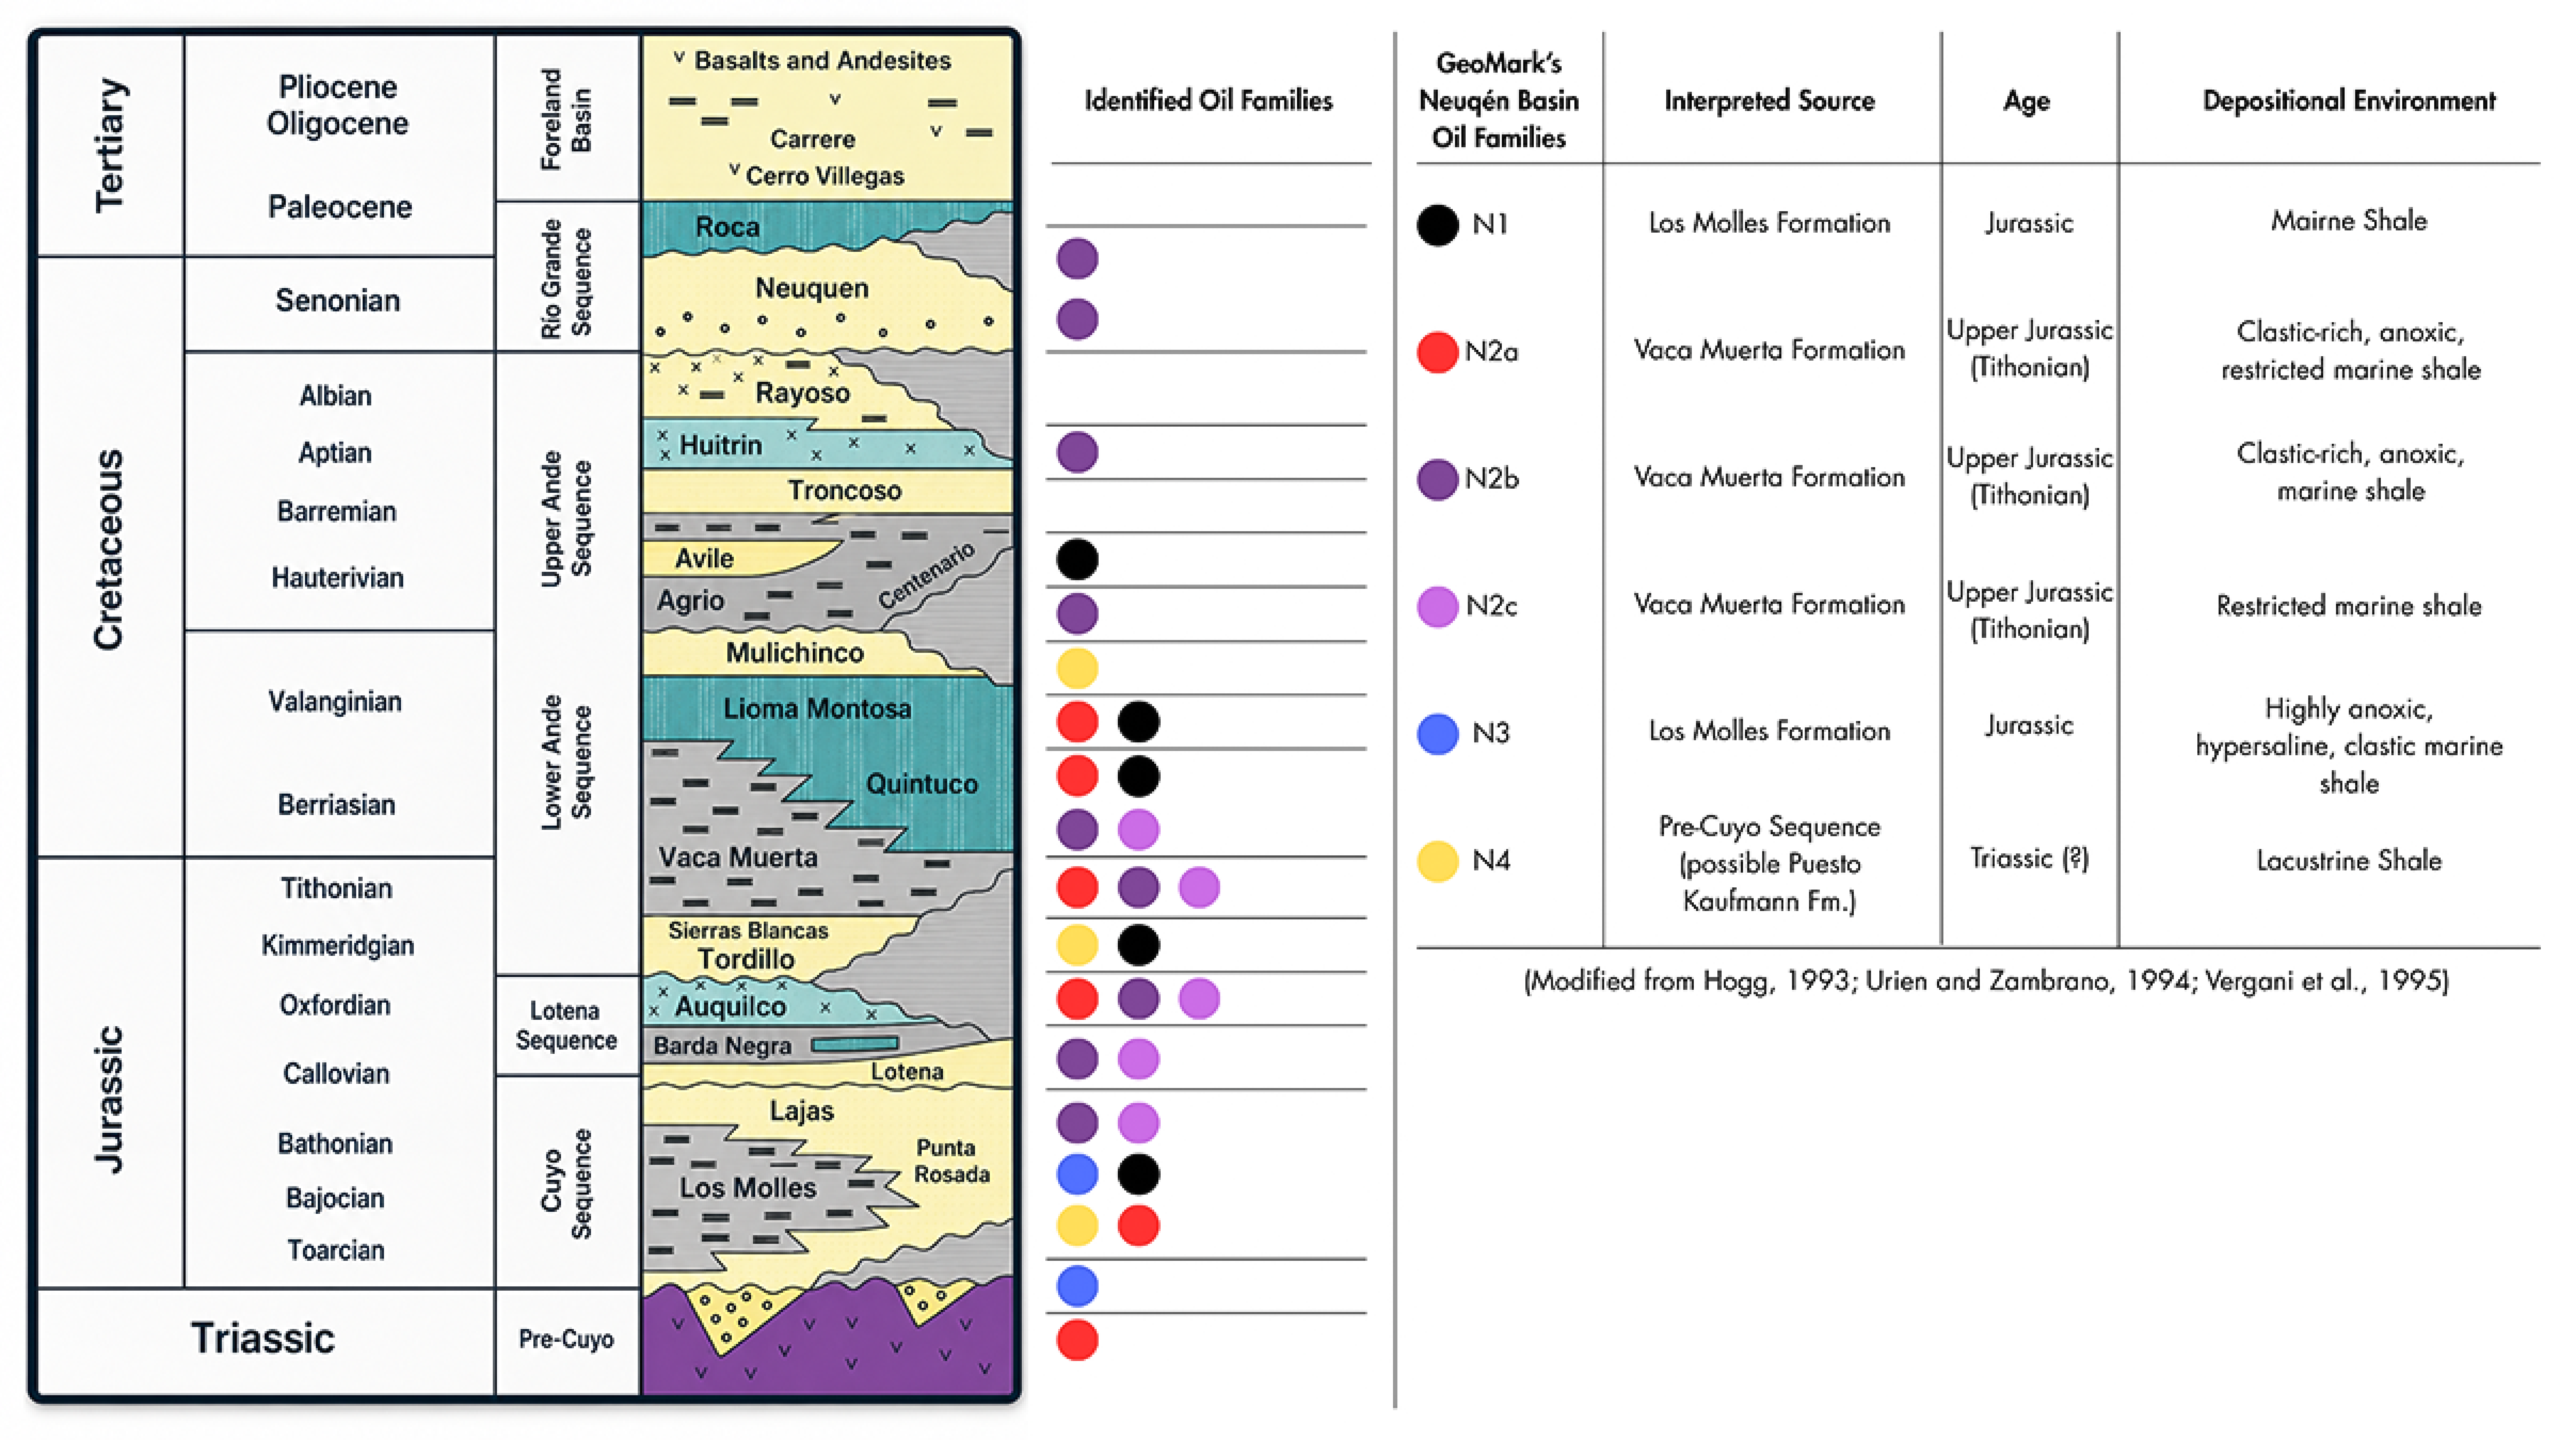
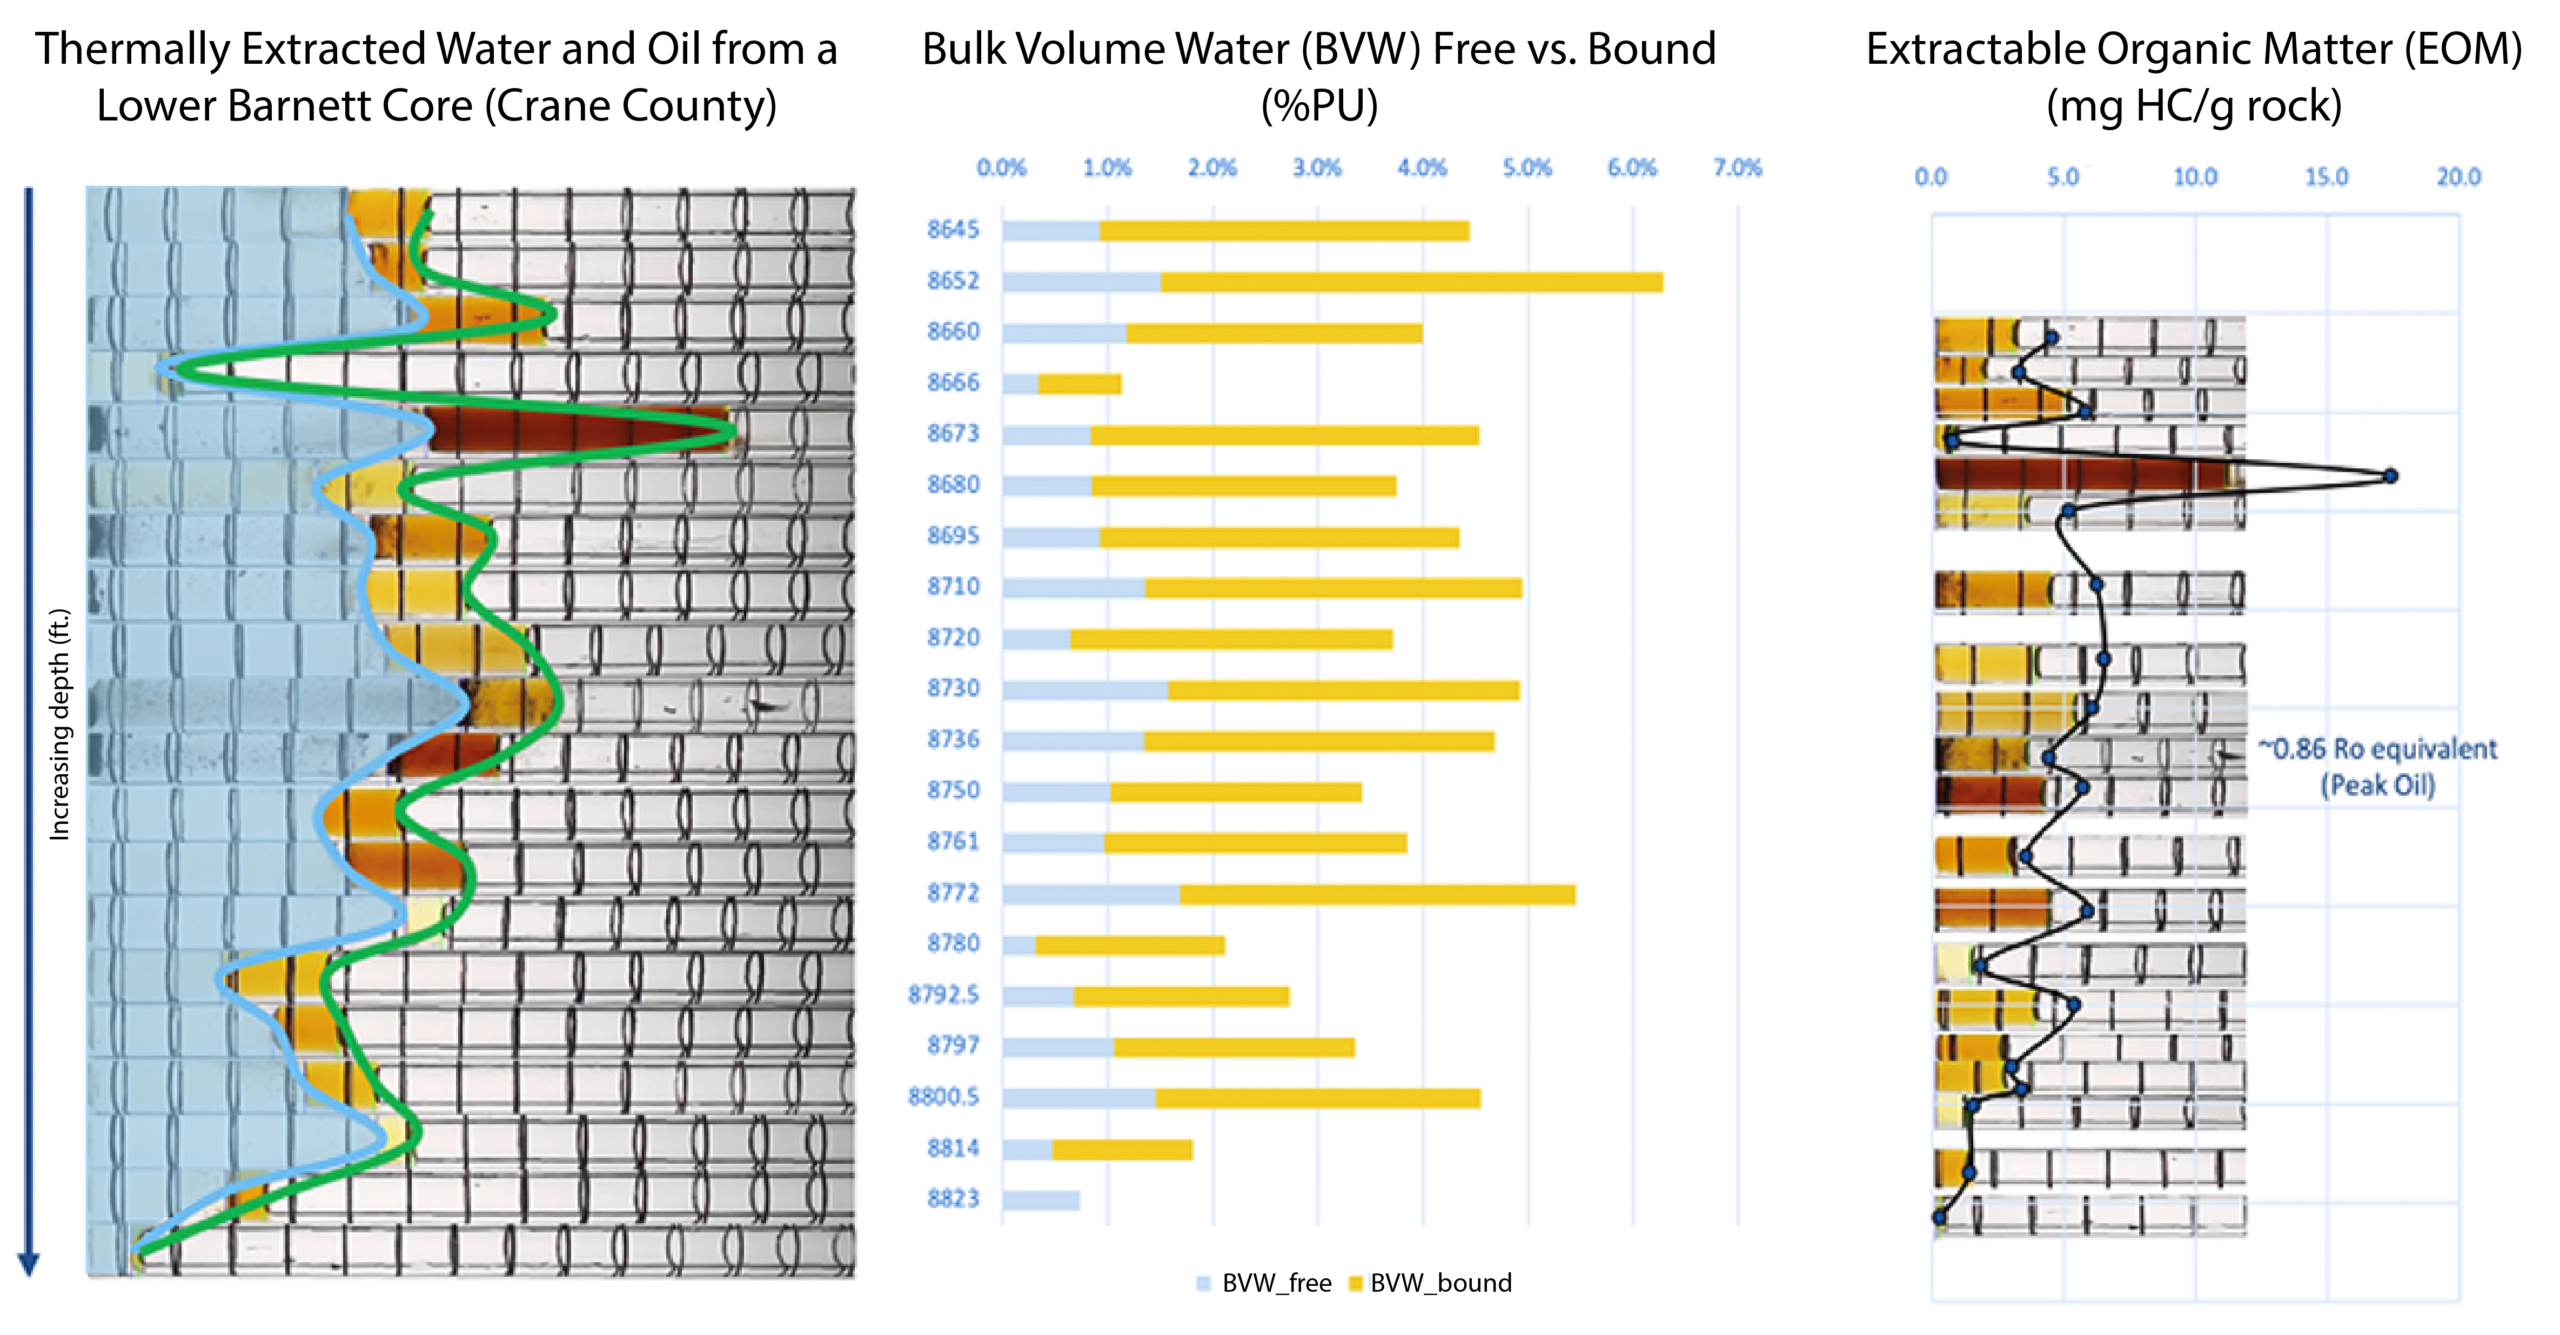
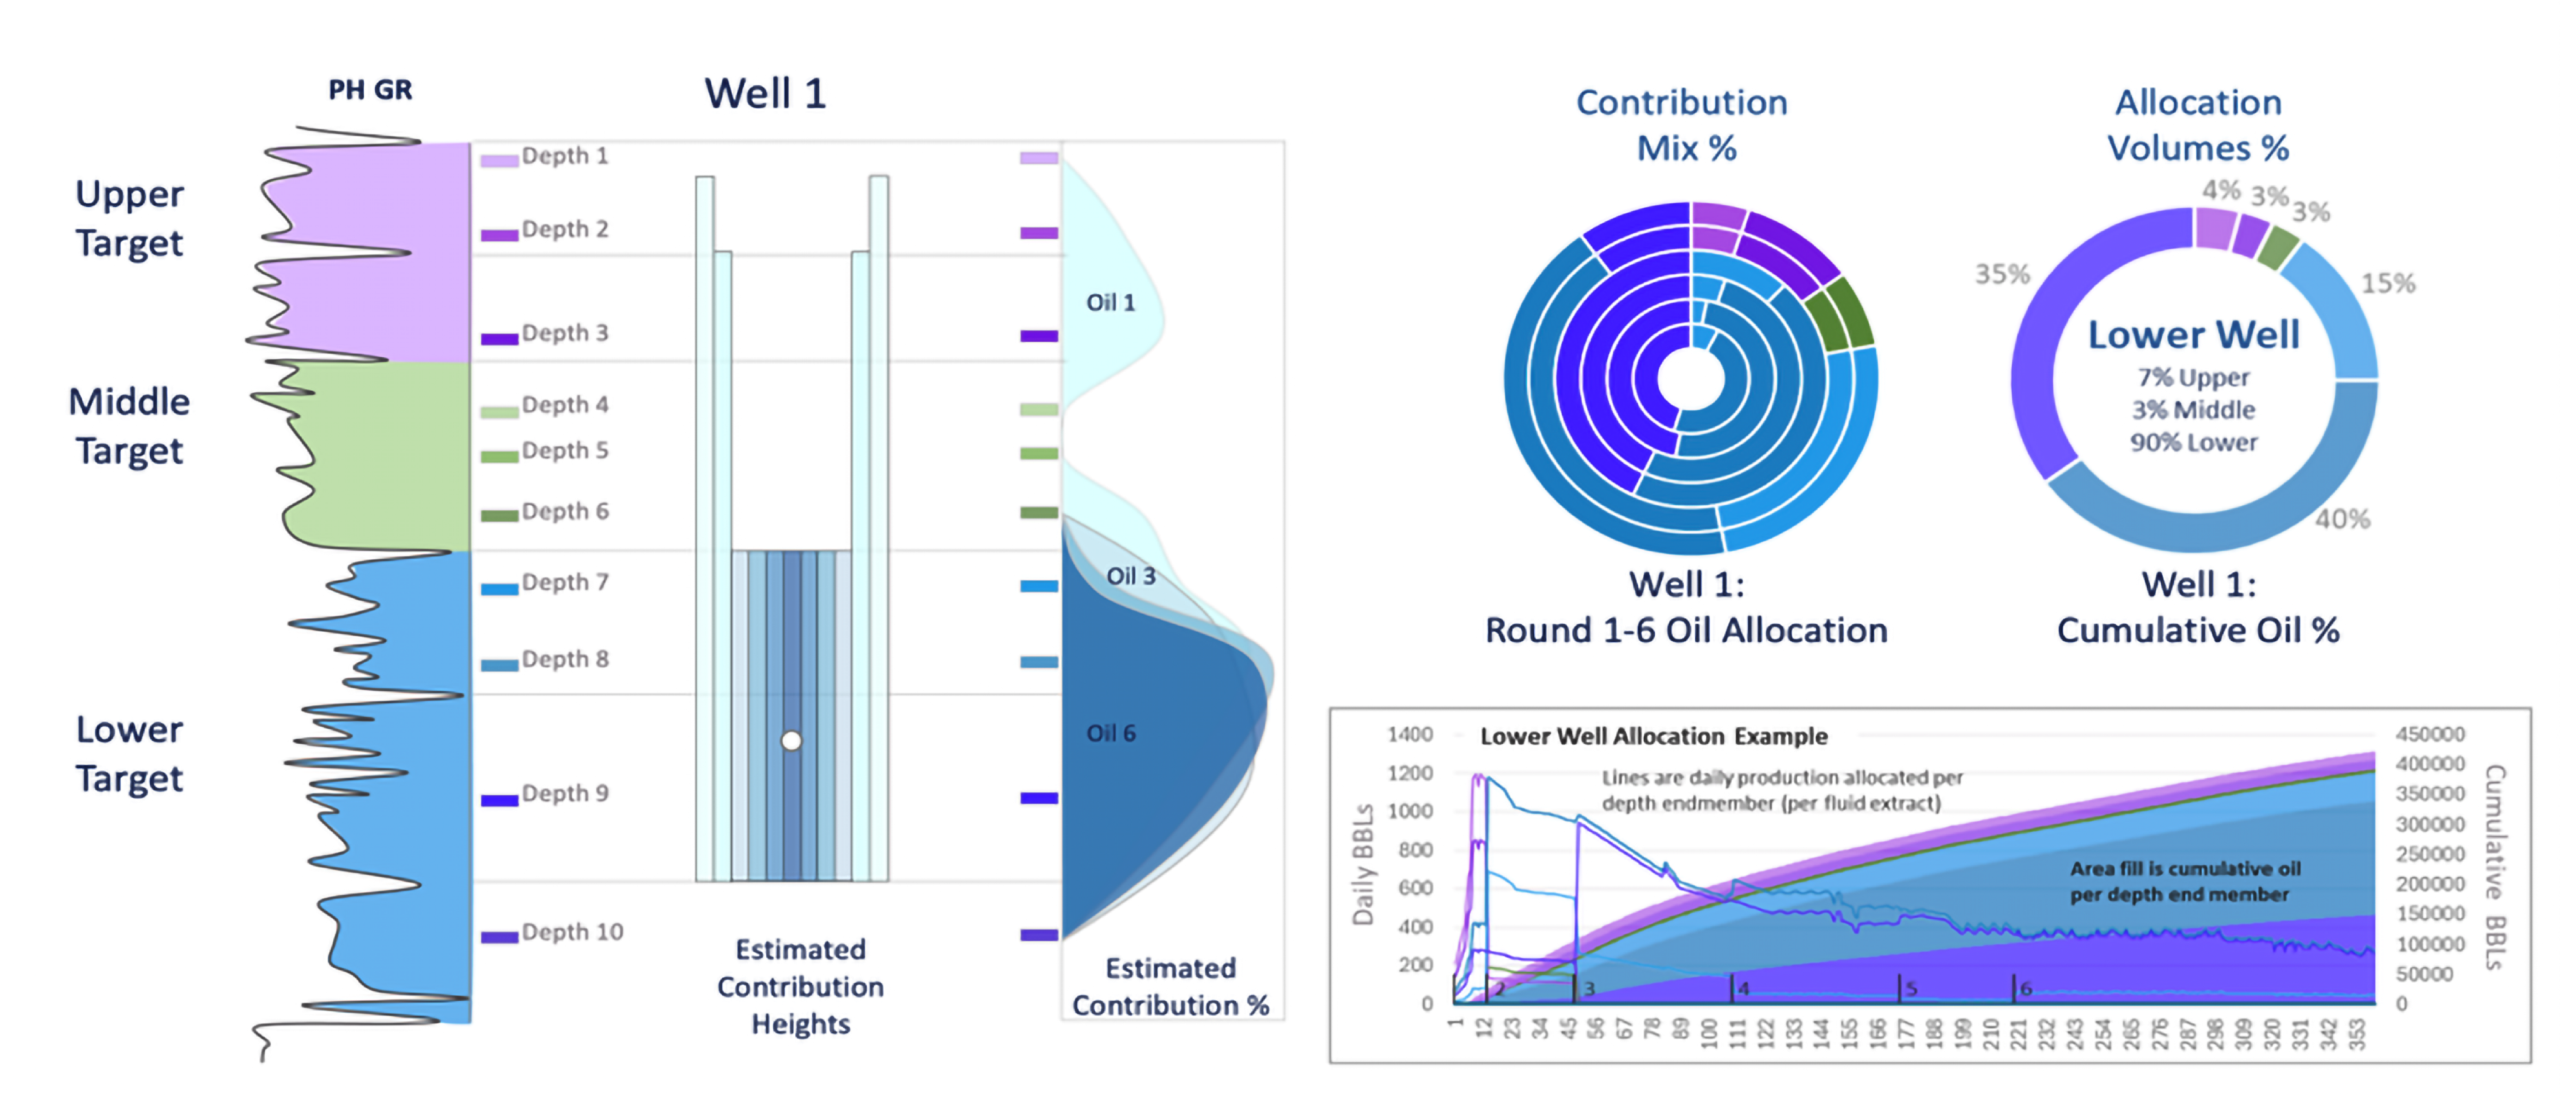
Eighteen years of source-rock, fluid and produced-water analysis across the US resource plays has produced a workable sequence of questions. Most of those questions can be asked of Vaca Muerta, the Beetaloo or the Dadas today – but only some of the answers translate The textbook example is the Permian Basin. The Woodford (Late Devonian) and the Barnett (Mississippian) are two of many principal sources, but the oils they generated do not always stay near the source. Mature Woodford- and Barnett-sourced oils are routinely identified in Pennsylvanian reservoirs along the basin margins, sometimes many miles vertically and laterally away from the kitchens that charged them (Figure 1). We refer to the outer envelope of these migrated, basin-margin fluids as the “halo”, and the halo is not the edge of prospectivity – it is part of it. What that implies for a basin where the maturity model is still being built is that the question to ask is not only “where is the source rock cooking?” but “where did the fluids it generated end up?” Vaca Muerta is the clearest near-term test case. The Tithonian-Berriasian Vaca Muerta Formation is itself the producing interval across most of the play, but in the southern and southwestern parts of the basin the formation grades into less mature areas, and migrated fluids in the overlying Quintuco and the younger Mulichinco- Agrio section are reasonably well documented in the literature. Figure 2 highlights the distribution of Vaca Muerta produced oils in younger reservoirs based on a previous GeoMark oil study of the Neuquén Basin. A halo framework imported from the Permian doesn’t tell an operator where those secondary accumulations sit – basin geometry is too different – but it gives them a structured way to ask the question, and a comparable dataset of source-correlated oils to test against. The single hardest lesson of the early North American shale boom was that volumes in place and volumes that come out of the well are not the same number. Laterals were producing ten barrels of water for every barrel of oil against petrophysical models that predicted nothing of the sort, and the industry’s response, over roughly a decade, was a full rebuild of tight-rock petrophysics. The piece that took longest to settle was the partitioning of pore fluid. In a conventional reservoir, total porosity and water saturation will get you most of the way to a usable inflow estimate. In tight rock, they will not, because a meaningful fraction of the fluid in the rock is bound – capillary-held in the smallest pores, or sorbed onto kerogen surfaces – and it does not move under production drawdown. The relevant quantity is the mobile fluid, not the fluid that is present. Our TruSat workflow was built specifically around this distinction. It quantifies bulk-volume fluid fractions of water and oil in tight rock and separates each into free and bound components, so a single sample delivers TOC, total porosity, water and oil saturation, programmed pyrolysis, and the geochemical characterization of the extracted fluids in one pass (Figure 3). The collection efficiency matters: In our lab, closed-retort collection routinely exceeds 98 %, against roughly 60 % that traditional conventional core-saturation methods return on the same kind of rock. That is not an incremental difference – it changes which fraction of the fluid you are characterizing. What translates to a new basin is the question itself – how much of what is in the rock is actually mobile – because it is universal to tight reservoirs. What does not translate is the calibration. Vaca Muerta’s carbonate-rich facies and the Beetaloo’s Velkerri shales do not behave like the Wolfcamp at the level of bound-fluid response, and an operator in either basin still needs their own core program before mobility estimates can be defended in front of a development decision. If exploration asks whether the hydrocarbon exists, and appraisal asks whether it is producible, development asks which barrel comes from where. Production allocation – geochemical fingerprinting of produced fluids and attribution to specific intervals or wells – is the tool we now use most heavily in North American development programs, and it is the part of the playbook that has the lowest barrier to transferring abroad. The case we return to most often is from the Eagle Ford. An Eagle Ford operator, who held 130,000 net acres in the Karnes trough, was landing in the Lower Eagle Ford on the working assumption that stimulation would also reach the Upper Eagle Ford. The first two produced-fluid samples from a Lower Eagle Ford Lateral well confirmed both end-member signatures – Upper and Lower – and on that basis the assumption looked defensible. By the third sample, taken roughly sixty days later, the Upper Eagle Ford signature had disappeared from the produced fluid. The interval had been stimulated but was no longer in fluid communication with the wellbore. That is a quantitative basis on which to revisit completion design, landing depth, and the case for a dedicated Upper Eagle Ford development – none of which would have been visible from microseismic or pressure data alone. Used at monthly cadence, allocation answers four operating questions: Which formation each barrel comes from; how finely targets can be differentiated in migrated systems; whether decline reflects Stimulated Rock Volume (SRV) drainage or another mechanical control; and whether stacked laterals share fluid or merely share pressure. In cube and staggered developments, that distinction routinely changes spacing decisions on the next pad. For an operator in Vaca Muerta – where the Vaca Muerta itself and the overlying Cretaceous reservoirs may both contribute to a producing well – or in the Beetaloo, where Velkerri sub-units sit in close stratigraphic proximity, the same workflow is directly usable, provided the baseline geochemical characterization has been done. That is the practical prerequisite. Without source-correlated end-member signatures for every interval in pressure communication with the wellbore, allocation has nothing to attribute against. The North American playbook is, in the end, a sequence of questions and a set of measurements built to answer them. The questions – where the fluids went, how much of what’s in the rock is producible, which interval is each barrel coming from – transfer cleanly. The measurements transfer too: The laboratory protocols, the geochemical end-member work, the closed retort fluid partitioning, the time-lapse sampling design. What does not transfer, and what we have been clear with operators about, is the answers. Vaca Muerta is not the Wolfcamp. The Dadas is not the Eagle Ford. The maturity windows, the migration pathways, the calibration constants for bound-fluid response, and the produced-fluid signatures are all basin-specific, and each one requires its own sample program before the workflow returns a number an operator can act on. The honest version of what eighteen years in North America buys for the next set of basins is this: Not faster answers, but better-framed questions – and a measurement toolkit already debugged against the hardest cases.
Halo oils, tight-rock saturation, and production allocation: What the North American playbook can and can’t tell the next set of unconventional basins
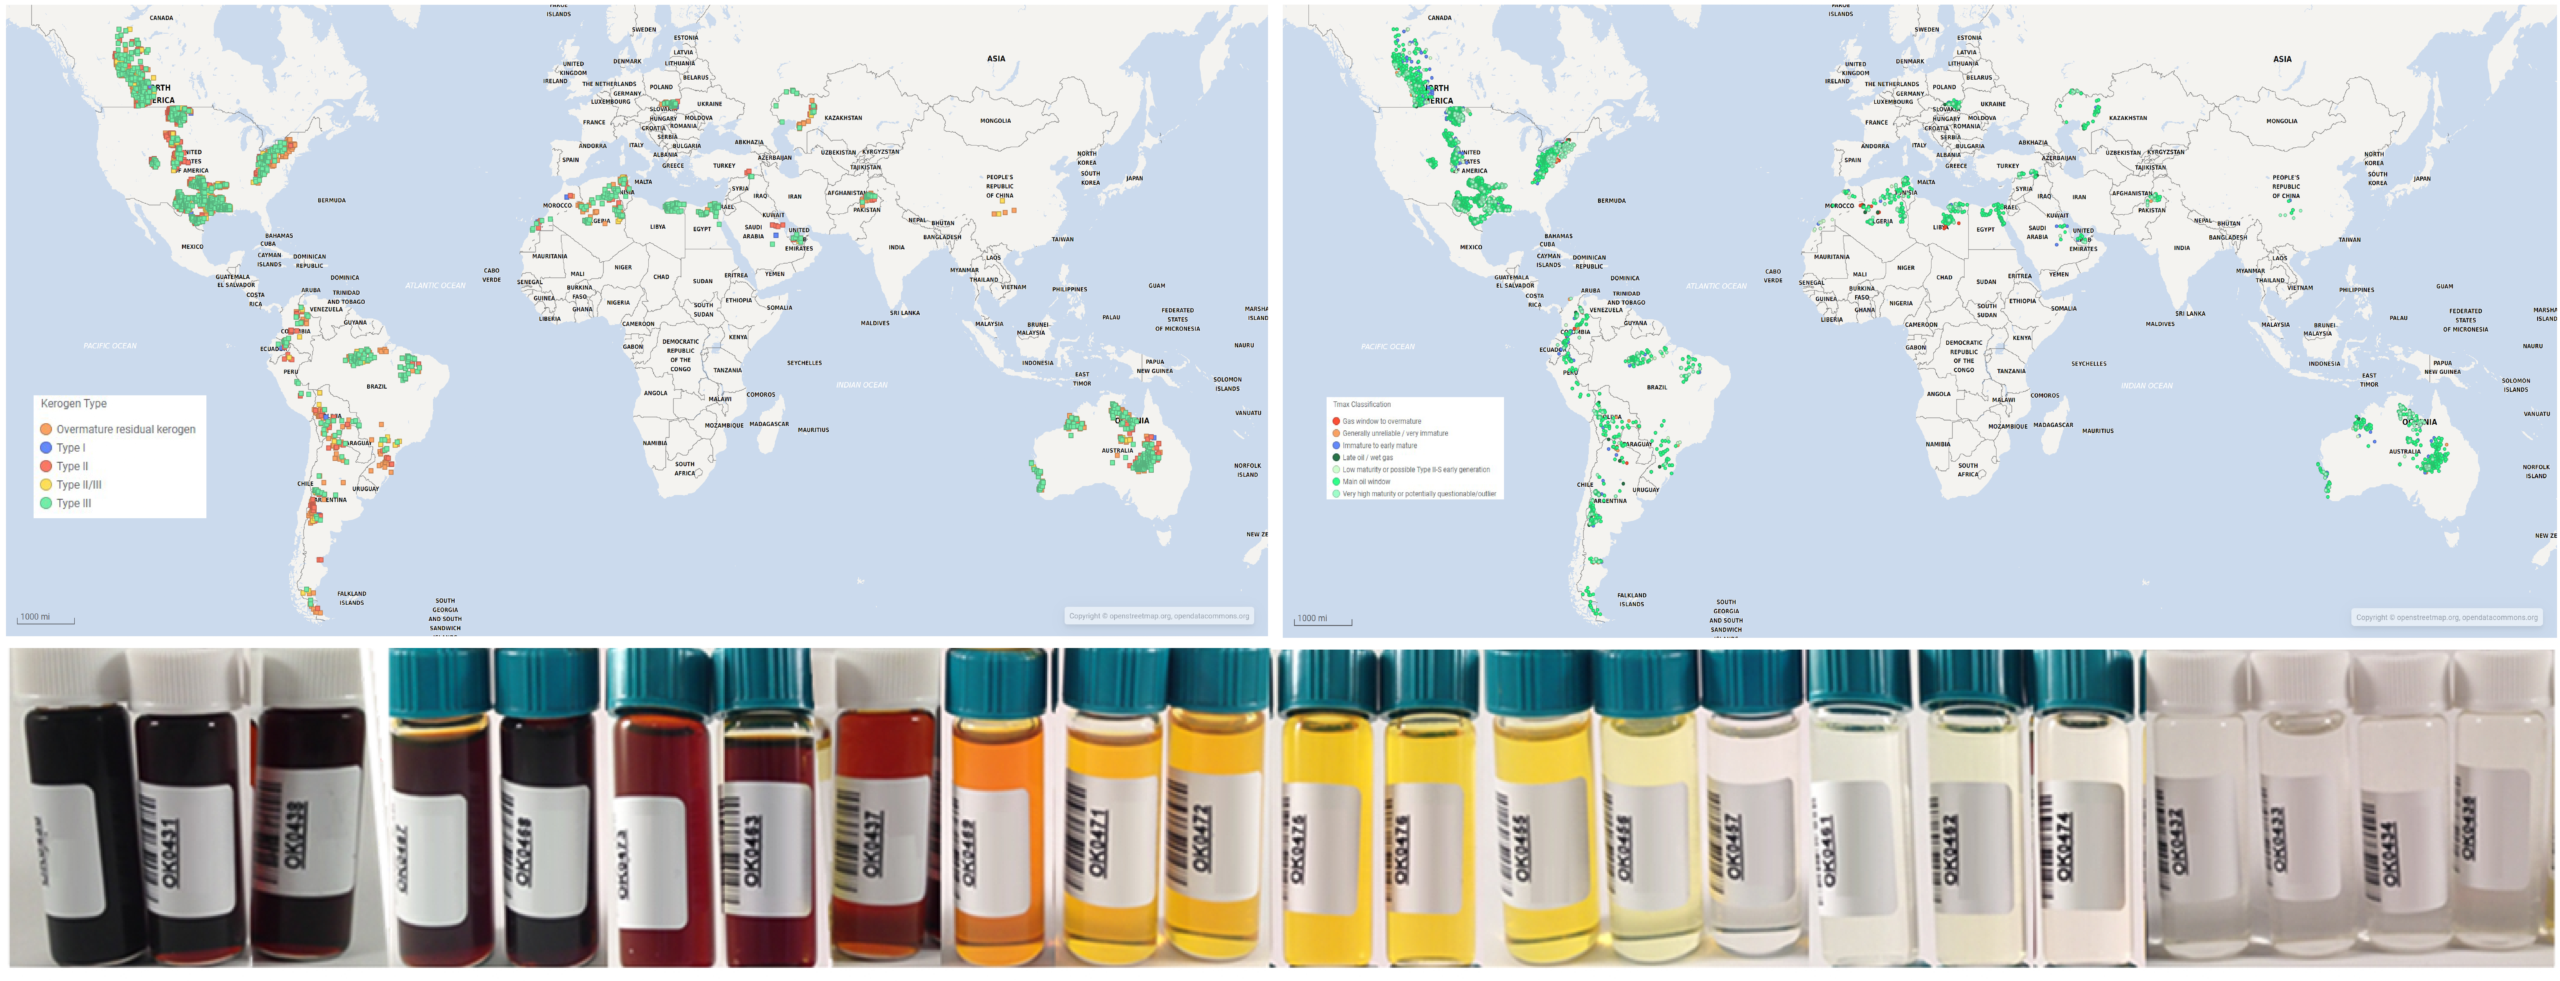 Left: Global distribution of kerogen types across key unconventional and resource play basins, generated from a selection of source rock data contained within GeoMark’s RFDbase™. The map highlights regional variations in kerogen type and corresponding depositional environments, providing insight into expected hydrocarbon generation behavior and the kinetics models most appropriate for petroleum systems evaluation and resource play characterization. Right: Global distribution of source rock Tmax values across key unconventional and resource play basins, generated from a selection of source rock data contained within GeoMark’s RFDbase™. The map highlights regional variations in thermal maturity, providing insight into hydrocarbon generation stage, expected fluid phase distribution, and the relative positioning of source rocks within the oil and gas windows. These maturity trends help support basin screening, petroleum systems evaluation, and the identification of regions prospective for liquids-rich versus dry gas resource development. Bottom: Same source rock, same basin, different oils. An example of Woodford oils from the Anadarko Basin, Oklahoma USA.
Halo oils and the limits of the source-rock map
Free, bound, and what moves
Time-lapse allocation in the development phase
What carries over, and what doesn’t
Related Articles