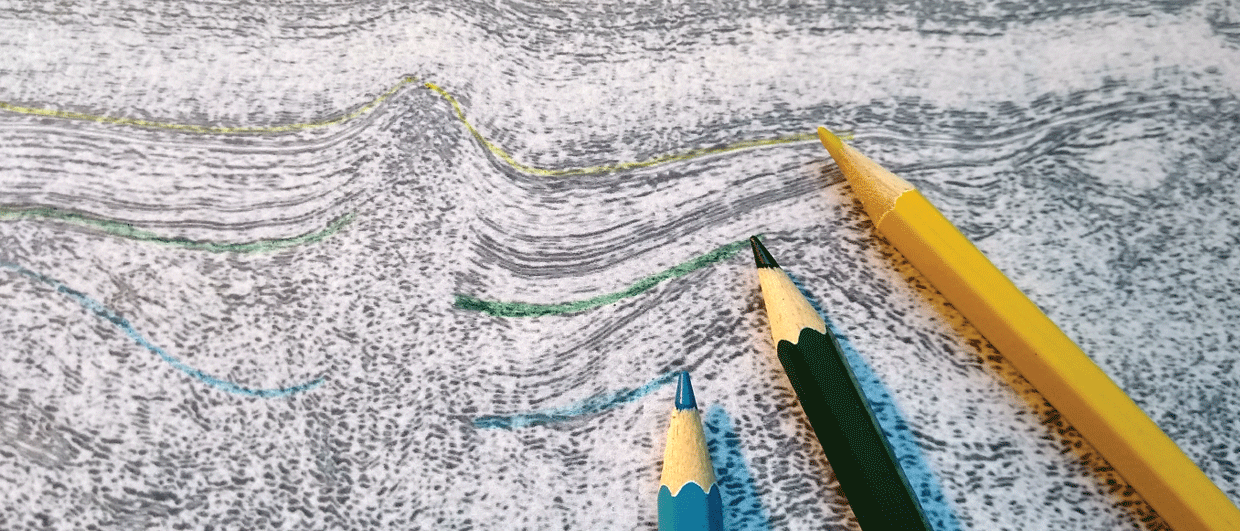
Mass transport complexes and prograding deltas in the Dutch offshore. Source seismic line: TNO - Geological Survey of the Netherlands.
Seismic reflections – lithological boundaries or timelines?
Professor Heather Bedle explains why it can be both

In basic terms, acoustic impedance is a measure of how resistant a material is to sound waves passing through it. When that resistance changes across a lithological boundary, some of the seismic energy bounces back, creating a reflection. Because different rock types and sediments have different densities and velocities, it makes sense to assume that seismic reflections will highlight the boundaries between different rock types.
However, as this may be the case in some subsurface settings, for example, when we observe a mudstone draping a carbonate platform, it certainly does not always apply. As Professor Heather Bedle explains in her Seismic Fundamental Course that is available through the SAGA Wisdom Platform, “in deltaic settings we tend to see reflections that actually cross-cut large-scale lithological boundaries.”
In most delta systems, as you move from the proximal to the distal domain, you often see a change from a relatively high net-to-gross ratio to a low net-to-gross ratio. You would expect seismic reflections to roughly follow this boundary, since the rock types on either side are quite different. These boundaries can be seen in the three coloured zones in the illustration below.
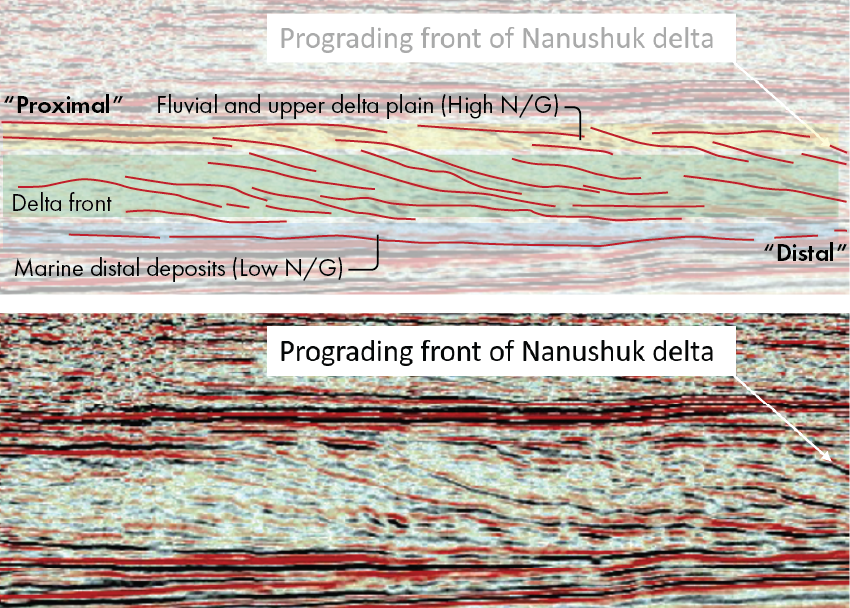
However, the seismic reflections (red lines) are basically cross-cutting these regional lithological boundaries, seemingly unaffected by this change in lithological composition. How do we explain this?
“What we are in fact looking at in the seismic are timelines,” says Heather. “One of the things we have to think about is that deposition of these sediments is happening over long periods of time, with periods of non-deposition in between. In turn, these periods of non-deposition allow for a degree of compaction. It is this compaction effect that forms the basis for the strong acoustic impedance response that can be seen across the entire seismic line.”
“If we look carefully, we can still get some hints in our seismic data of changes in lithology,” continues Heather during her course. “As you move from sand on sand (low amplitude), to shale on sand (high amplitude), to shale on shale (low amplitude). But even when it is the same lithology on top of the other, there is still an amplitude to be seen, due to the process described above.” So, always remember that in subsurface environments, a strong seismic reflection does not automatically mean you are looking at a boundary between two different rock types. You may instead be looking at a time surface…
This is the first in a series of articles dedicated to course content available on the SAGA Wisdom Platform.