Rio de Janeiro, Brazil. Photo: f11photo via Adobe Stock.
Long-distance up-flank oil migration offshore Brazil
3D basin modelling incorporating pre-salt geochemical data reveals new exploration areas in Santos and Campos Basins
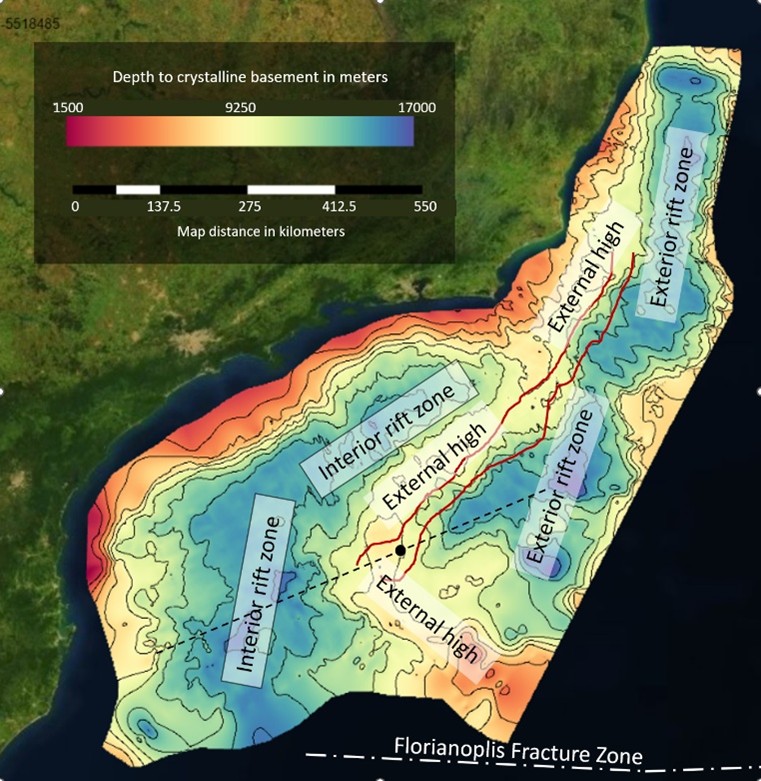
This article discusses the results of a four-year 3D Earth modelling project that included detailed seismic mapping of 17 surfaces between the seafloor and the top of the Moho, using a detailed grid of both 2D and 3D seismic data from TGS covering 592,000 km2 across the combined areas of the Santos, Campos, and Espirito Santo salt basins. The TGS dataset includes ION data recorded to a depth of 40 km and allows detailed mapping of the Moho and constrains the depth to the top of crystalline basement, which can be validated by other seismic profiles. Geopost Energy Brazil, a division of Katalyst Data Management, provided hundreds of well data wireline logs and mud logs. ANP provided geochemical data for 84 pre-salt wells covering all three basins. The ANP dataset also included paleontological reports that helped estimate paleo-water depths for each chronostratigraphic unit in each well.
Assembling the data for basin modelling
We corrected bottom-hole temperatures (BHTs) and uploaded them to the ExCaliber Earth modelling software from Xplorlab. Detailed lithological content was extracted from the mudlogs by calculating the percentages of clay found in shale, sandstone, and marl for each chronostratigraphic unit per well. Similarly, the percentages of quartz were calculated in shale and sandstone. In addition, the percentages of carbonate, organic matter, evaporite, and volcanic rocks present in each chronostratigraphic unit were calculated. These ANP wells were reasonably distributed throughout the study area, except in southern Santos, which has become an area of intense exploration interest due to bp’s big discovery in the Bumerangue block, announced last August. Seven more wells in southern Santos were added to the project for heat flow and lithological data, even though they did not have geochemical data. We also compiled data in the form of organic carbon and pyrolysis data, including the hydrogen index (HI) and Tmax. All of these accumulated and derived lithologic data were gridded on a per chronostratigraphic-unit basis and then uploaded into ExCaliber, where values of radiogenic heat production (RHP) were inverted for 91 well locations. Crustal RHP and thickness are important in understanding and predicting variations in the thermal profile across the two rift zones, given their large sediment thicknesses. The resulting 91 1D basin models, along with derived RHP values at each well, were then uploaded into ExCaliber for 3D basin modelling.
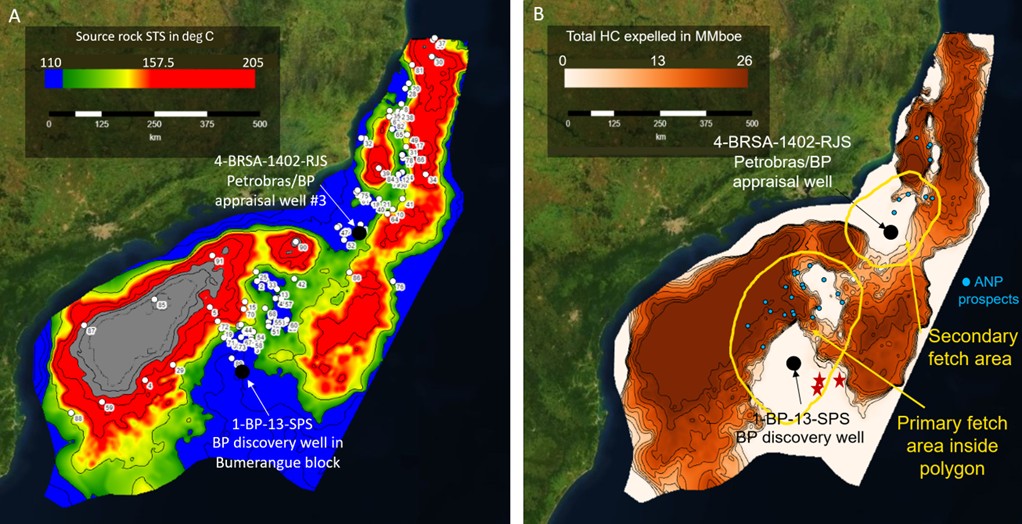
Output included predictions for three different source rock intervals: The Barremian (which often contains interbedded volcanic units), the Aptian pre-salt (Organofacies C associated with lacustrine facies), and the Albian post-salt (Organofacies A or B associated with marine carbonate or shale facies). Standard thermal stress (STS) maps were generated for all three source rock interval mid-points. The most important of these is the pre-salt Aptian source rock map. The combined Aptian and Barremian oil and gas production, loosely termed “pre-salt”, currently supplies about 80 % of Brazil’s total oil and gas production per ANP. Based on our work with well data, a rough estimate for the Aptian contribution to this pre-salt total production would be 85 – 90 % at the present time.
In terms of exploration implications, the UEP map shows potential for oil discoveries in the southeastern extension of the External High in southern Santos, and along the Cabo Frio High in southern Campos. The large exploration block east of Bumerangue belongs to Equinor, which recently applied for three drilling permits. bp will drill an exploration well in the Tupinambá block (adjoining Bumerangue to the west) during 2026 and then drill the first field development well in Bumerangue before the end of 2026, per bp’s VP of Exploration, Bryan Ritchie.
Next step: Quantify source potential and secondary migration
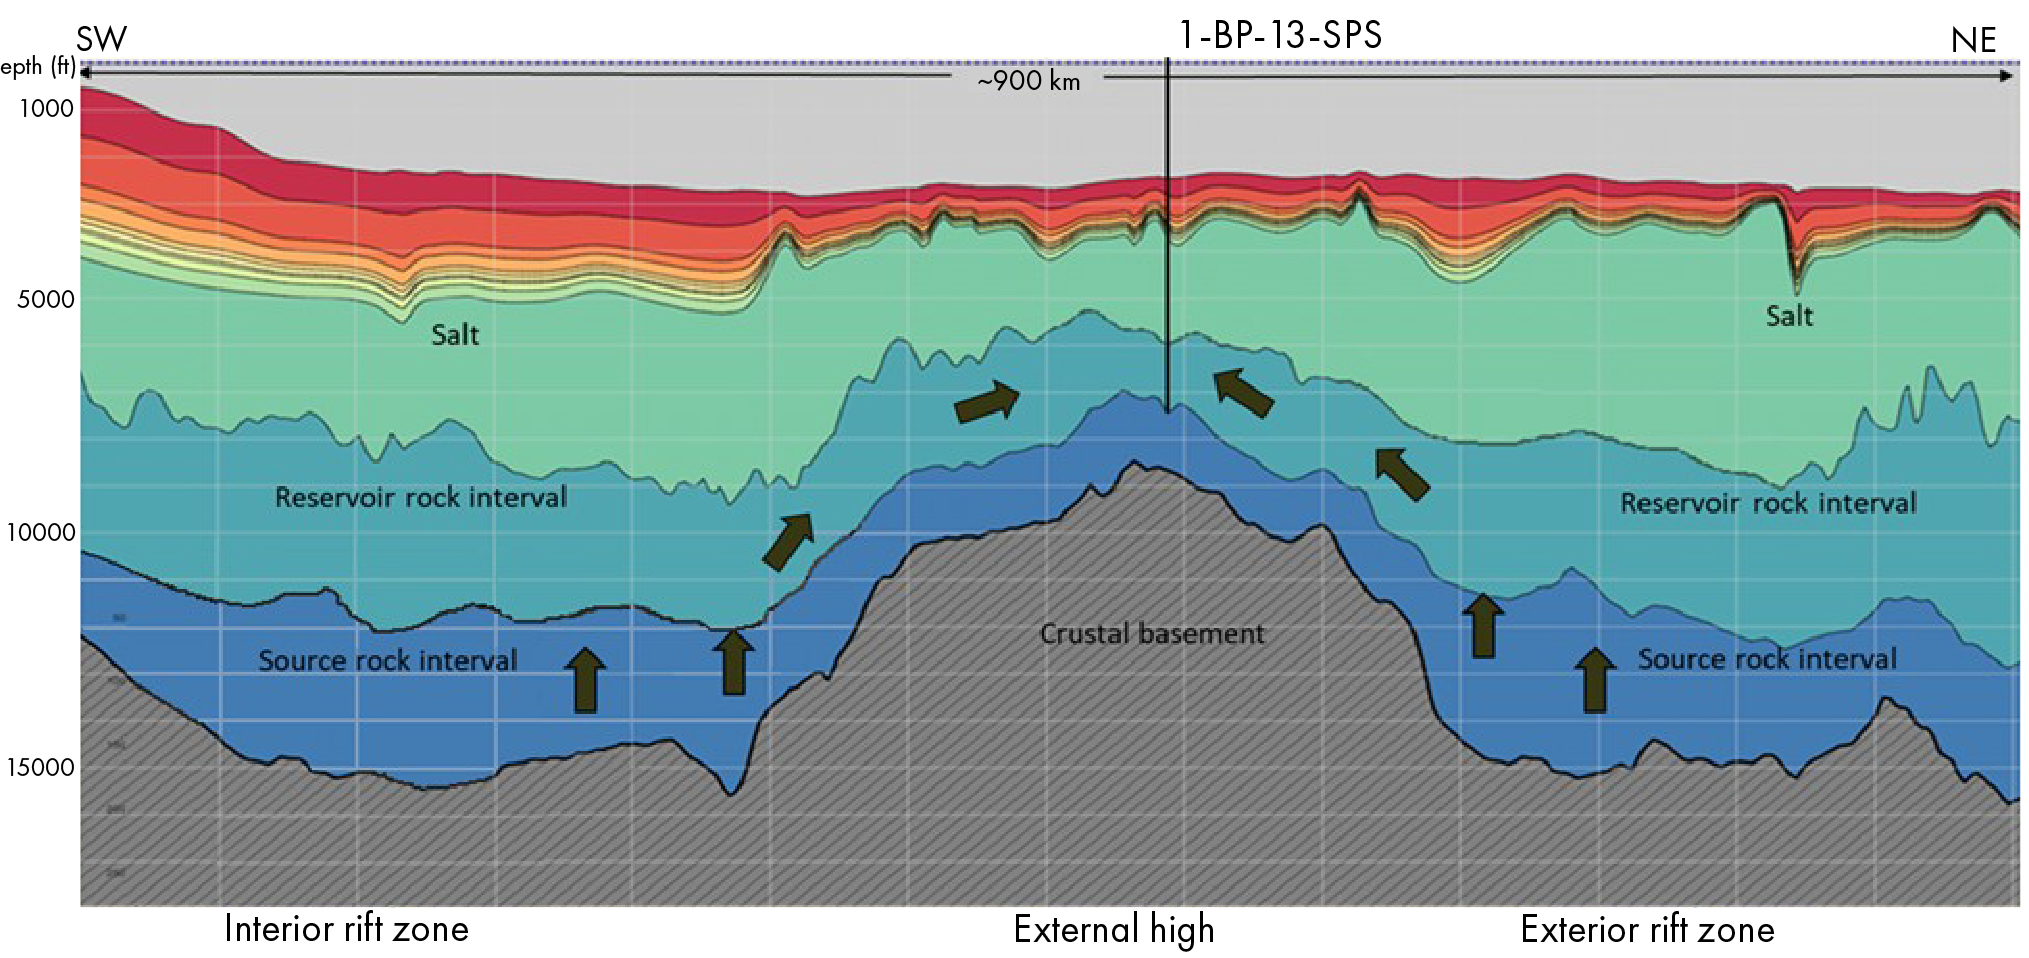
The most significant outcome of this 3D basin modelling is that not all oil found on the External High was locally expelled: there is significant migration up the flanks of the External High from the adjacent Interior and Exterior rift zones, now confirmed by geochemical basin modelling.
Our ongoing work is to quantify lateral variation in source Ultimate Expellable Potential (UEP) within an evolving Cretaceous-Cenozoic paleogeographic context. These paleo UEP estimates will allow us to quantitively address charge flux and migration losses to define effective lateral migration pathways to drilled and undrilled prospects.