Even modest amounts of total organic content can significantly change the physical properties of shales, providing clues for source detection on seismic data. This article discusses how seismic analysis can be used to identify source rock, using examples from the South Atlantic.
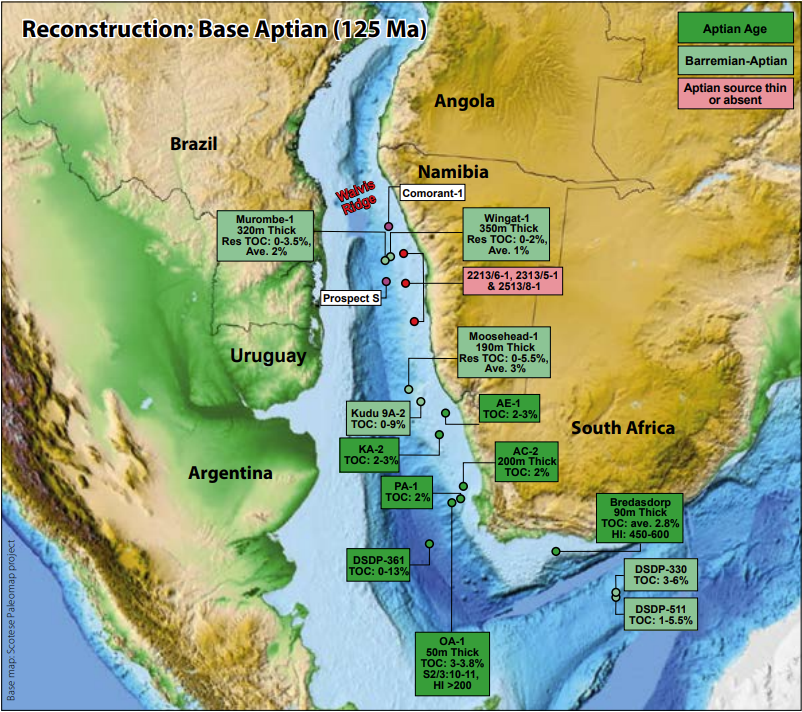
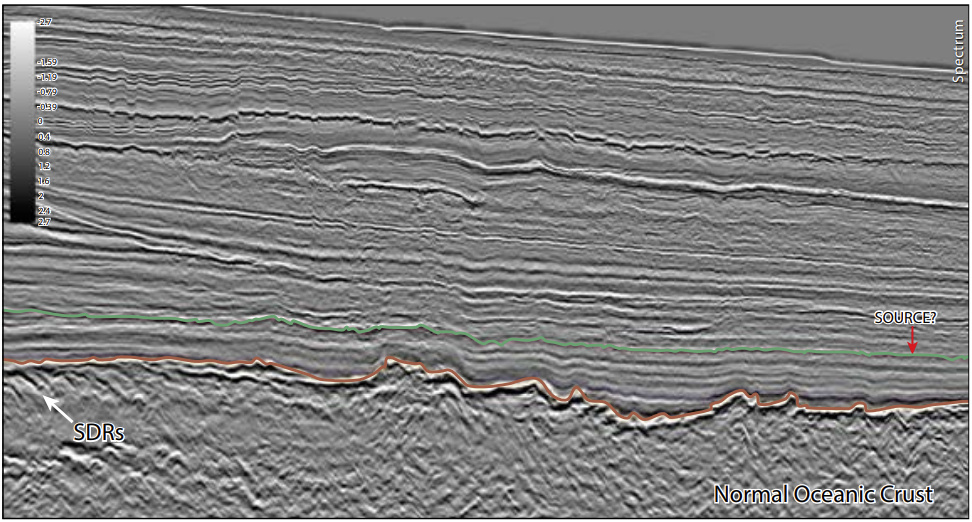
The deep-water South Atlantic margin (south of the Walvis Ridge) is notable for the lack of sediment-filled syn-rift half grabens and the presence of large seaward dipping reflector packages (SDRs) which when drilled proved to be predominantly subaerial basalts. The accommodation space produced during extension was filled by magma rather than sediment, which implies an absence of syn-rift source rocks. However, the presence of good quality post-rift Aptian/Barremian-age source rocks has recently been proven along the deep-water Namibian margin (Melo, 2012, Guiza et al., 2016).
This has significantly improved the perceived hydrocarbon potential, with several major oil companies recently moving into the area. Unfortunately, there have been no commercial hydrocarbon discoveries so far. Some of these well failures can be attributed to lack of source rock presence and complex migration pathways.
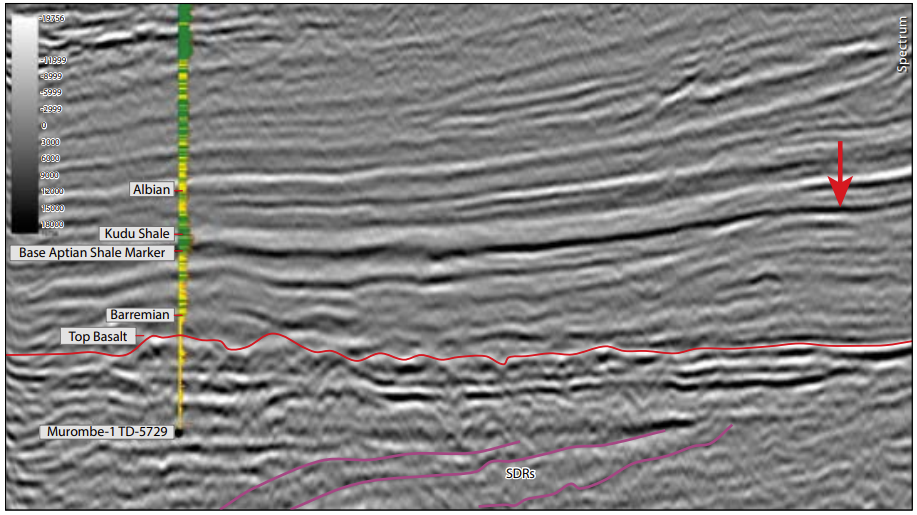
However, examining the nature of the Aptian/Barremian source rocks in the Murombe-1 well (offshore Namibia) and correlating them to the seismic data allows their seismic reflector characteristics to be used to predict their presence elsewhere, thus significantly reducing the exploration risk.
The conjugate South American Atlantic margin extends some 2,300 km from the Florianopolis Arch southward through the Brazilian Pelotas Basin of Brazil into Uruguay and Argentina (Figure 1).
Licence rounds are planned later this year and open blocks will also be offered. So far, no wells have been drilled down to the Aptian-Barremian potential source level along this segment of deep-water Atlantic margin. Analysis of seismic data will be crucial to reducing risk of source rock presence, quality, and maturity across these vast areas prior to wells being drilled.
Source rock characteristics
The Aptian/Barremian source rocks are widely distributed along the south-west African margin: this time period is well known as an important worldwide anoxic event. Source thickness can reach up to 350m, with the highest TOC values up to 10%, and hydrogen index values up to 550.
Sidewall core samples of the source rocks are composed of hard, silty, micaceous, non-calcareous, pyritic, dark grey to black shales. The highest gamma ray readings in the Murombe source rock shales are greater than 150 API units, and the sidewall core descriptions indicate these high gamma zones are the darkest coloured shale (Figure 2).
The individual high gamma-rich source rock intervals are generally less than a metre thick and are interbedded with medium grey claystones spread over a 320m-thick gross interval. Residual TOC values average 2% with maximum values of 3.5%. These values were measured from drill cutting samples taken at 9m intervals, so it is worth noting that individual 1m thick organic-rich source beds probably reach much higher TOC values of 10% or more. Also, the measured TOC can be considered to be residual values, as some hydrocarbons have likely already been expelled from the source rock.
Source rock properties and their seismic response.
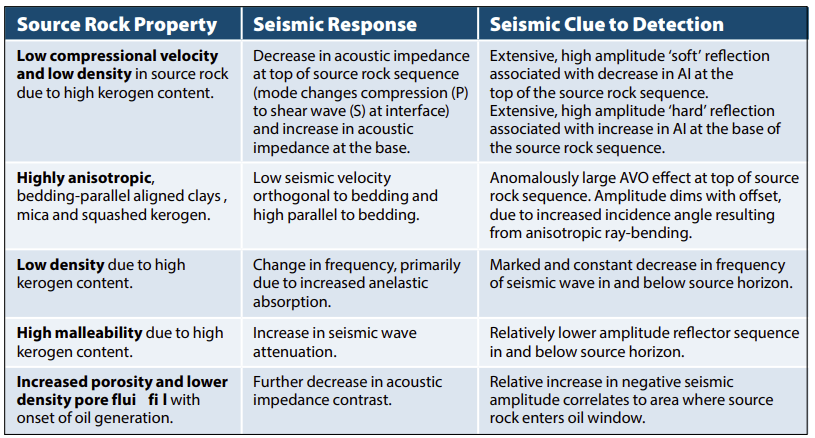
Kerogen has a low density of 1,100 to 1,400 kgm-3, half the average mineral density of the shales ((2,600 kgm-3), so the organic matter content, by volume, is twice the TOC value by weight. The low-density kerogen also has a low compressional seismic velocity, resulting in an anomalously low acoustic impedance (AI) contrast at the top of the sequence. Shales exhibit a non-linear decrease in AI with increasing TOC; AI values can reduce by almost 30% compared to an average shale, even at TOC values as low as 2% (Løseth et al., 2011). Hence, the top source rock should exhibit a large negative (soft) reflection and the base of the source rock a positive (hard) reflection.
The source rock interval encountered in the Murombe well can be correlated on SEG negative polarity seismic data with a strong black (positive amplitude) reflection (Figure 3) and can be mapped over wide areas.
Oil generation significantly increases both kerogen porosity and overall shale porosity, which causes a further reduction in seismic impedance (Vernik and Landis, 1996; Sondergeld et al., 2010). A useful test for the presence of a source rock is, therefore, to compare the seismic amplitude of the top source reflector with the predicted limit for the onset of oil generation. If there is a marked increase in amplitude which coincides or is approximately parallel to the calculated zone of oil maturation, this is further proof of source rock presence.
Seismic Anisotropy and AVO Analysis
Kerogen-rich shales consist of fine laminations on a micron to millimetre scale, composed of alternating ‘squishy’ kerogen and harder detrital and clay minerals. This hard-soft layering results in a strong intrinsic anisotropy in the source interval. Bedding anisotropy is also present at the centimetre to metre scale in the form of richer kerogen beds alternating with more siliclastic-rich lighter grey shales, as seen on the gamma ray plot for the Murombe well (Figure 2).
This anisotropy at all scales means the source rocks will have a higher compressional wave velocity parallel to the bedding, compared with a lower velocity orthogonal to bedding. Velocity anisotropy (parallel/orthogonal ratio) can reach up to 1.25 (Vernik and Landis, 1996). Strong anisotropy is also responsible for more pronounced mode conversion of P to S waves on the downgoing and upgoing paths through the source interval, and at the top and base source rock interfaces, primarily due to the increased incident angles at the interfaces, resulting from increased refractive ray-bending.
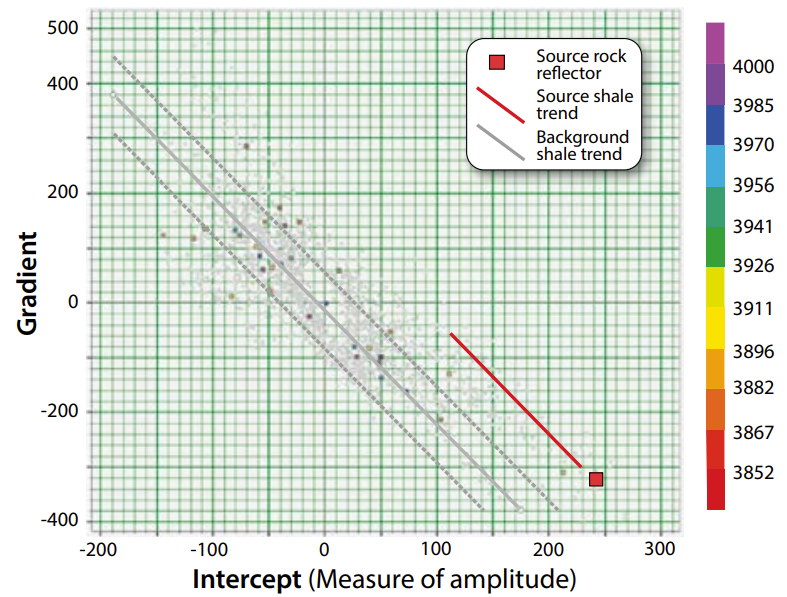
The seismic velocity anisotropy and wave mode conversion creates a large reflection amplitude dimming effect with increased source to receiver offset (AVO effect), which has been shown to increase with TOC content (Løseth et al. 2011). The significant decrease in AI coupled with the strong dimming of amplitude with offset is known as an AVO Class 4 response, which is not very common in sedimentary rocks. However, all shales exhibit an AVO effect, so the source rock reflector has to be compared with ‘background’ shale reflectors. This analysis has been performed around the Moosehead well in Namibia and for the top source reflector in Argentina, both showing that amplitude dimming with offset is much greater for the top source rock reflector compared to the background shales.
Seismic Attenuation
A high TOC source rock should increase the intrinsic seismic attenuation due to the high kerogen content. The malleable kerogen will permit relative grain movement to occur more easily, which absorbs the kinetic energy of the seismic wave, which should produce a sharp reduction in the both the amplitude and frequency of seismic reflections below the source rock.
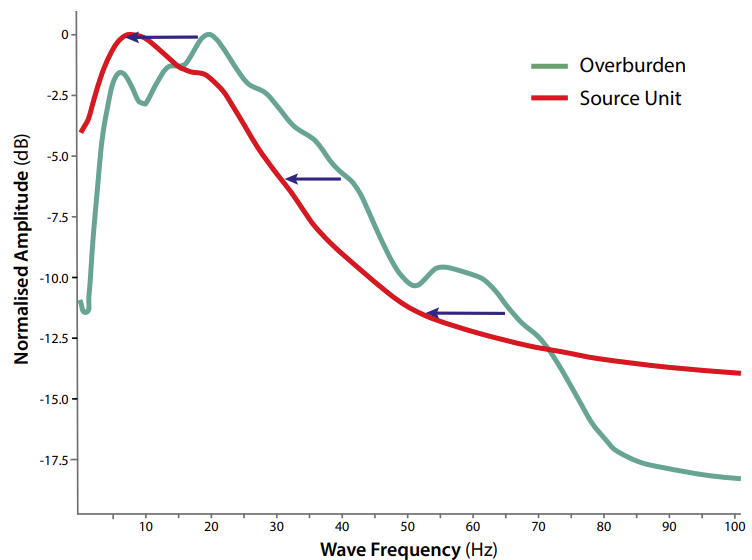
However, other factors such as overall transmission loss due to the waveguide effect of interbed multiples, scattering, and composition may outweigh the effect of intrinsic absorption. Analysis of seismic wavelet frequency from a seismic line in Argentina (Figure 5) indicates a distinct and constant drop of approximately 10 Hz below the top potential source rock reflector. If all else is equal this could be attributed to the increased seismic attenuation of a source rock.
Analysis De-risks Source Presence
Once seismic data have been acquired, amplitude, frequency and AVO analysis may significantly de-risk source rock presence and maturity at very little extra cost and effort. These are underused tools that deserve more attention. Seismic detection becomes even more valuable and better constrained once a well has been drilled; if a good source has been identified this can then be independently verified and mapped using the methods outlined here.
Acknowledgement
Ian Jones kindly provided very useful comments on this article. Duncan Wallace and Robert Fox are acknowledged for their insightful discussions.