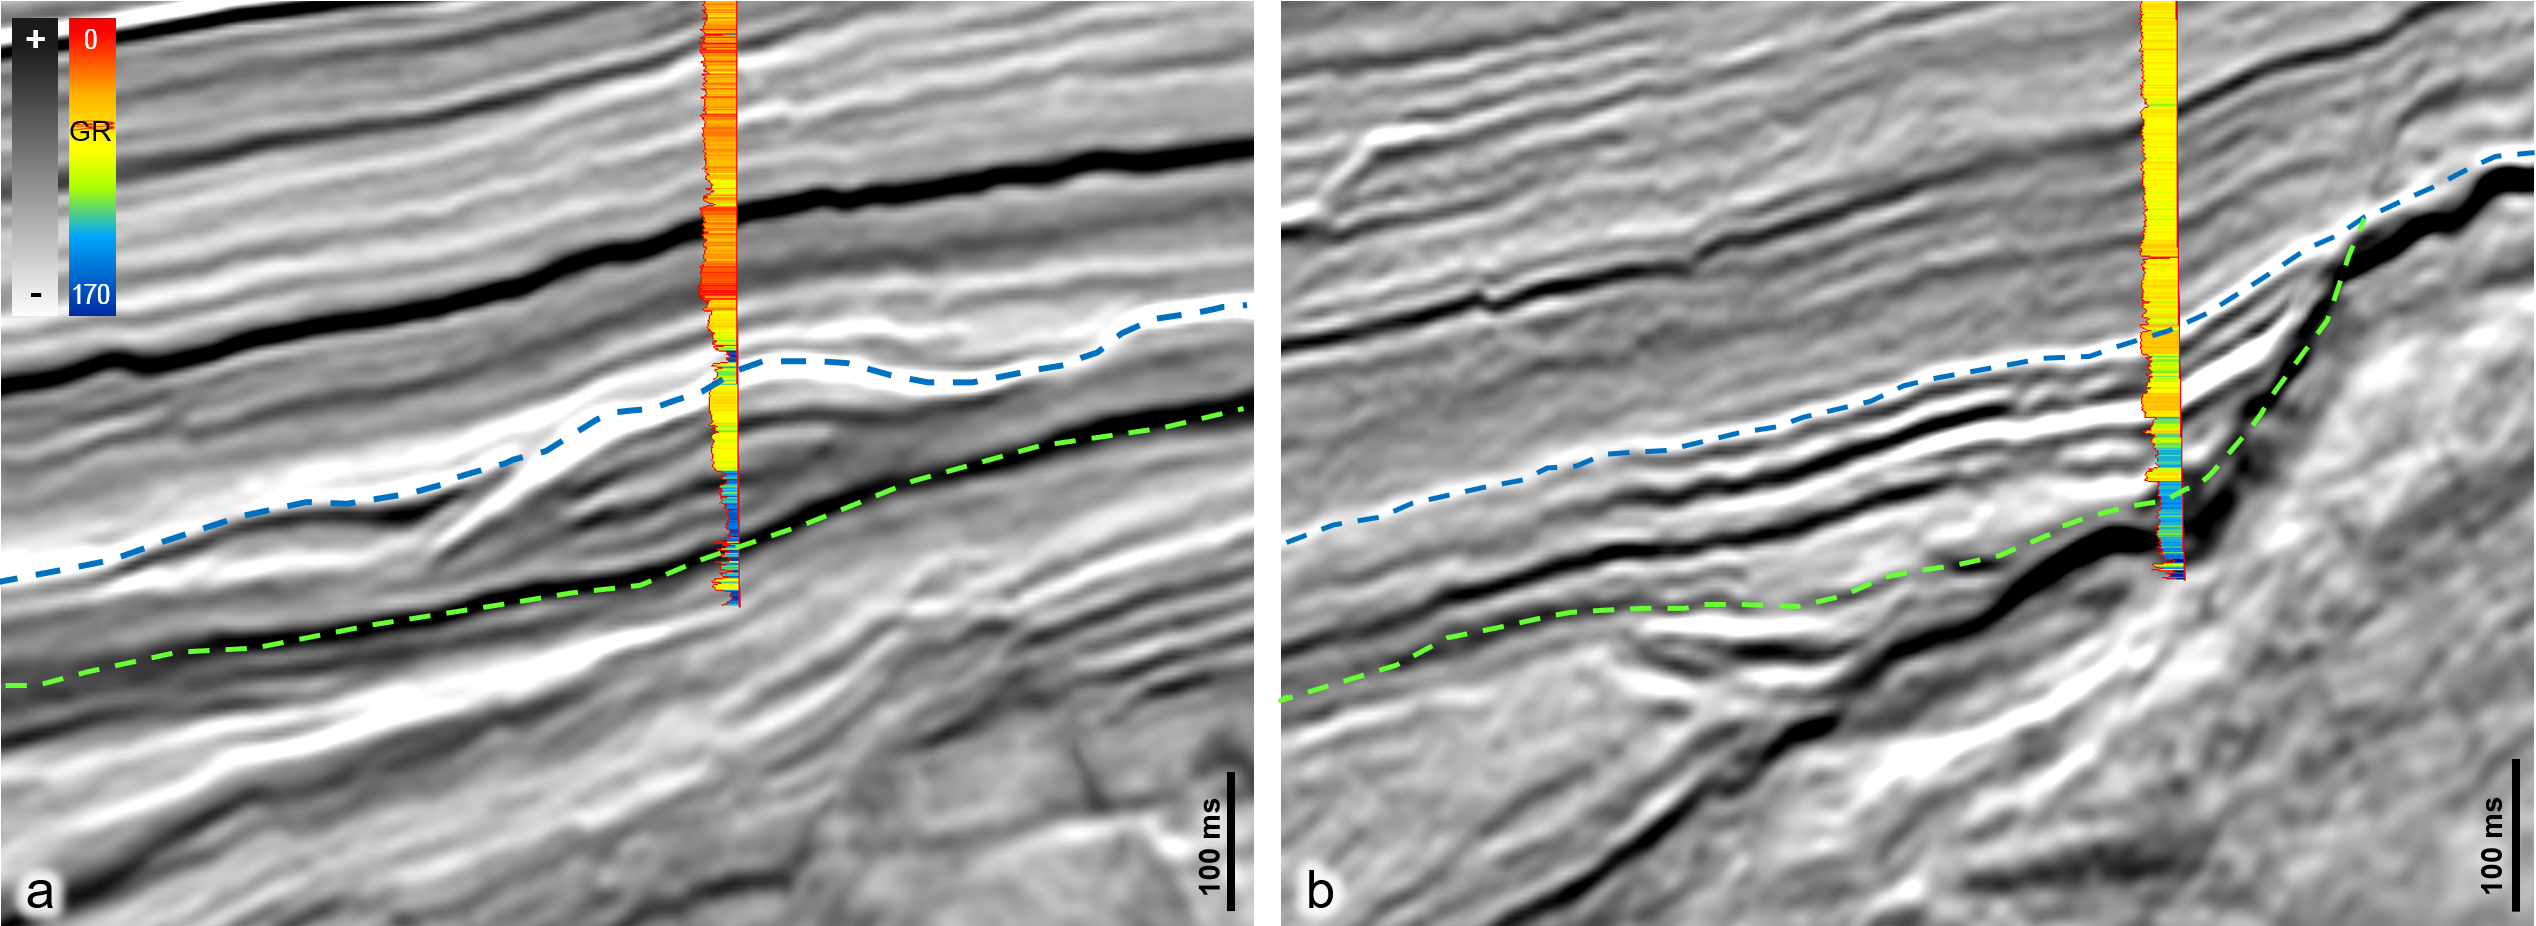
The northern North Sea is a highly active oil and gas exploration region, where several commercial discoveries have been made over recent years. The Lower Cretaceous sands within the Agat Formation represents an important reservoir play that has been targeted for decades. The quality and spatial distribution of the sand within the Agat Formation varies over the area, making it challenging to map the Agat play. This high-quality regional dataset is a valuable tool for interpretation and attribute generation to map out and correlate the different Agat sand packages and fairways. Hydrocarbon exploration targeting the Lower Cretaceous Agat sands began in 1980 after a serendipitous discovery by well 35/3-2. As a result, additional wells targeting the Agat Formation were drilled, but none of these were economic. This changed in 2016 when the Duva Field was discovered. Combined To better understand the play extent and decrease risk, Viridien re-imaged the eastern extent of the 3D Northern Viking Graben (NVG) seismic survey in 2023. The uplift in data quality, due to improved signal-to-noise and velocity model building, enables better mapping of the spatial distribution of the Lower Cretaceous units. We demonstrate that integrating high-quality regional seismic with well data and seismic attributes is best suited for describing The Agat sands on the north-south trending Måløy slope were deposited during repeated turbidity currents in a prograding submarine system, from a narrow shelf in the east, to the deep marine basin in the west. Deposition was partly controlled by underlying north-south trending fault blocks and Jurassic east-west oriented canyons, which has resulted in variable sand thickness and quality. This is further illustrated in Figure 1, where log data show a number of clean sand units, interbedded with siltstones and mudstones. We can identify sand units corresponding to a decrease in impedance which appears stronger where the sand is cleaner, as seen in well 36/1-3 (Figure 1b). By correlating the sand at the well locations with their seismic response, we can begin to map the sand units away from the wells, and then assess lateral and vertical heterogeneities and reservoir complexity. To map the different sand units in the basin, we need to understand the differences in the depositional geometry of the feeding systems. The detailed maps, shown in Figure 3, indicate individual Agat sand pulses. The isochore map of the Agat Formation in Figure 3a shows The RMS amplitude extraction of an intra-Agat horizon (Figure 3b) reveals distinct stratigraphic features. Several elongated and linear geometries observed can be interpreted as potential sediment fairways extending into the basin, marked with SF in Figures 2 and 3. The amplitude variation can be To support this further, the RGB colour blend in Figure 3c shows good correlation with the bright amplitude features identified on the RMS map. A combination of the two attributes highlights the intricacies of the fairways on the Måløy Slope. SF1 passes through the Duva Field and Hamlet discovery, and the shape and orientation of the fairway imply multiple sedimentary input directions from the south and southeast. The amplitudes vary over the entire fairway. Brighter amplitudes seem to correlate with a sandy channel-like feature as seen at the location of the Duva discovery. Dimming of amplitudes in some areas can be explained by the sands pinching-out or by the presence of mud-filled channels, which tend to form a seal, as seen with the interbedded sandstones and mudstones in Figure 1. This can explain the lack of hydrocarbons in SF2 is east-west oriented crossing the Ofelia discovery and the Grosso dry well. Input of sediments from the east would suggest the fairway being more sand-rich at Ofelia and in a more heterolithic part of the system at Grosso well, where the Agat Formation consists of thin sand-shale intercalations. SF3 and SF4 are northeast-southwest oriented, suggesting sediment input from the northeast. These two fairways appear to contribute with sediment input in SF2, a possible explanation for the thicker Agat Formation encountered by the Grosso well, but no wells have penetrated the sediments inside SF3 Clearly, there are many feeder systems across the Måløy slope and here we show just one of the intra-Agat horizons. Further mapping of the Agat interval has the potential to reveal more complexities of the individual sand pulses. This, combined with leveraging additional insights from well data, can provide a full analysis of the provenance and depositional architecture of sand units and, thereby, the reservoir thickness and quality, offering the potential to further unlock the exploration potential of the Lower Cretaceous on the Måløy Slope.
Norwegian North Sea: Identifying details of Lower Cretaceous sand fairways on the Måløy Slope
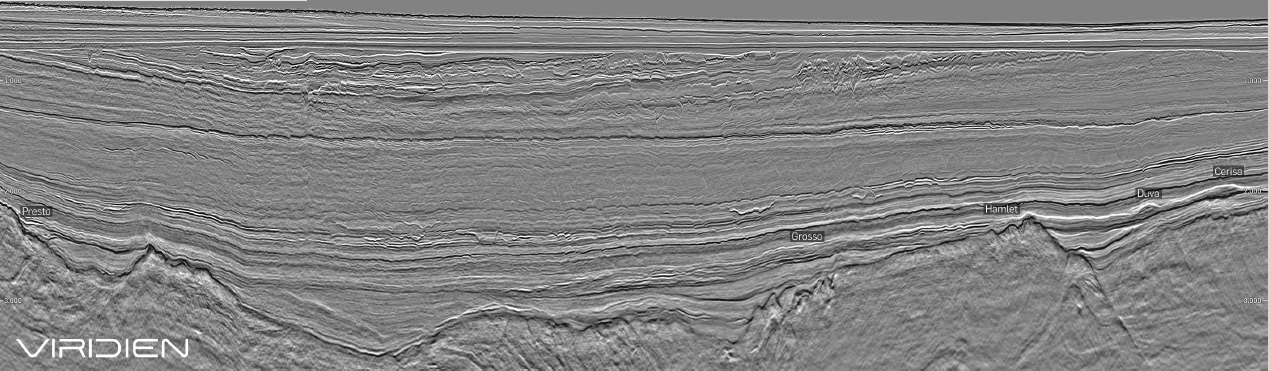 The composite seismic line is taken from the newly re-imaged ‘Northern Viking Graben N-S East’ dataset. The line passes through a number of wells on the Måløy Slope where the Agat Formation is relatively thick. These include the producing Duva Field, the new Hamlet discovery and the Cerisa prospect, which is currently being drilled (May 2024).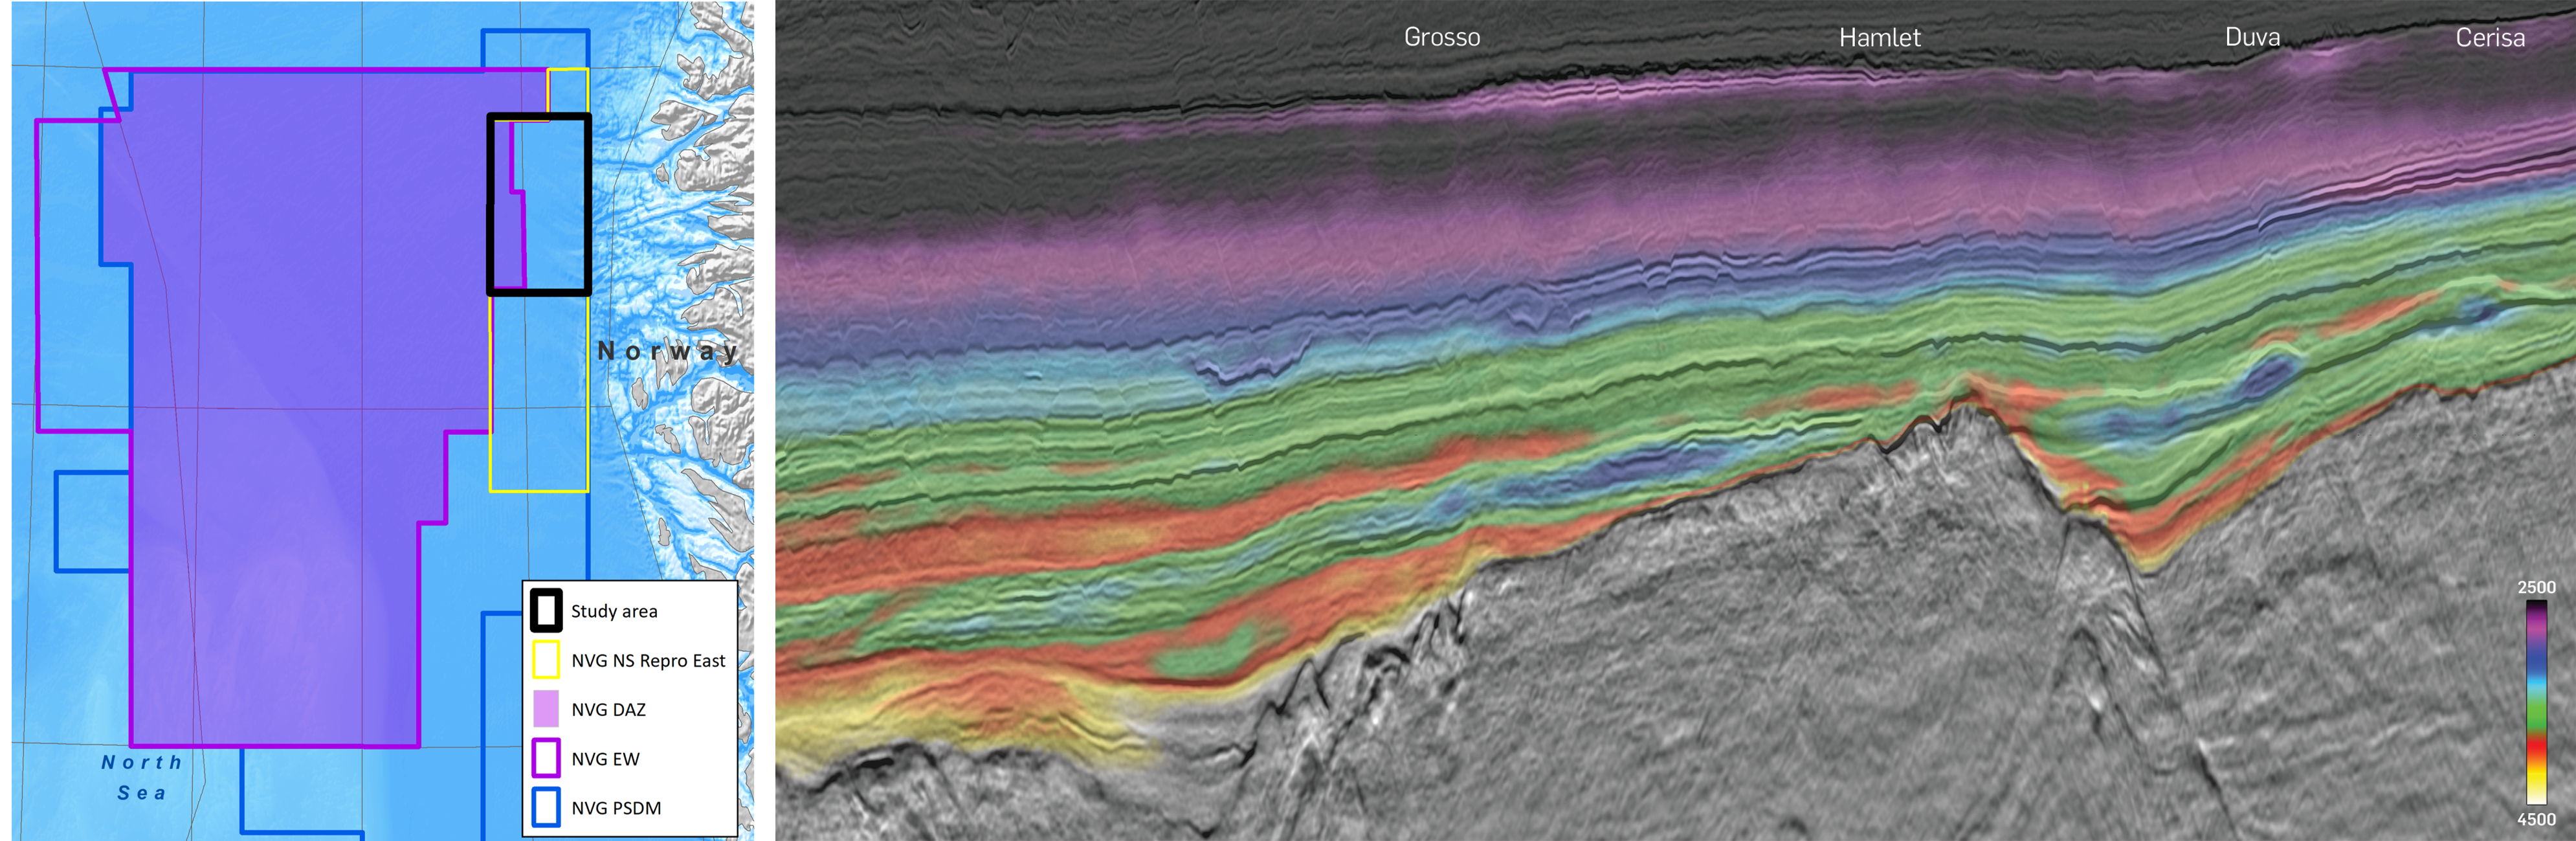
Imaging uplift overcomes mapping challenges of Lower Cretaceous Agat Play
Viridien’s re-imaged 3D seismic data set on the Måløy Slope brings a new understanding of the Agat sand fairway systems
with the success of Neptune Energy’s Hamlet and Ofelia discoveries in 2022, there has never been a greater need to understand the complexities of the deposition and distribution of the Agat sands.
the geometry, shape, and extent of the Agat sand deposits.Identification of the Agat Sands
Mapping of the sand fairways
Figure 2 shows seismic sections across east-west feeding systems. We can observe how the thickness of the unit varies not only across
the different systems but also within each fairway.
the thickness variations identified in Figure 2 but at a regional scale. We see strong differences in the presence of the Agat Formation, with its
thickness ranging from absent, due to bypass and non-sediment deposition in the east, to more than 350 meters in the basins.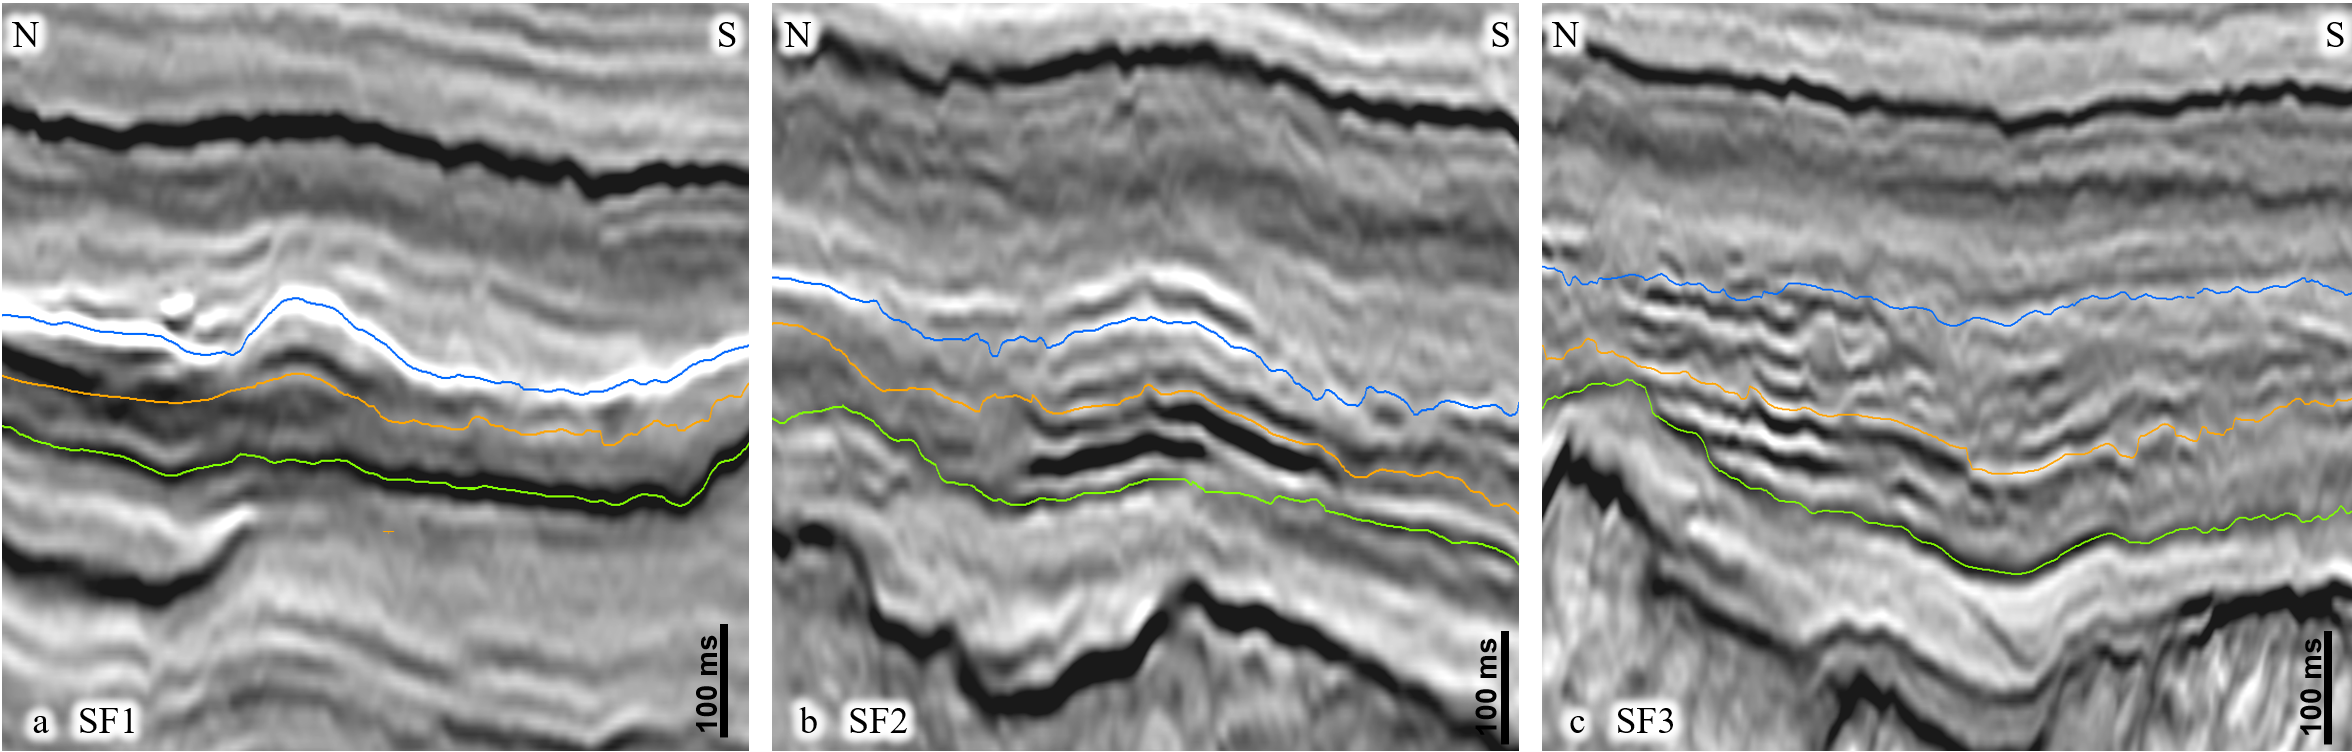
and base of the Agat Formation, respectively. The orange line represents an intra-Agat surface used to extract the attribute maps displayed in Figure 3.
explained by the difference in sand content, with better-quality sands giving a strong amplitude response, as seen at the Duva discovery well in Figure 1a.
well 36/7-3 despite encountering good-quality sands.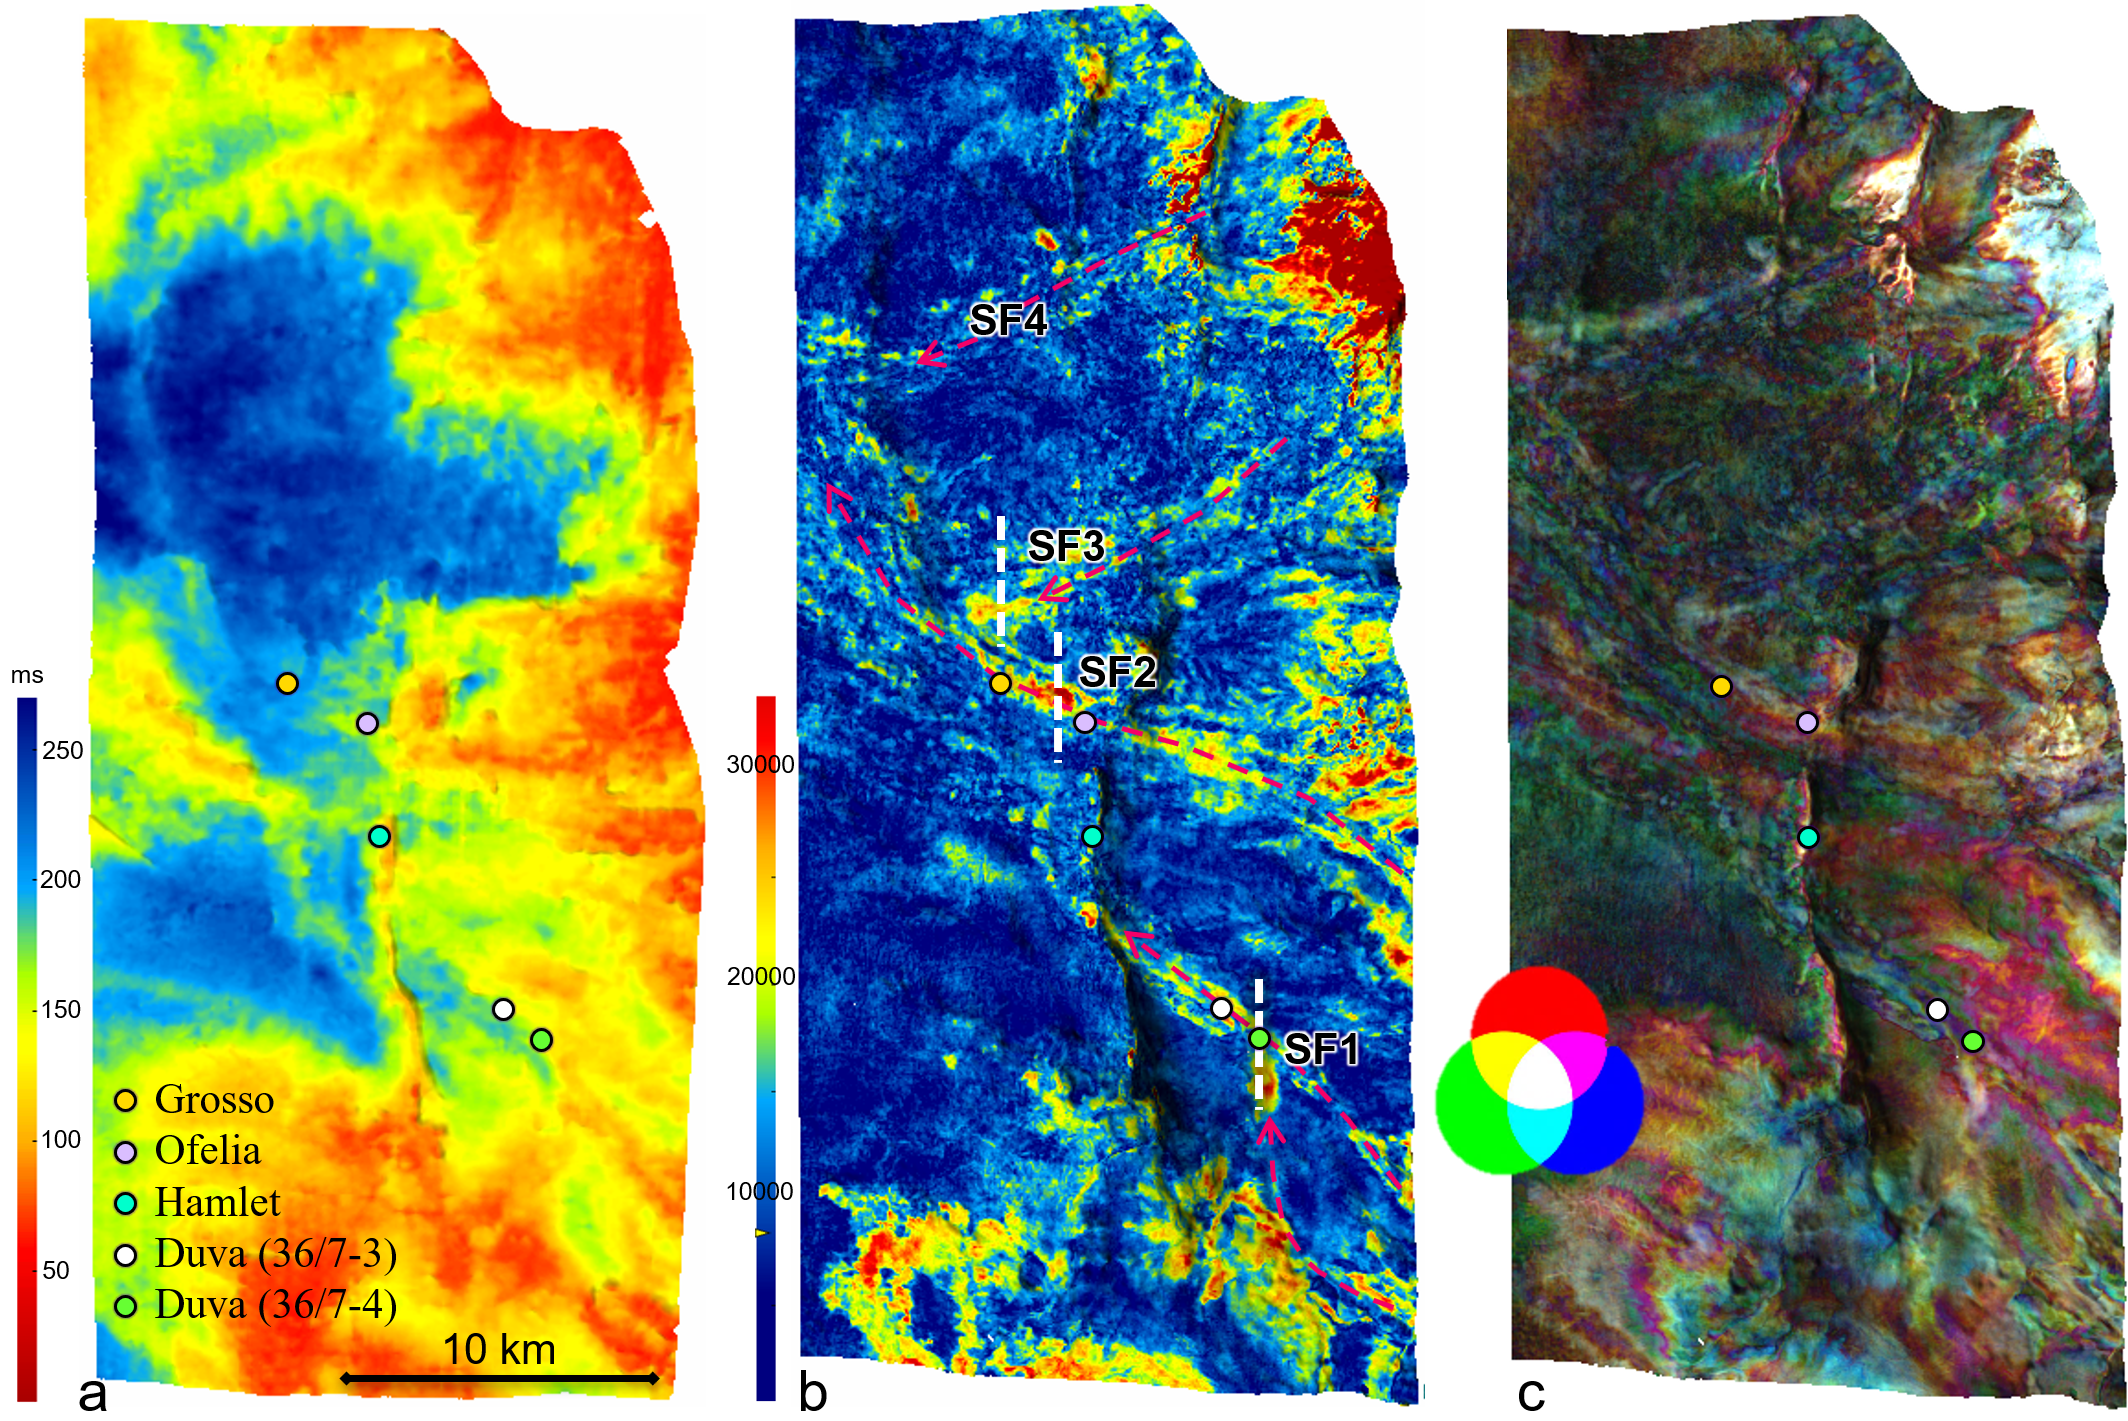
and SF4 to confirm this.Unlocking further potential
Related Articles