
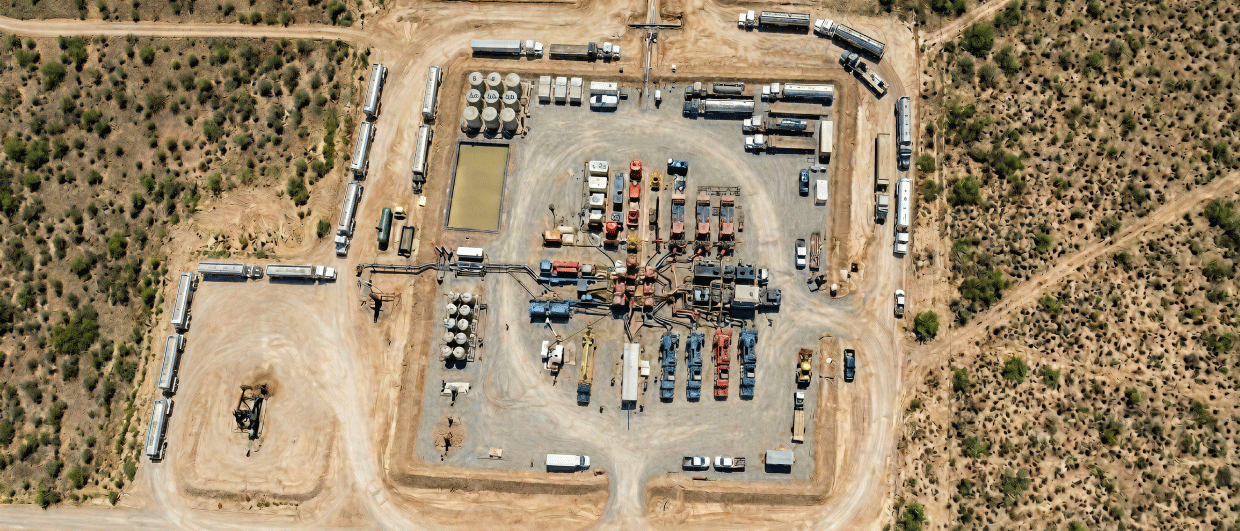
A depiction of high-resolution satellite imagery available through Synmax Intelligence. Source: SynMax.
Harmonising public data with ground truth
How satellite intelligence closes the information gap in US natural gas forecasting

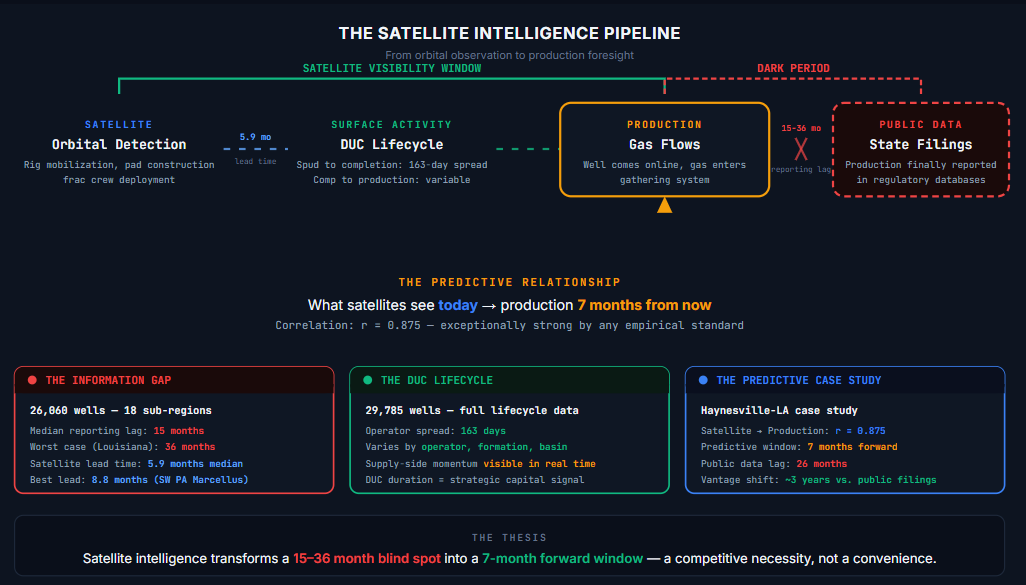
Public production data is the backbone of natural gas market analysis, yet it arrives with a structural delay that few participants fully appreciate. Across 18 producing sub-regions, encompassing the Marcellus, Utica, Haynesville, Eagle Ford, and Permian basins, analysis reveals a median reporting lag of 15 mths between initial well production and its appearance in state regulatory filings. In Louisiana, home to the Haynesville Shale, that regulatory lag stretches to 36 mths. For the better part of three years, one of the nation’s most prolific gas basins is effectively invisible to anyone relying heavily on public records.
Inverting the information gap
Satellite-derived surface intelligence offers a way to close that gap. By tracking rig mobilisations, frac crew deployments, and wellpad construction across the contiguous United States, Synmax matched 26,060 satellite-detected wellpads to their eventual state production records using geospatial and temporal alignment.
The result is a median satellite lead time of 5.9 mths, representing the interval between the first observable surface disturbance and the well’s reported production start. In the Appalachian Marcellus, that lead time reaches 8.8 months. Rather than merely narrowing the information gap, the satellite signal inverts it entirely, providing forward visibility where public data offers only a rear-view mirror.
Quantifying the DUC lifecycle
This visibility becomes especially valuable when applied to the Drilled but Uncompleted (DUC) lifecycle. The interval between spudding a well and bringing it online is not a fixed constant. Instead, it is a strategic variable shaped by operator economics, formation geology, and regulatory regimes.
Among 29,785 wells with complete timelines, operators working in the same formation show a 163-day spread in spud-to-completion timing. This reveals sharply different capital deployment strategies that remain invisible in aggregated public data. These variations make real-time DUC tracking a powerful lens into completion scheduling and supply-side momentum, but only if the activity is observed as it happens, not reconstructed months later.
The Haynesville horizon
Nowhere is the case more compelling than in the Haynesville. Put simply, what satellites see on the ground today dictates what production looks like seven months from now. The statistical correlation between current satellite activity and future output is $r = 0.875$, which is exceptionally strong by any empirical standard.
In a basin where public data arrives 26 months late, satellite intelligence provides a 7-month forward window. This shifts the analyst’s vantage point by nearly three years relative to public filings alone. As the industry moves toward faster, more capital-disciplined development cycles, the ability to observe real-time ground activity is no longer a luxury. It is a competitive necessity.