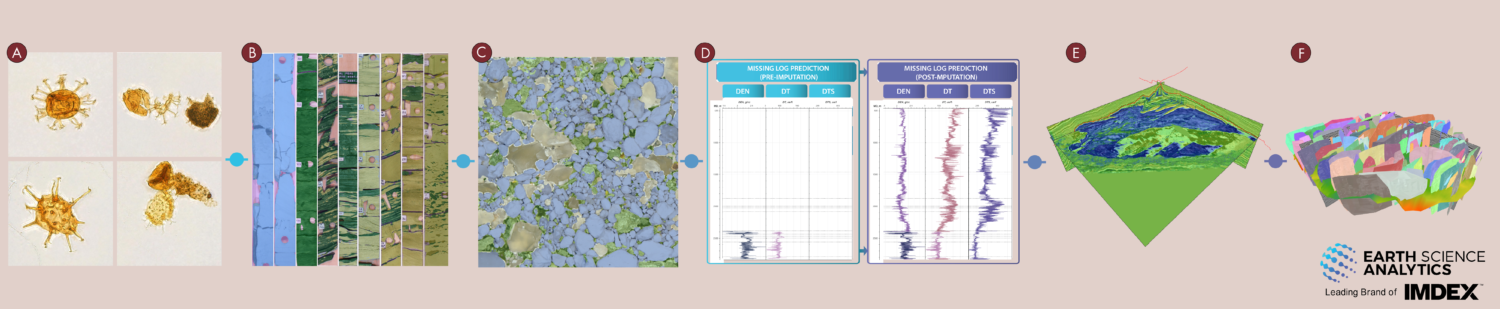
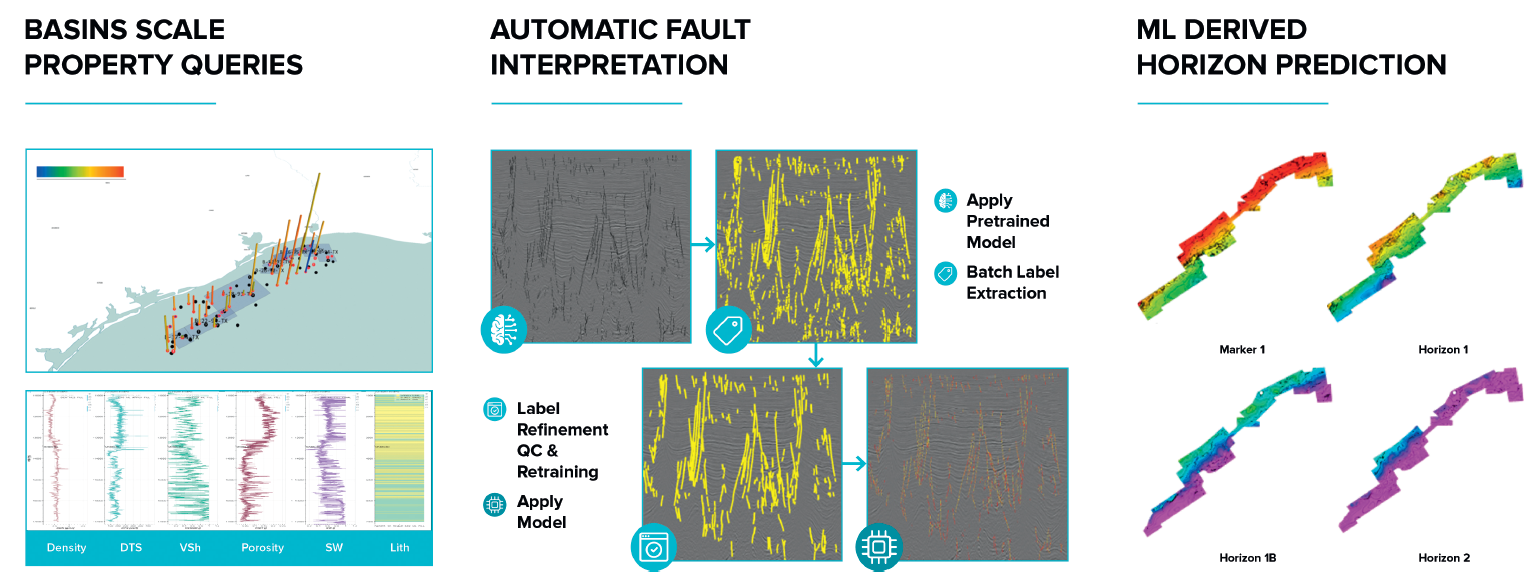
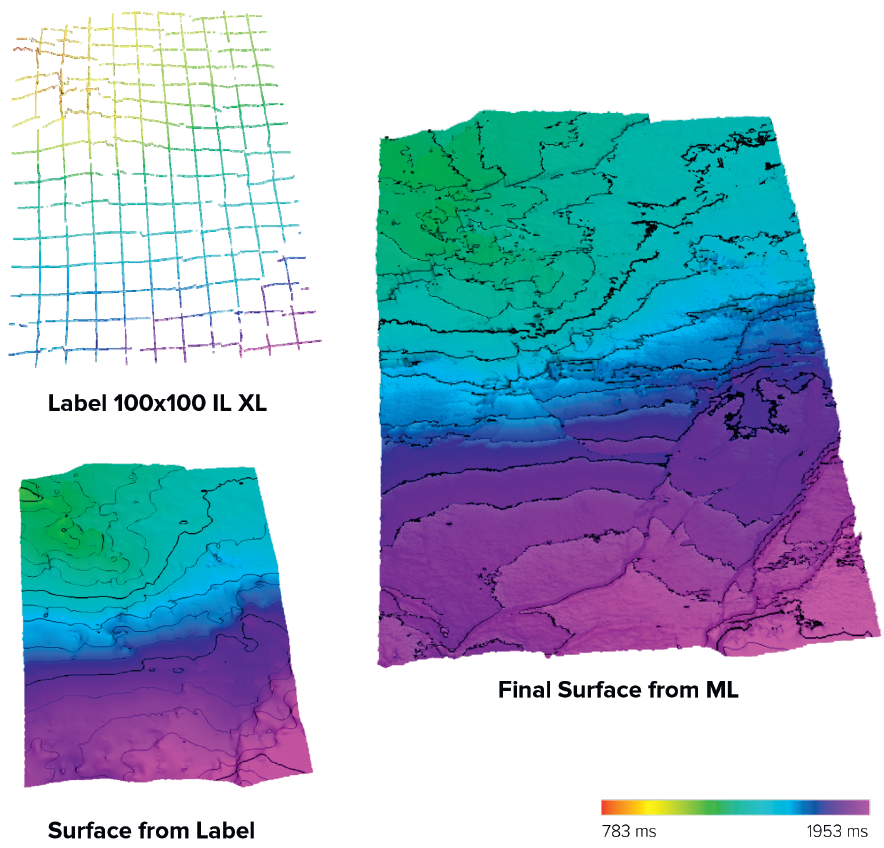
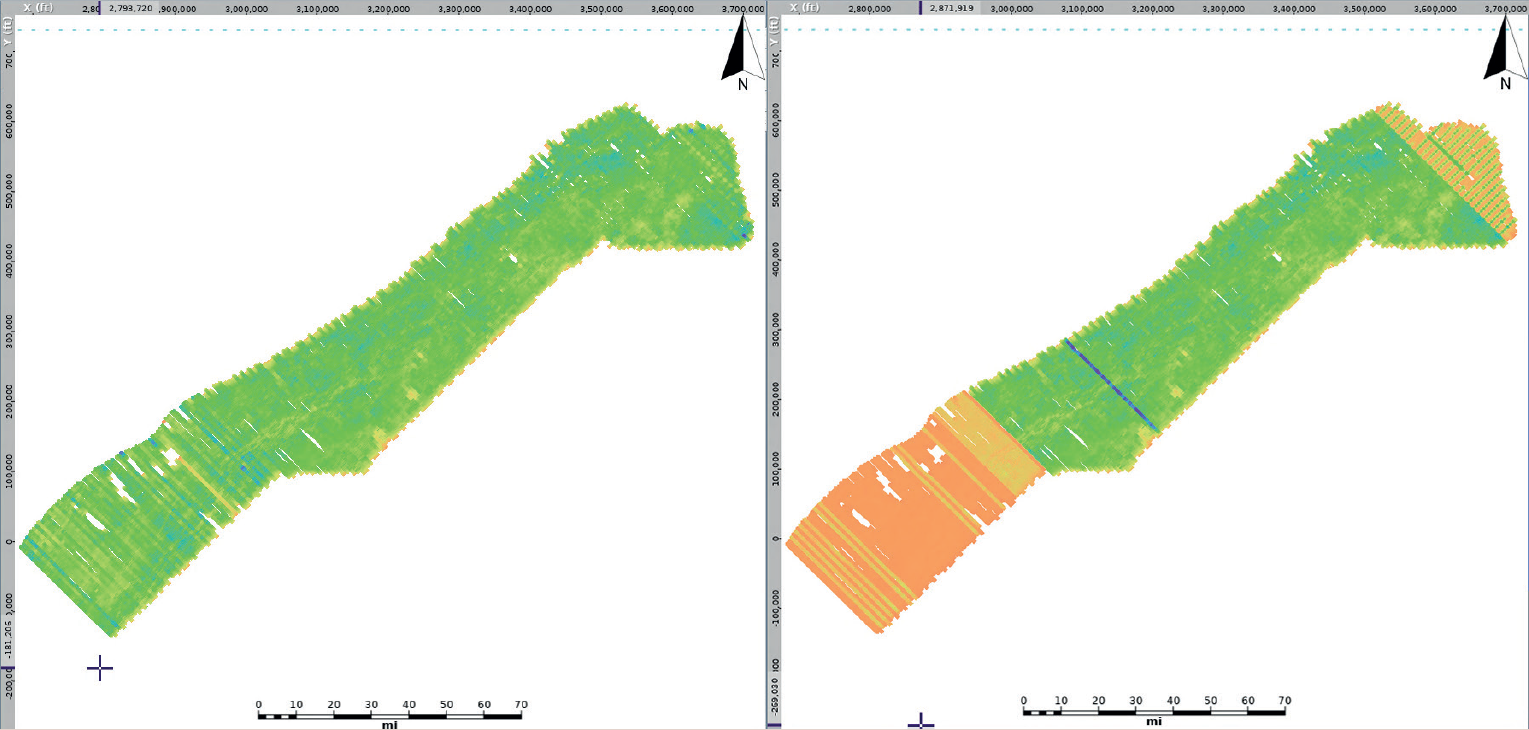
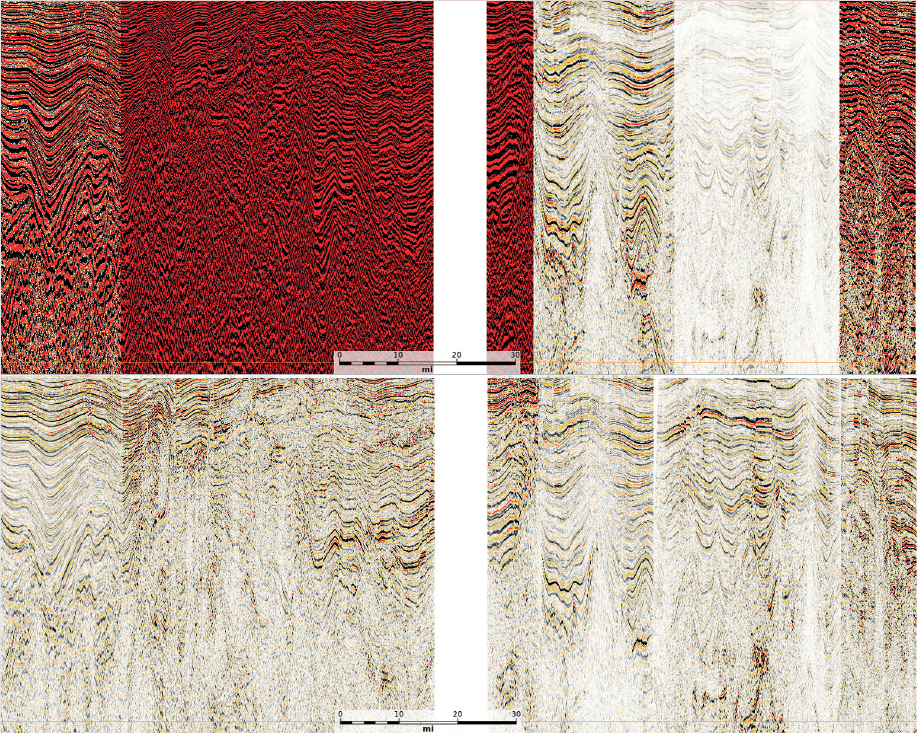
CCUS is widely accepted as a vital emissions reduction technology to mitigate the effects of climate change. The initial candidate locations to inject CO2 into the subsurface are likely to be areas of prolific oil and gas exploration and in close proximity to anthropogenic sources of CO2. Examples of this include areas with good infrastructure and favourable geology that have been well documented. With many places worldwide fitting these criteria, shooting new seismic to cover each promising area is an unrealistic cost. Therefore, returning to legacy data and using a machine learning approach to rank areas is a cost-effective tool that can be deployed worldwide to provide insight into potential locations. A clear candidate for CCUS is the US Gulf of Mexico (GoM). Exploration has been ongoing in the region since the late 1930’s meaning there is a plethora of information about the offshore from many operators. As a result of this exploration, plentiful infrastructure already exists which would ease the transition from oil and gas exploration and production to CCUS injection. The geological history of the GoM is particularly favourable for injection. Characterised as having a two-phased opening, the first phase of rifting began in the Late Triassic to Early Jurassic with the separation between the South American and African plates. Subsidence followed during the Early to Middle Jurassic before the Yucatan block drifted in a counter-clockwise direction, initiating the second phase of rifting. From the Early Cretaceous through to the Paleocene, a significant sediment succession was deposited in the basin. Deposition continued through to the Early Eocene, decreasing temporarily in the Late Eocene. The Miocene is a key interval for CCUS injection as it is at a significant depth to remain in a supercritical state, as well as having sufficient porosity to store CO2. The Miocene is dominated by fluvial deltaics, but there is a significant migration of deposition eastwards from the Paleocene-Oligocene to the Mio-Pliocene. The Miocene interval represents a sufficient reservoir for CO2 storage as well as having thick seals above the reservoirs. Seismic data and detailed interpretation are instrumental to improving the understanding of the implications of injection. To screen potential locations for injection, publicly available legacy data from the BOEM website has been utilised. Eight 3D’s and three 2D’s, covering a total area of 31,197 km2 from ‘High Island’ to ‘Brazos’ have been analysed for this study (Figure 1). This AOI was selected following the analysis of areas with good seal and reservoir potential from available data. The data in question vary in vintage from 1984-1996. Consequently, the image quality is highly varied. For Machine Learning processes to characterise sites effectively, conditioning was required to create useable volumes. Initially, the frequency spectra for each 3D were investigated to identify the most consistent survey. Once selected, conditioning was completed in a radial pattern from the ‘reference survey’ until each survey had been conditioned. This conditioning workflow is summarised below: Below is a before and after image of an arbitrary line through some of the volumes (Figure 3). The upper image shows the volumes at the same amplitude before any processing has taken place. The amplitudes here have the same range but vary drastically. Some of the amplitudes are far too strong, others are ‘washed out’ by the large range. The final image is shown below, although some joins in the data can be seen. The overall amplitudes are now comparable and ready for Machine learning. Unfortunately, no information was provided on any of the volumes to understand processing sequences. Field tapes were inaccessible too, meaning inherent issues within the data could not be removed. Better understanding lithologies was now the focus. Within this area, approximately 4,137 wells were available for use. To find the most appropriate wells in the context of CCUS site selection, a series of criteria were applied. Crucial elements in the selection of wells included: availability of paleo reports, check shots & digital well logs and areal distribution. The well data also varied in quality with vintage. From this process, 132 wells were selected in total. For direct comparison between wells, a standardized nomenclature of tops was created. To interpret the seismic data, Earth Science Analytics’ Data management and Machine Learning (ML) EarthNET software was used to create fault probability volumes. These volumes were subject to several iterations to remove ‘false positives’, improving the veracity of the results. Unassigned fault sticks were then deduced to give a good overview of the structural complexity of the AOI. The next step was horizon interpretation. For this process, a supervised learning approach was used. Labels of the various key horizons for reservoir and seal were picked and used to create accurate horizon interpretations. ML models were trained to predict the horizons from full-stack seismic data, which was then applied over the entire study area. This combined with the structural analysis allowed an initial ranking of key areas. A further analysis was completed using the information from wells, where logs were compiled and conditioned to produce reservoir and seal properties including lithology predictions. EarthNET 1D workflow was used to build a contextualized and indexed dataset. The workflow includes comprehensive well log QC, completing missing log predictions and reservoir and seal property predictions. The conditioning of well logs involved removal of nonphysical values, interpolated zones, and flagging data of poor quality. For missing log predictions, multiple models were trained with available logs at each depth. Models with a higher number of logs usually have a higher accuracy but often lower coverage. With fewer logs, the coverage is often better, but the accuracy is decreased. In this sense, a ‘fill in’ technique is required in areas with high coverage and less data to prioritise logs that are more reliable. The training process is supervised, ML metrics as well as blind testing are used to verify the performance of the models in addition to a geological sense check. The culmination of this analysis allowed us to make informed choices regarding the most suitable sites for CO2 injection. These locations were further screened for their viability to contain CO2 by evaluating implications of the pressure environment and potential volumetrics. Using ML techniques with legacy data, workflow timescales have been significantly reduced. The processes described above allow for legacy data to be repurposed, and when combined with ML, generate an incredibly powerful workflow to rank sites in large areas. Decision-making time is significantly condensed. This process allows ranking of areas, reducing both cost and time, and can be developed for other regions in the world. For injection to take place, there may remain a need to shoot modern seismic to fully understand the nature of the subsurface, as there is a limited amount of conditioning that can be undertaken until a new shoot is required.
Characterising CCUS sites: Legacy data – Powered by machine learning
 Workflow illustrating the process described in this article.
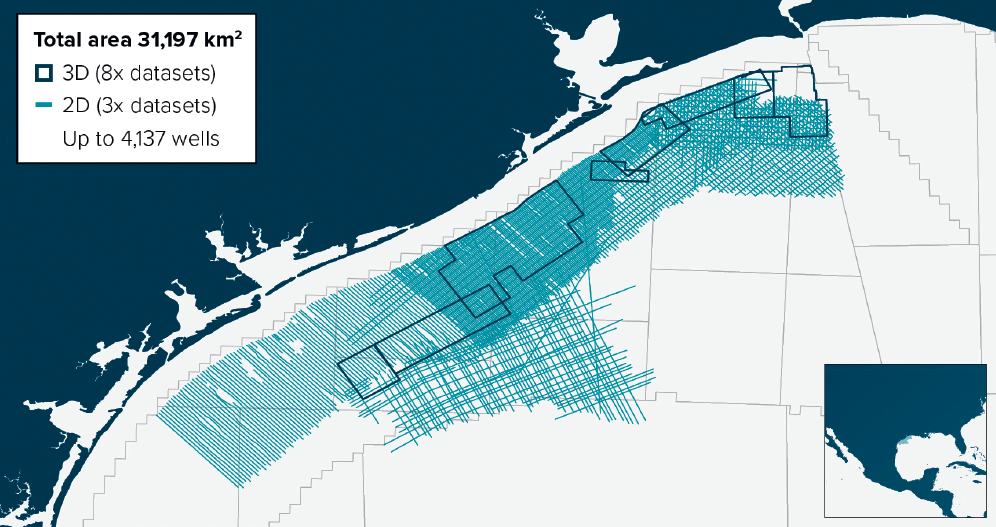
The US GoM and beyond
Legacy data, prepped for the future
Reducing timescales, generating value
Worldwide implications
Related Articles