Recent Advances in Climate Change Research: Part XVI – A Greenhouse Model for Stratospheric Cooling – 2
In this part, we introduce you to the 1D window-grey radiation model of the atmosphere, which illustrates the physical essence of the mechanism by which a CO2 increase cools the stratosphere and mesosphere.
Increased concentrations of greenhouse gases are warming Earth’s surface and troposphere while cooling the mid to upper atmosphere. We introduce you to the 1D window-grey radiation model of the atmosphere, which illustrates the physical essence of the mechanism by which a CO2 increase cools the stratosphere and mesosphere.
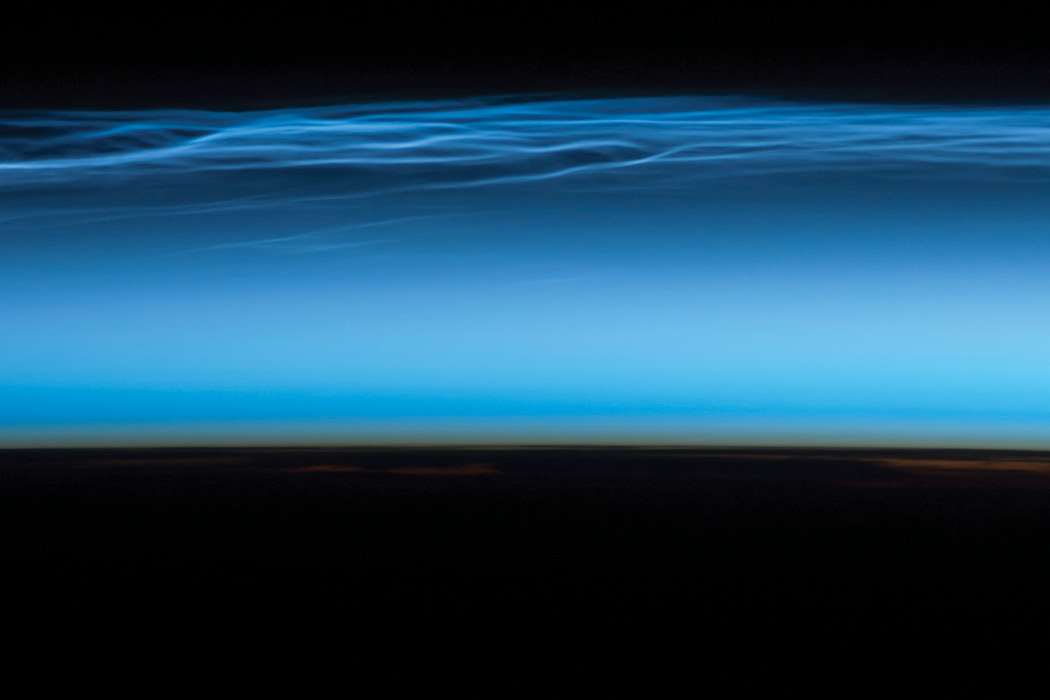
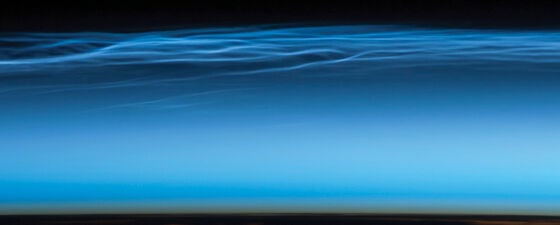
Figure 1: Polar mesospheric clouds (PMCs) appear as shining threads against the darkness of space – hence their other names of ‘noctilucent’ or ‘night-shining’ clouds. They form 76–85 km above Earth’s surface when there is sufficient water vapour to freeze into ice crystals. The clouds are illuminated by the Sun when it is just below the visible horizon, lending them their nightshining properties. In addition to the PMCs seen across the centre of the image, the stratosphere is clearly visible by dim orange and red tones near the horizon. Source: NASA’s Earth Observatory.
In the early 1960s, mathematical models of the climate system showed that increases in CO2 would be expected to lead to gradual warming of the Earth’s surface and the troposphere and cooling of the stratosphere. Later, temperature measurements from satellites confirmed these early forecasts. Today, the observed pattern of tropospheric warming and stratospheric cooling is supported by global-scale computer model simulations although there are some differences between models and observations. In the tropics, models show more warming in the troposphere than has been observed. In the Arctic, most models underpredict the observed warming of the troposphere.
The educational grey radiation model cannot explain cooling of the stratosphere. Therefore, it has to be extended to the window-grey model (see Figure 2).
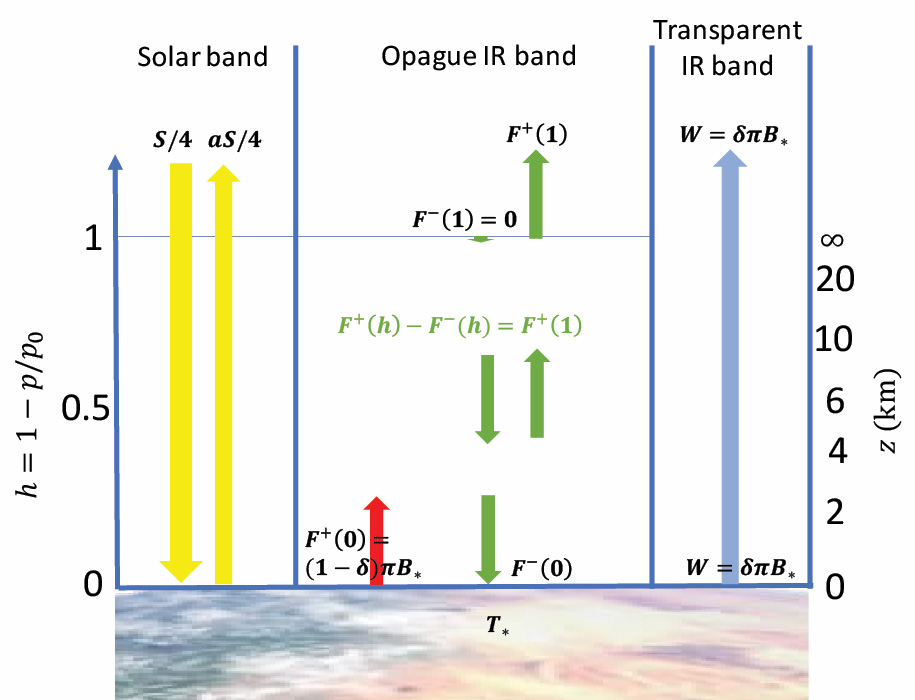
Figure 2: Sketch of the window-grey radiation model introduced by Goessling and Bathiany (2016). The atmosphere is transparent to the Sun’s shortwave radiation in the solar band. The Earth heats and sends upwards longwave, infrared (IR) radiation. Part of the radiation goes upward in Earth’s atmospheric IR window, being transparent to radiation. The rest radiates in the grey atmosphere (see Part XIII, GEO ExPro Vol. 18, No. 6) where IR radiation is absorbed by thin layers in the atmosphere. The layers heat and re-radiate energy to space and back to the surface. F+ and F- denote upward and downward fluxes, respectively. Earth’s surface at level z=0 radiates as a blackbody with flux F+(0)+W=πB*. At the top of the grey atmosphere there is no downgoing IR radiation, F-(1)=0. The Earth is in energetic equilibrium between the radiation it receives from the Sun and the radiation it emits to outer space. The condition of radiative equilibrium requires that the net flux at any given depth, F+(h)- F-(h), remains constant. The grey radiation model is the special case of no transparent IR band (δ=0). Credit: Lasse Amundsen.
Revisiting the Grey Radiation Model
In Part XIII of this series (GEO ExPro Vol. 18, No. 6) we derived the differential equations for upward and downward fluxes in the grey atmosphere model and derived temperature profiles for an Earth (atmosphere and surface) in thermal equilibrium. The single parameter of the grey model is the absorption coefficient β which describes the atmospheric opacity in the IR band. Earth’s surface temperature T* and the atmospheric temperature T(h) are functions of β. The atmosphere’s altitude was given in terms of the vertical coordinate h being the relative pressure deficit. The key results of this model are collected in Table 1.
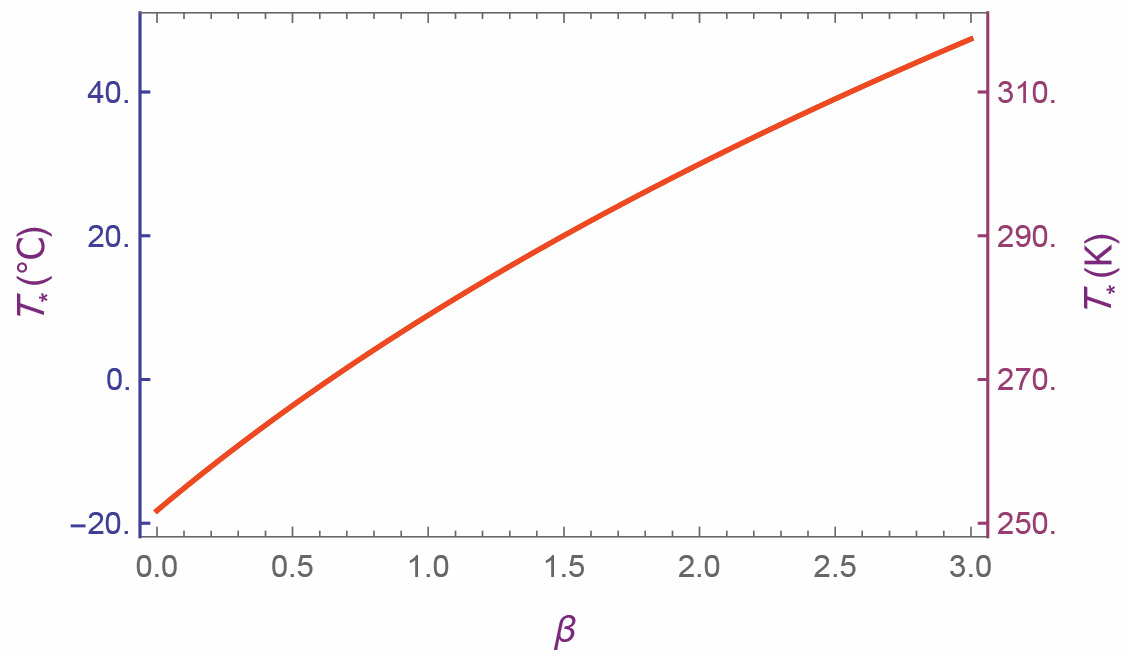
Figure 3: Surface temperature as function of absorption coefficient in the grey radiation model. Today’s surface temperature T*=289K (16°C) is obtained when β=1.31. Credit: Lasse Amundsen.
Let’s see what happens if the absorption factor increases, say, as a result of an increase in the CO2 level. The equilibrium temperature equations in Table 1 show that when the absorption coefficient β increases, then the atmospheric temperature (except at top of atmosphere, TOA) and the surface temperature both will have increased, after a new equilibrium is achieved. The grey model thus is not able to explain why temperature is decreasing in the mid-atmosphere when the absorption level increases. In Figure 3 we show the relation between the surface temperature and the absorption coefficient. Figure 4 (left) illustrates that the grey model predicts an increase in temperature everywhere in the atmosphere (except at TOA) for an increase in absorption factor from β=1.31 (the yellow line) to 1.5 (the red line).
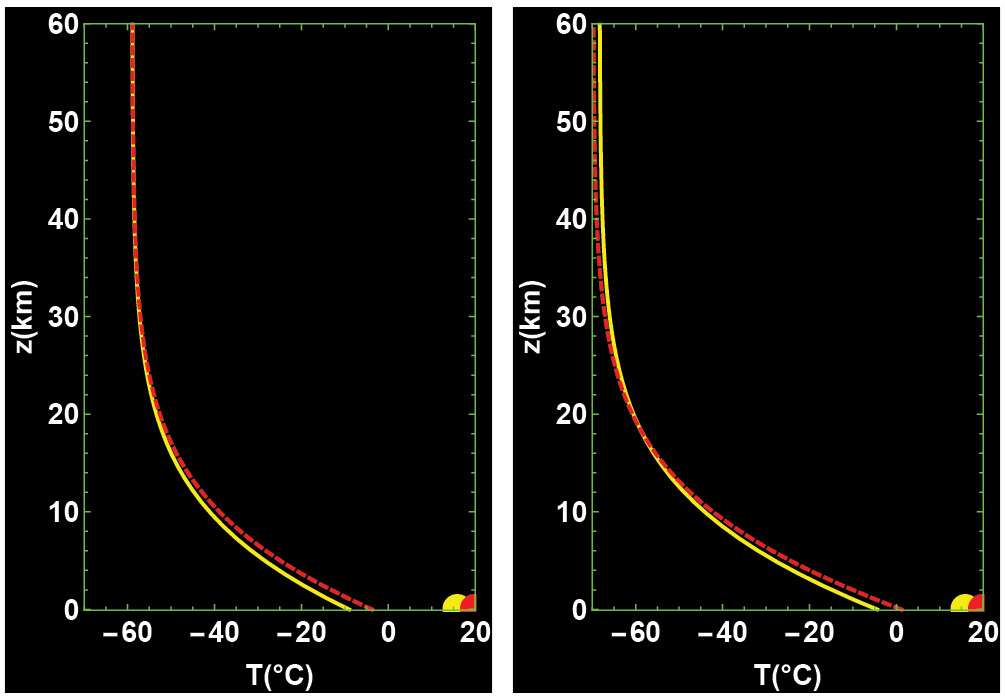
Figure 4: Left: The grey model predicts an increase in temperature everywhere in the atmosphere (except at TOA) for an increase in absorption factor from β=1.31 (the yellow line) to 1.5 (the red line). Right: The window-grey model predicts an increase in temperature in the lower atmosphere but cooling in the mid to top atmosphere for an increase in absorption factor from β0 =1.96 (the yellow line) to 2.32 (the red line). The parameter δ=0.2 describes the fraction of IR radiation from the surface which is directly emitted to space. The two cases have surface temperatures T*=289K (16°C) (yellow dot) and T*=293K (20°C) (red dot). The vertical coordinate z is only approximate height, calculated from h with a constant scale height L=8 km such that h=1–exp(−z/L). The discontinuity in temperature at Earth’s surface, where the atmospheric temperature just above is always lower: T(h = 0)<T*, is a result of the negligence of all mechanisms of energy transfer other than radiation in the model; in the real atmosphere, diffusion of heat removes the discontinuity. Credit: Lasse Amundsen.
The Window-Grey Radiation Model
Goessling and Bathiany (2016) suggest extending the grey model to the simple case of two IR bands, as shown in Figure 2. The first band is fully transparent and corresponds to the atmospheric IR window. The second band is the grey IR band which we have thoroughly discussed in Part XIII. It is straightforward to generalise the differential equations presented in Part XIII to take into account the atmospheric window part. The Earth acts as a blackbody in the IR region, radiating according to its surface temperature T* the flux πB* upwards. Part of this flux, W=δπB*, radiates in the atmospheric window. The rest F+(0)=(1-δ)πB*, radiates in the grey window. Assume that the absorption coefficient is β0. The source term in the differential equation for the upward flux in the window-grey model is reduced by the factor 1-δ compared to the grey model case. The differential equations that govern the flux transport now become
𝑑F+/dh = −𝛽0(𝐹+ − 𝜋B(1 − 𝛿)) (1a)
dF–/dh = 𝛽0(F– – 𝜋B) (1b).
These equations can be solved, given two boundary conditions: at the top of the atmosphere there is no downgoing upward flux, F-(1)=O, and the upward flux at Earth’s surface is F+ (o).
The derivation is beyond the scope of this document, but the reader can learn more about the topic by visiting www.bivrost-geo.no. The window-grey temperature equations which follow by solving equa-tions 1a and 1b are listed in Table 1. The window-grey model reduces to the grey model by setting δ=0 whereby β0→ β.
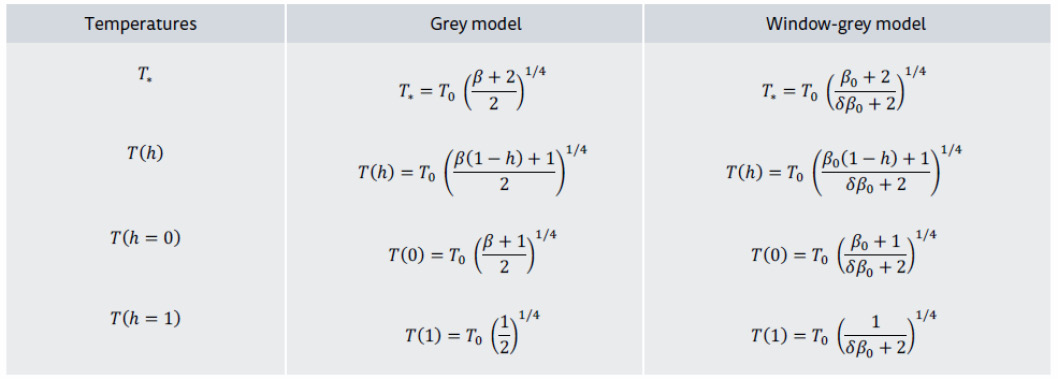
Table 1: Temperatures. Here, h is zero at sea-level and one where pressure is zero, in outer space. Further, T0=255K (-18°C) is Earth’s temperature in the reference case of no atmosphere. See main body of text for definitions. At the top of atmosphere, h=1, the temperature in the grey model is independent of the absorption.
The parameter δ describes the fraction of IR radiation from the surface which is directly emitted to space. Our interest is to get a feeling for how a CO2 increase – described by an increase in the absorption factor β0 – affects the temperatures. Since a CO2 increase introduces no effect in the atmospheric window, we can keep δ constant. Given δ, we can determine the absorption factor β0 that produces today’s surface temperature T*=289K (16°C). Figure 5 shows contours of (δ,β0) combinations that fix the surface temperature. The solid white line has today’s surface temperature. The choice δ=0 corresponds to the grey radiation model. For our temperature calculations we choose δ=0.2 and investigate the temperature behaviour when β0 is increased from 1.96 to 2.32.
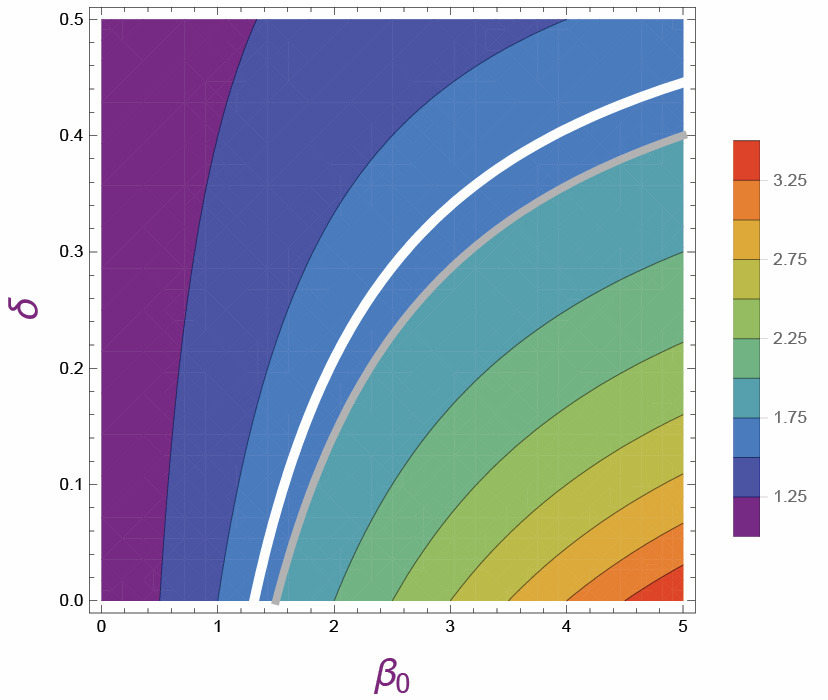
Figure 5: The dependence of the equilibrium surface temperature on the parameters β0 and δ in the window-grey model. δ=0 corresponds to the grey case. The temperature which is constant on contour lines is T*=289K (16°C) on the white line and T*=293K (20°C) on the grey line. Credit: Lasse Amundsen.
The temperature profiles are shown in Figure 4 (right). We observe that the surface temperature rises from T*=289K (16°C) to T*=293K (20°C), in agreement with the surface temperature equation in Table 1 which shows that the numerator increases more than the denominator with the β0 increase.
The atmospheric temperature at the surface, T(0), given in Table 1, also has to increase with increasing β0. Now, look at the atmospheric temperature at outer space, T(1), given in Table 1. In the grey radiation model T(1) never changes. It is constant, independent of any change in absorption of radiation in the atmosphere. In contrast, in the window-grey radiation model T(1) decreases with increasing absorption in the opaque part of the model.
This result is not only a mathematical result. It has a physical explanation when we allow the atmosphere in the infrared to have two bands. The important observation to make is that the transparent band is the atmospheric window, outside the wavenumber range where CO2 absorbs radiation. Therefore, the window part is not affected by any increase in CO2 concentration. However, as we know and have seen, Earth’s surface temperature increases when the Earth-atmosphere system attains equilibrium after a CO2 increase.
We have the result that the atmospheric surface temperature increases whereas the TOA temperature decreases. Then, the atmospheric temperature profile T(h) in the window-grey radiation model must have a crossover at some height hc where the absorption increase leads to heating below and cooling above. This crossover altitude one may interpret as the altitude from the troposphere to the stratosphere based on the discussion in Part XV (GEO ExPro Vol. 19, No. 2): increased concentrations of CO2 are warming Earth’s surface and troposphere while cooling the mid to upper atmosphere.
In Figure 4 (right) we display the window-grey temperature profiles for the selected parameters given above. The crossover point is hc =1-δ/2 (Goessling and Bathiany, 2016).
In summary, we see that the window-grey model accounts for temperature cooling in the mid to upper atmosphere when the absorption factor is increased. The lower atmosphere experiences warming as in the grey model.
* Lasse Amundsen is a full-time employee of Equinor.
References
References
Goessling, H.F. and Bathiany, S. 2016. Why CO2 cools the middle atmosphere – a consolidating model perspective. Earth System Dynamics, 7, pp.697–715.
Further Reading in the ‘Recent Advances in Climate Change Research’ Series
Recent Advances in Climate Change Research: Part I – Blackbody Radiation and Milankovic Cycles
Martin Landrø and Lasse Amundsen, NTNU / Bivrost Geo
Geoscience will probably play an important role in mitigating carbon dioxide emissions. In part one of this series, we discuss some history and physics behind the topic of climate change including the concepts behind blackbody radiation and Millankovic Cycles.
This article appeared in Vol. 16, No. 2 – 2019
Recent Advances in Climate Change Research: Part II – Arrhenius and Blackbody Radiation
Martin Landrø and Lasse Amundsen, NTNU / Bivrost Geo
In Part II we look at Arrhenius’ seminal 1896 paper and see how it relates to blackbody radiation and absorption of infrared radiation by the atmosphere, taking a closer look at his model of the greenhouse effect.
This article appeared in Vol. 16, No. 3 – 2019
Recent Advances in Climate Change Research: Part III – A Simple Greenhouse Model
Martin Landrø and Lasse Amundsen, NTNU/Bivrost Geo
What would the temperature of Earth be without the atmosphere? By using simple physical models for solar irradiation and the Stefan-Boltzmans law for blackbody radiation, we can estimate average temperatures with and without atmosphere.
This article appeared in Vol. 16, No. 4 – 2019
Recent Advances in Climate Change Research: Part IV – Challenges and Practical Issues of Carbon Capture & Storage
Martin Landrø, Lasse Amundsen and Philip Ringrose
The basic idea behind CCS (Carbon Capture and Storage) is simple, but what are the main challenges and practical issues preventing a more global adoption of this method?
This article appeared in Vol. 16, No. 5 – 2019
Recent Advances in Climate Change Research: Part V – Underground Storage of Carbon Dioxide
Eva K. Halland, Norwegian Petroleum Directorate. Series Editors: Martin Landrø and Lasse Amundsen, NTU/Bivrost Geo
By building on knowledge from the petroleum industry and experience of over 23 years of storing CO₂ in deep geological formations, we can make a new value chain and a business model for carbon capture and storage (CCS) in the North Sea Basin.
This article appeared in Vol. 16, No. 6 – 2019
Recent Advances in Climate Change Research: Part VI – More on the Simple Greenhouse Model
Lasse Amundsen and Martin Landrø, NTNU/Bivrost Geo
We continue the discussion of the simple greenhouse model introduced in Part III.
This article appeared in Vol. 17, No. 1 – 2020
Recent Advances in Climate Change Research: Part VII – Arrhenius’ Greenhouse Rule for Carbon Dioxide
Lasse Amundsen and Martin Landrø, NTNU/Bivrost Geo
Here, we investigate the relationship between radiative forcing (heat warming) of carbon dioxide and its concentration in the atmosphere to better understand climate feedback and sensitivity.
This article appeared in Vol. 17, No. 2 – 2020
Recent Advances in Climate Change Research: Part VIII – How Carbon Dioxide Absorbs Earth’s IR Radiation
Lasse Amundsen and Martin Landrø, NTNU/Bivrost Geo
Skydive with us into the quantum world and find out how carbon dioxide molecules absorb thermal IR radiation.
This article appeared in Vol. 17, No. 3 – 2020
Recent Advances in Climate Change Research: Part IX – How Carbon Dioxide Emits IR Photons
Lasse Amundsen* and Martin Landrø, NTNU/Bivrost Geo
Skydive with us into the quantum world, where we provide to those unafraid of molecular energy transfer an answer to the question: what happens to Earth’s radiated infrared (IR) photons after they are absorbed by IR active CO₂ molecules in the lower atmosphere?
This article appeared in Vol. 17, No. 4 – 2020
Recent Advances in Climate Change Research: Part X – How Quickly Does Atmospheric CO₂ Mix into the Ocean and Biosphere?
Lasse Amundsen* and Martin Landrø, NTNU/Bivrost Geo
In this article, we revisit unique radiocarbon data from the 90s and discuss briefly why this is of importance to our understanding of how CO₂ is circulating between the atmosphere, biosphere, and the oceans.
This article appeared in Vol. 17, No. 6 – 2020
Recent Advances in Climate Change Research: Part XI – How Earth’s IR Photons are Transferred in the Atmosphere in the Presence of CO₂
Lasse Amundsen* and Martin Landrø, NTNU/Bivrost Geo
Skydive with us into the quantum world and find out how Earth’s IR radiation is transferred in a plane-parallel troposphere in the presence of CO₂ molecules.
This article appeared in Vol. 18, No. 1 – 2021
Recent Advances in Climate Change Research: Part XII – Model for Radiative Transfer of Fluxes in the Temperature-stratified Atmosphere Technology (pp60-62)
Lasse Amundsen* and Martin Landrø, NTNU/Bivrost Geo
This article appeared in Vol. 18, No. 2 – 2021
Recent Advances in Climate Change Research: Part XIII – The Temperature Profile in a Grey Atmosphere (p70-73)
Lasse Amundsen* and Martin Landrø, NTNU/Bivrost Geo
This article appeared in Vol. 18, No. 1 – 2021
Recent Advances in Climate Change Research: Part XIV – The Doom of a Photon on a Random Walk
Lasse Amundsen* and Martin Landrø, NTNU/Bivrost Geo
The history of an individual infrared photon being emitted upwards from Earth’s surface into a static atmosphere is analysed as a one-dimensional random walk. Will it return to Earth, or depart into outer space, or will it stay in the atmosphere forever?
This article appeared in Vol. 19, No. 1 – 2022
Recent Advances in Climate Change Research: Part XV – A Greenhouse Model for Stratospheric Cooling
Lasse Amundsen* and Martin Landrø, NTNU/Bivrost Geo
Stratospheric cooling is considered to be one of the fingerprints of anthropogenic global warming. In this article, we present observations.
This article appeared in Vol. 19, No. 2 – 2022