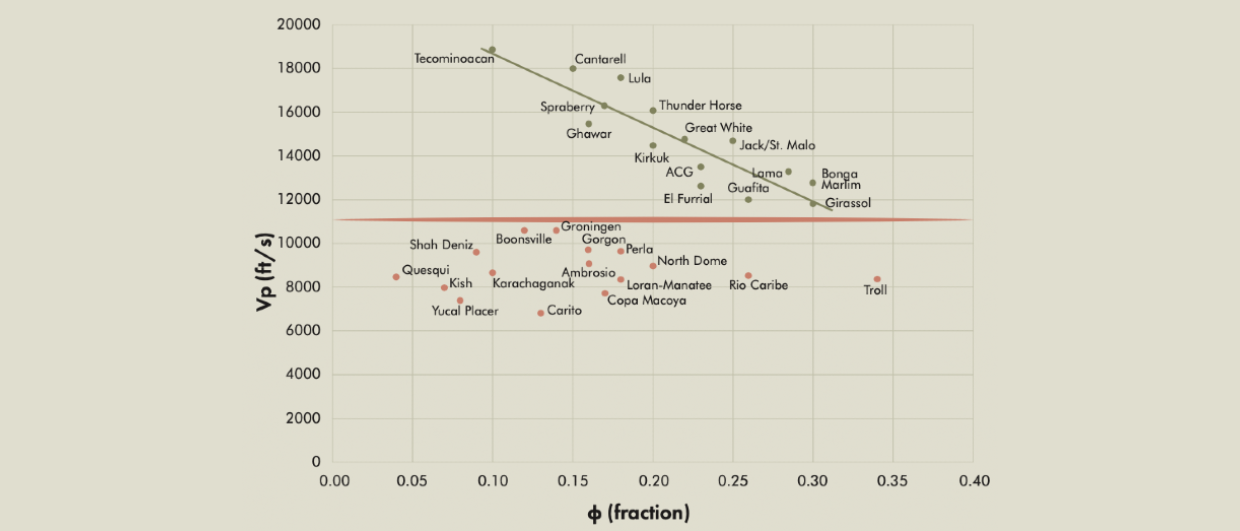
In a recent GEO EXPRO article, we developed a field-based approach to identify natural gas prospects directly from seismic surveys. The gas fields are straight up. If the p-wave velocities (Vp) calculated from the seismic are below 11,000 ft/s, gas is the option. Reservoir fluid saturated rock Vp values greater than this gas threshold indicate liquids, oil or water, both of which have similar Vp values. The explorationist’s enigma is how to distinguish the ones that contain oil.
The purpose of this study is to develop a method that could identify an oil prospect directly from the seismic. Our approach is to determine the rock’s water saturation by analyzing the behaviour of 20 major oil fields around the world. Water saturation is an important reservoir parameter that determines reserves and well productivities.
Morris and Biggs (1967) developed the following proven equation that relates permeability (k), porosity (Ø) and irreducible water saturation in sandstones.
Swirr = C x Ø3 /k1/2
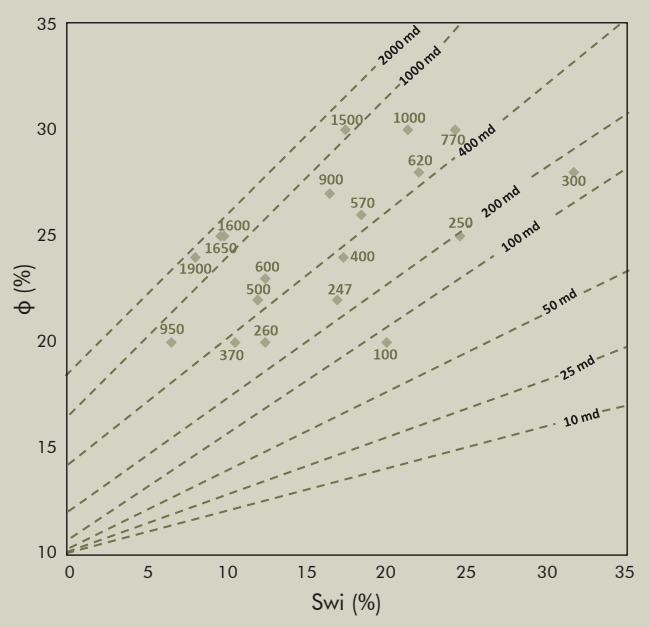
C is a constant whose value depends on the density of the hydrocarbons in the formation. C is 250 for medium gravity oils, and C = 79 for dry gas at shallow depths. The irreducible water saturation, Swirr, is a laboratory-obtained value calculated from capillary pressure data on cores; its value is normally less than the reservoir’s initial water saturation, Swi, when the field is first discovered. Swi is also known as connate water saturation and is the value used to calculate the STOIP of oil fields. Figure 1 shows the above algorithm as a graphical expression for oil fields.
We expanded the database of Morris and Biggs´ work, using laboratory data obtained from a number of giants and world-class oil-producing fields, concentrating in the usual producing sandstone range of porosities (10 – 35 %), irreducible water saturations (0 – 35 %), and the corresponding range of absolute permeabilities (10 – 2,000 mD).
As part of the same project, a comprehensive review of the permeability–porosity–water saturation data was undertaken to determine the relationship of the pore size distribution to the resulting permeability values. The result of this ‘expanded’ database in the range of values of interest for producing sandstones and shaly sandstones is shown in Figure 1.
Mechanistic review for the leap from Swirr to Swi
As part of the in-depth review, three major aspects were reviewed to ‘scale’ the Morris and Biggs approach (laboratory core data) to the physical conditions in oil reservoirs when they are first discovered and after development. The three aspects reviewed extensively were; the difference in linear pressure gradients overcoming the capillary forces, the difference in time-scale, and finally mercury displacing water in the lab versus migrating oil displacing water from a sand originally 100 % saturated by water until the ‘reduced’ water saturation values we find today – Swi.
After these three considerations, there is no doubt that the k–Ø–Swirr laboratory concept can be scaled to the oilfields as we now find them, where Swi is the result from the migration into the trap, under the real geologic and timeframe conditions. It should be no surprise that Swi must be higher than Swirr, as the latter would be obtained in the laboratory. Therefore, for this project, and from here onwards, we shift to the approach where Swi in today’s oil reservoirs substitutes the Swirr concept.
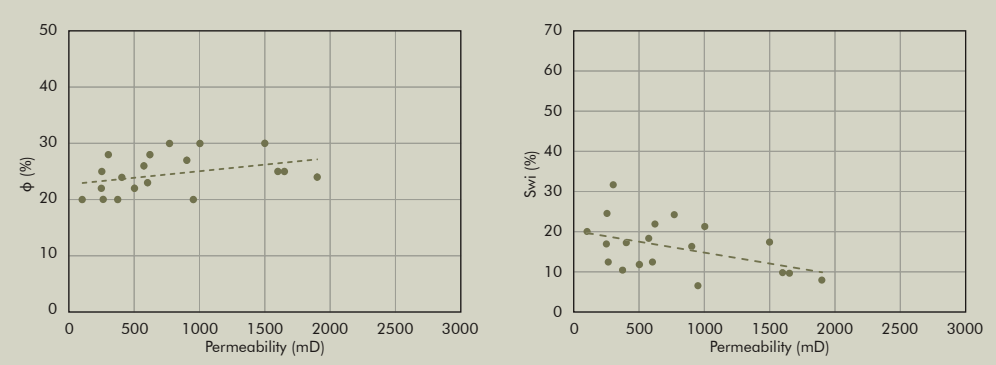
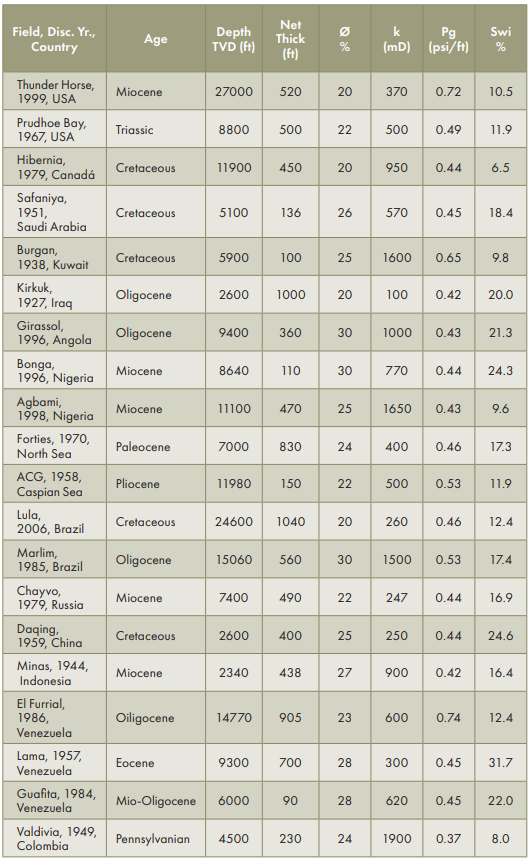
As a next step, the above-mentioned equation was used to calculate the ‘Swirr’ values – now corresponding to Swi at initial !eld conditions – for the 20 giant and world-class sandstone oil fields of this study, using their listed average reservoir porosity and permeability values. These field values, with their permeabilities highlighted, are displayed as orange dots in Figure 1 and are listed in Table 1, which also includes other relevant geologic and reservoir attributes of the selected fields. The Swi values range from 6 to 32 %, in the typical range for most oil reservoirs that extend to 37 %. We can safely assume that Swi values below a conservative level of 40 % would be comparable to oil-saturated reservoir rocks.
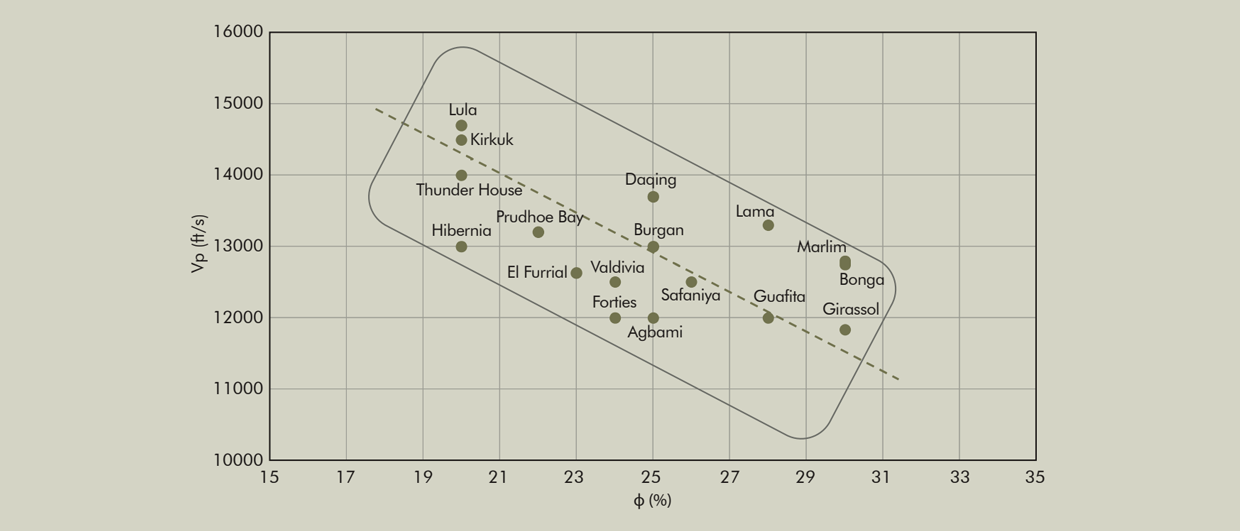
Let us now look at a 2D plot of the parameters in the studied equation. Figure 2 shows a strong correlation between permeability and porosity for the oil fields in this study. Figure 3 shows the relationship between Swi and permeability for the oil !elds in this study. As expected, the lower the permeability the higher the initial water saturation. Work by Amado provides a similar correlation for oil fields with a wide range of Swi and permeability values corresponding to Mid Miocene and Lower Pliocene sands in the deepwater Gulf of Mexico (GOM). The GOM trend also indicates a similar Swi threshold – below 40 % – for the majority of its oil reservoirs.
Estimating Swi with seismic data
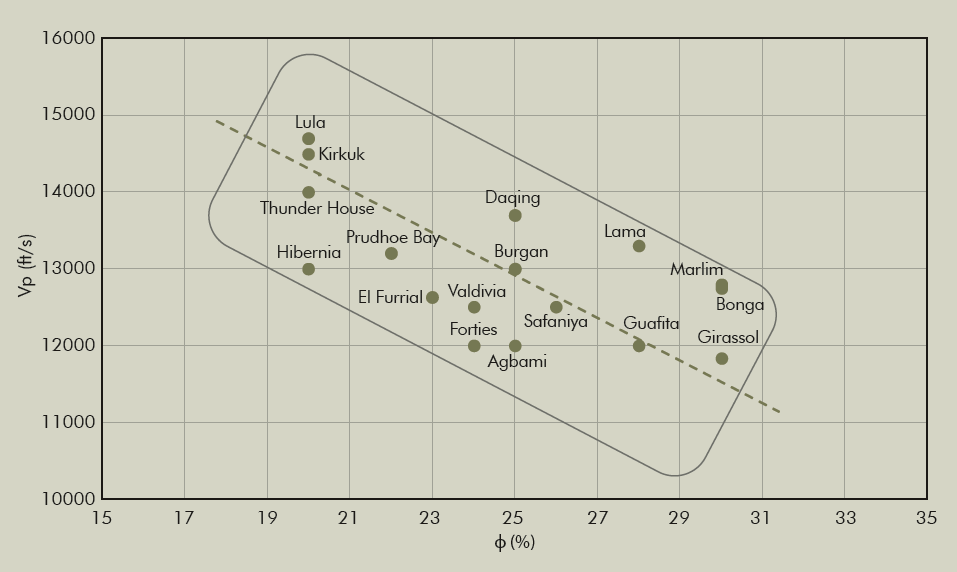
The Morris and Biggs algorithm has been demonstrated to be a suitable model to determine Swi, which is the key factor to determine oil in a reservoir rock. The model requires two parameters: Permeability and porosity. The Vp–porosity relationship is distinct, as demonstrated by Schon’s correlation for 75 shaly sandstone cores of varying clay content. The porosity values obtained from this correlation, Figure 4, then yield corresponding permeability values using Figure 2. Therefore, all of the requirements for an estimate of Swi for the prospect are now in place: It all begins with a reliable Vp value from the seismic, Figure 4.
On that basis, we now have an effective approach for early identification of oil in a prospect, based on Swi values calculated from seismic velocities.
Swi values of less than 40 % are indicative of oil. It reduces drilling risk, which is advantageous for costly offshore drilling, and it is a great tool
to fill the simulator as the new discovery is being appraised and developed.
Acknowledgment
We recognize the support received from Yeni Ferreira in handling and processing the data.