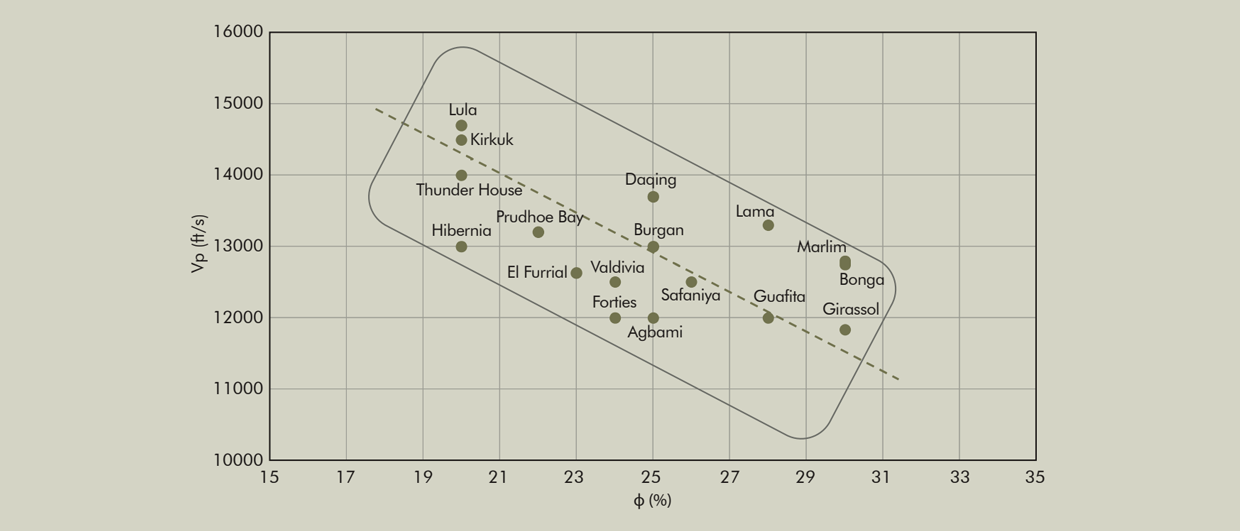
Figure 1: Vp vs Porosity – Big Oil and Gas Fields.
Seismic velocity – A strong identifier of gas prospects
Using a dataset of major oil and gas fields across the globe, the authors demonstrate that Vp is a powerful tool to differentiate between oil and gas-filled traps, which helps de-risk future drilling targets.
P-wave velocity (Vp) is an essential parameter for constructing seismic velocity models for geophysical exploration data, and porosity is the single most important factor affecting it, along with the type of pore fluids.
Until recently, seismic velocity was only used for migrating seismic data and time-depth conversion. However, with recent new technologies like Full Waveform Inversion (FWI), the accuracy of the velocity data has improved. This advance now should provide an opportunity to estimate dependable key reservoir characteristics and at the same time detect any gas traps or accumulations from the seismic survey.
Here, we focus on analysing Vp to identify gas accumulations during the early exploration phase, prior to spudding the first well, when only seismic data is available. One of the driving forces for this project was the consideration of the future role of natural gas in a global context.
For this analysis, our approach was to analyse field seismic data, in particular Vp values, from randomly selected conventional gas fields around the world. We used P-wave velocity data available in the public domain and referred to as the velocity over the whole sedimentary hydrocarbon interval of the field. We looked at 32 oil and gas fields from 16 countries; most are giants, and the others are qualitatively world-class (Table 1).
Is the Vp vs porosity relationship all purpose?
The first step in our analysis centers around verification of the Vp vs porosity relationship, which is well established at the experimental level and also at the multi-layer level of individual oil fields (Table 1). Here, we take it to another level and examine directly the Vp – porosity relationship at several major oil fields across the globe. Theory and lab testing can only take you so far.
Figure 1 demonstrates a strong and characteristic correlation between the two parameters (blue). This field bond is especially important because it fundamentally integrates all multiple minor and major factors – lithology, depth, rock characteristics, pore fluids, pore-pressure gradients and others – that affect it in different ways.
The gas effect
With the basic background information provided above, we can now guide our analysis on the road to the gas reservoirs – do they affect the rock-solid Vp vs porosity relationship for gas fields?
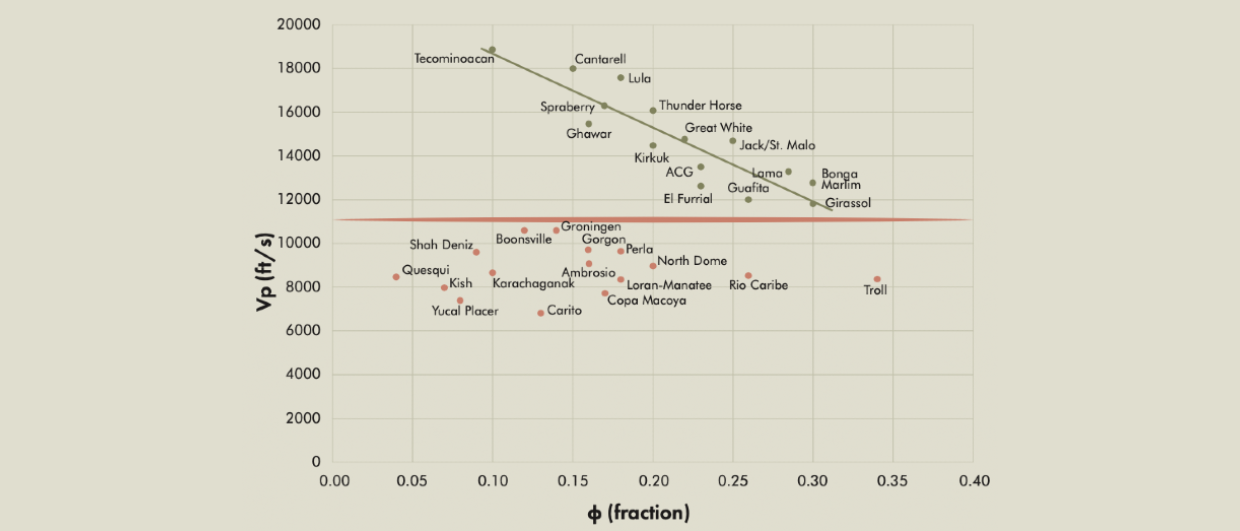
Figure 1 also illustrates the basic Vp-porosity relationship for gas (red) fields in this study. Broadly, a Vp tier of 11,000 ft/s seems to be the dividing line between oil and gas fields. It represents the upper domain of gas fields and the ground value for oil fields.
This indicates a huge gap of around 2 to 1 between Vp values of oil and gas fields. Perhaps the most striking of the field results is the high dispersion of gas field data points. Unlike the rock-solid trendline consistency noted for oil fields, there is no clear trend for gas fields. Obviously, the extreme compressibility and low density of gas seem to be overcoming the major influence of porosity on Vp.

Some general observations
From the above discussion and the different issues brought up, some “broad” statements follow.
From Figure 1, there is no question that regardless of the different factors outlined, there appears to be a very solid correlation between Vp and porosity, over a very wide range of porosity values and porosity-types, when the existing rock plus fluid system is non-gaseous i.e. contains a liquid in the pore space. Further, the slope of the correlation line obtained is to be expected, since the lower porosity systems contain basically more of the solid part, which will transmit the seismic wave at a higher velocity. For those systems with a higher porosity, filled with liquids (oil and water), the impact of the attenuation caused by the liquid part of the rock-pore filled system is evident.
Further, for this large group of oil (liquid containing) consolidated reservoirs, in the wide range 10-30 % porosity values, the seismic Vp values are definitely above 11,000 ft/s.
When the porous system is not liquid but rather gas-dominated, a different condition is to be expected, as follows.
From Figure 1, the interval seismic velocity measured and reported in a significant group of reservoirs containing free-gas is definitively below 11,000 ft/s. Thus, in the gas reservoirs – over a wide range of porosities – the data indicate the expected Vp attenuation induced by the gaseous nature of the contained fluid. However, the clear correlation of Vp versus porosity described for oil reservoirs is not as evident for gas reservoirs. It thus appears that the attenuation of the seismic velocity induced by the gaseous phase is sizeable enough to impact the Vp level over the same porosity range (10-30%).
As a matter of fact, in spite of the spread in interval velocity Vp values in the 6,500 to 11,000 ft/s range, the “average” typical level is close to 9,000 ft/s. This is certainly a low enough average level to allow the use of Vp from seismic as a solid discriminator for gas-containing accumulations, when in search for this hydrocarbon fluid as opposed to oil-containing accumulations.
An inexpensive tool
In the field, the presence of any kind of natural gas, such as free gas or gas caps, affects radically Vp values above and beyond the effects of a broad spectrum of parameters and attributes. Low Vp values – below 11,000 ft/s – alone are not diagnostic of gas-bearing sands but are definitely significantly lower, by a factor of almost 2 to 1, than values for oil and/or water-saturated sands and salt layers. If the Vp is below 11,000 ft/s, that red light for gas should be used as a decision support tool. It is a powerful, inexpensive early identifier of gas during the early exploration phase when only seismic data is available.