Borehole Gravity for Reservoir Monitoring
A shiny, one-inch round, miniature gravity meter is providing key bits of information about the distribution of pore fluids for reservoir monitoring. High-resolution borehole gravity measurements are now possible in deep, hot, small diameter wells of nearly all orientations, including horizontal wells.
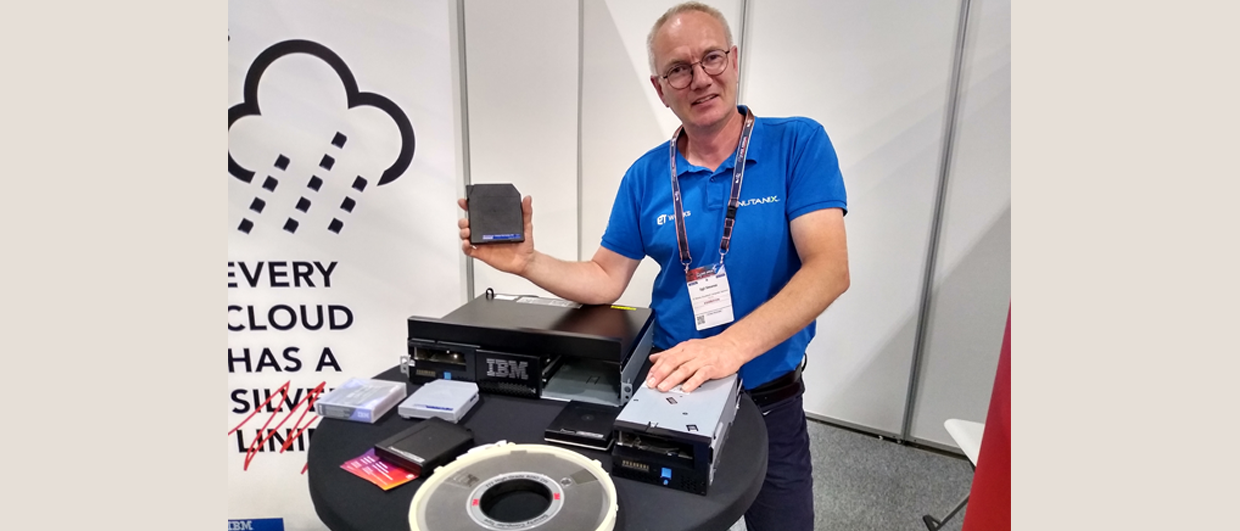
The latest generation borehole gravity sensors are smaller than a golf ball and operate in cased and uncased wells less than 3 inches in diameter. (Source: Micro-g LaCoste)
Many of the most pressing needs for gravity surveying in the O&G industry are for monitoring very small, time-variable density changes for enhanced oil recovery (EOR), carbon storage and hazard mitigation. High-resolution borehole gravity measurements are now possible in smaller diameter and more highly deviated wells (including horizontal wells) than ever before. Following suit with land gravity surveying, the borehole gravity (BHG) method routinely achieves 5 μGal or better repeatability – significantly expanding the applications of this ‘old-school’ survey technique for monitoring applications. The recent modifications provide an opportunity for implementation of the technology on advanced oil and gas operations with cutting-edge results.
Carbon dioxide storage, steam-assisted gravity drainage (SAGD), and other types of EOR operations can benefit from borehole gravity because the method is sensitive to the mass and bulk density changes caused by pore fluid exchanges relatively far from the borehole. In addition, the method works through casing. Time-lapse borehole data can also be combined with time-lapse surface data, where feasible, providing a comprehensive sampling of changes in gravity occurring both near and distal from the source (e.g., Krahenbuhl and Li, 2012).
A major distinction exists between single time-epoch gravity surveys, where the goal is to recover absolute earth densities and density distributions, and time-lapse (or 4D) gravity surveys where we wish to recover density changes over time. While the local gravity field is caused by the overall geologic structure and characteristics for a considerable distance around a well, the difference signal between consecutive, time-lapse gravity surveys is only related to the changes in the fluid density distribution within the pore space between logging epochs. Time-lapse surveying allows us to detect rock fluid changes that are 100 to 1,000 times smaller than the normal background gravity variations that dominate single-epoch surveys.
It’s All About Delta Density
Figure 1b: Simulated, time-lapse borehole gravity signals in Wells 1, 2 and 3 in Figure 1a. (Source: Courtesy of Micro-g LaCoste)
The basic premise of gravity surveying is that gravity measurements are sensitive to mass and density distributions in the earth. For time-lapse gravity surveys, it is the change in bulk formation density that is detected: this is due primarily to pore fluids changing saturation and/or replacing or mixing with other fluids.
As an example, consider carbon dioxide (CO2). The density of CO2 varies greatly from the near-surface, where it is a low density gas, to depths greater than about 1 km, where it is a super-critical fluid with a density of about 0.6 g/cm3 or greater. In some scenarios, such as carbon dioxide invasion into shallow/near-surface aquifers, we expect increasingly negative gravity and bulk density anomalies over time, as low density CO2 replaces higher density in-situ water.
Another example where we expect increasingly negative gravity anomalies is steam injection into shallow reservoirs. In this scenario, the delta density is also increasingly negative over time. Figure 1a (below) shows a density model of a SAGD reservoir simulation showing steam chambers developing along a group of linear-trending, horizontal injection wells. Borehole gravity combined with surface gravity in this case provides an excellent, 3D spatial sampling of the gravity field from which steam chamber development can be monitored. The forward-modeled borehole gravity signals for this model are shown in Figure 1b (opposite).
Figure 1a: A time-lapse reservoir model for an early-stage, steam injection scenario. The developing steam chambers have a density contrast of about -0.3 g/cm3 with the surrounding reservoir in this model. (Source: Micro-g LaCoste)
In some scenarios, we expect densities to increase over time as net mass is added to the reservoir. The borehole gravity method was tested in a late-stage, pinnacle reef reservoir (Dover 33) at about 5,400 ft (1,650m) depth (Cumming, et al., 2017). The survey goal was to assess the capability of the technology for monitoring carbon dioxide movement and storage within a closed reef structure (Figure 2). Two BHG surveys were performed in the CO2 injection well to generate time-lapse data: a baseline survey was performed in 2013 while the reef was in a depleted, low-pressure condition (600 psi), and a repeat survey was conducted in 2016 after injection of 265,000 metric tons of CO2 into the reef and pressures had increased to 3,500 psi.
Figure 2: Side view of the Dover 33 reef with locations of the deep zone borehole gravity stations. (Source: Courtesy of Core Energy, Battelle Memorial Institute and Micro-g LaCoste)
In the deep reservoir zone, the gravity difference between the year 2013 and year 2016 surveys in the Dover 33 well clearly showed a broad, approximately 90 μGal, positive, time-lapse anomaly above the Niagaran Brown (NB) formation that decreased downward through the reef (Figure 3). The largest BHG density change was in the upper 40 ft (12m) of the Niagaran Brown, where a BHG density change of about 0.04 ± 0.01 g/cm3 was indicated. The survey results showed that dense-phase carbon dioxide liquid had filled the pore space previously occupied by low-density natural gas and had increased the density in a portion of the reef where porosity was generally greatest. The data also showed that the injected carbon dioxide had been contained within the reef.
Figure 3: Time-lapse borehole gravity survey results in the Dover 33 well. Left: Observed time-lapse gravity difference (2016 –2013). Right: Computed time-lapse BHG densities. OWC= oil water contact; NB= Niagaran Brown (reservoir); A1C= A1 Carbonate (reservoir); A2A= Anhydrite (seal). The well perforations are from 5,309 to 5,460 ft.
Another time-lapse survey is currently underway in a carbon capture and storage project in Illinois, USA, where captured CO2 will be stored in a deep, sealed, saline aquifer. The first borehole gravity survey, completed in early 2017, served as the baseline – the results are shown in Figure 4, below. Note that the BHG densities are somewhat smoother and slightly higher, in general, than the RHOZ (gamma-gamma log-based density estimates). This is because BHG is a deep-sensing, density logging method and is not subject to low-density biases due to washouts and other formation disruptions near the wellbore. Examination of the Caliper and Standoff RHOZ correction logs, in this case, showed significant kicks in areas where the RHOZ and BHG densities differed the most.
Figure 4: BHG densities (blue) and RHOZ densities (pink, red) from a CO2 storage well in Illinois, USA. (Source: Courtesy of Archer Daniels Midland and Micro-g LaCoste)
The Method Explained
Modern gravimeters measure changes in gravity with μGal precision, or about 1 part per billion of gravity (g) (~10-8 m/s2). The latest generation of borehole tools are relative gravity meters using miniaturized, highly specialized spring sensors housed in an approximately 2½-inch diameter tool. Developed in the 2000s, the new borehole gravity meters incorporate key improvements related to accuracy, reliability, calibration, orientation, tool diameter and positioning over older generation BHG tools that were developed by LaCoste and Romberg in the 1970s (Nind, et al., 2007).
Survey crew assembling the borehole gravity tool. (Source: Micro-g LaCoste)
BHG measurements are made at discrete depth intervals, or ‘stations’ in a borehole. Gravity (Δg) and depth (Δz) differences between successive stations constitute the interval vertical gradient of gravity which varies directly with the density of the rock layer bracketed by the measurement stations. The classical BHG density is the density of an infinite, horizontal slab of thickness, Δz, that is required to produce the difference in the two gravity measurements, Δg. BHG density is an apparent density – an incredibly powerful computed rock parameter, similar to the concept of apparent resistivity, which is computed from electrical and electromagnetic surveys.
Raw BHG measurements are corrected for tides, ocean loading, sensor temperature, tilt, and for small depth differences between station repeats (within a single survey) and sensor drift. Typically, to obtain the highest accuracy, each survey includes three passes through the zone of interest, repeating either a subset or all of the stations. The corrected, observed gravity data are then converted to BHG densities.
For monitoring, the ability to return to the same depth for comparison of gravity changes over time is important. A combination of natural gamma ray and high-resolution casing collar locator tools, which are integral parts of the BHG tool assemblage, provide depth control to 1 cm within cased holes. BHG data can be acquired and tied from the surface to depths of 3 km or more (depending on the ambient well temperature and pressure).
As a general rule, the radial volume of rock sampled by BHG measurements is about five times the downhole station spacing (in a vertical well). BHG density errors are proportional to gravity measurement errors and inversely proportional to the vertical station spacing. Assuming 3.5 μGal measurement error, we can estimate BHG density for a single survey epoch to 0.003 to 0.007 g/cm3, given typical reservoir monitoring station intervals of 6 or 3m, respectively. For highly deviated wells, BHG densities are best estimated by inversion methods that utilize the full set of every station combination (MacQueen, 2007).
The Real Magic – Better Results in a Smaller Package
It has long been recognized that the borehole gravity method can provide key information critical to the successful characterization of reservoirs and to the successful monitoring of reservoir dynamics (e.g., Rasmussen, 1975; Popta et al., 1990; Hare and Black, 2015). However, the practical application of the method to monitoring has been severely limited by the older generation, large-diameter tools that could only operate in vertical wells. Recent improvements in the technology are finally propelling borehole gravity monitoring into the realm of common practice.
References
Cumming, L., Place, M., Hare, J., Black, A., Gupta, N., Modroo, A., and Pardini, R., 2017, Field testing the applicability of borehole gravity for monitoring geologic storage of CO2 within closed carbonate reef reservoirs, Poster presentation for the IEAGHG Monitoring Network Meeting, June 13-15, 2017, Traverse City, Michigan.
Hare, J. and Black, A., 2015, Evolution of microgravity surveys for reservoir monitoring, Monitoring giant carbonate fields: Fad or future, Exp. Abstr., SEG/SPE Workshop, Abu Dhabi, UAE.
Krahenbuhl, R. and Li, Y., 2012, Time-lapse gravity: A numerical demonstration using robust inversion and joint interpretation of 4D surface and borehole data: Geophysics, 77, no. 2, G33-G43.
MacQueen, J. D., 2007, High-resolution density from borehole gravity data, Exp. Abstr., 77th Annual International Meeting, San Antonio, Texas.
Nind, C., Seigel, H. O., Chouteau, M., and Giroux, B., 2007, Development of a borehole gravimeter for mining applications: First Break, 25, 71-77.
Popta, J.V., Heywood, J., Adams, S., and Bostock, D., 1990, Use of borehole gravity for reservoir characterization and fluid saturation monitoring: SPE European Petroleum Conference, 151-160.
Rasmussen, F., 1975, The successful use of the borehole gravity meter in northern Michigan: The Log Analyst (SPWLA), 16, no. 5, 3-10.