Canada: the Beaufort Sea deep crustal imaging
The Canadian portion of the Beaufort Sea has been the site of intense interest and bidding in recent licensing rounds. Regional reconnaissance 2D seismic programs designed to image down to the base of the Earth’s crust are redefining frontier basin evaluation.
In June of 2008, BP Exploration Company spent a record $1.18 billion for a 202,380 hectare parcel in the Canadian Beaufort Sea north of Tuktoyaktuk, North West Territories. This surpassed the previous record of $585 million Imperial Oil and ExxonMobil Canada paid in 2007 for a 205,000 hectare exploration lease in the same area. Last year BP was awarded three leases covering 611,000 hectares. Two other leases were awarded in the same sale: a 41,000 hectare parcel was won by MGM Energy, ConocoPhillips Canada, and Phillips Petroleum Canada, while ConocoPhillips Canada won a 196,000 hectare lease.
The area is not new to leasing and exploration. Over 50 oil and gas discoveries have been made in the shallow waters of the Beaufort/Mackenzie delta area during the 1970s and 1980s with all of these still waiting development and transportation to markets.
Devon Energy drilled the first well in 15 years north of Canada’s mainland. Their Paktoa well was drilled over the 2005 and 2006 drilling seasons 180 km north of Inuvik, north-west Territories. In 2007, they announced it to be a major oil discovery with recoverable reserves estimated at 240MMbo.
More recently, MGM Energy Corporation announced a gas discovery 175 km northwest of Inuvik near the Beaufort Sea. Government estimates have the area containing a significant percentage of Canada’s conventional oil and gas. The Geological Survey of Canada estimated the mean undiscovered resources at 2.7MMm3 (16.8Bbo) inclusive of deep water (to 2,500 m) while the U.S. Geological Survey put a mean of 2.3MMm3 (14.5Bbo) and 2.32Tm3 (86.6Tcf; 15.6Bbo) gas in the basin in water depths less than 1,000 m.
Program design
New tools and new approaches in geoscience are needed to help oil and gas companies meet reserve and production targets. One new approach developed by ION Geophysical’s GX Technology group (GXT) has been to acquire geologically inspired and constrained programs know as SPANs. “SPANs are basin-wide, ultra-deep, 2D seismic data sets that are acquired and imaged using the most advanced geological and geophysical technology available,” says Joe Gagliardi, ION’s SPAN Program Director. “SPANs are custom designed to provide critical insight into the geologic evolution, deep basin architecture, deposition, and structural history of a petroleum system. The resulting data provides oil and gas companies with new information, insights, and prospect generation opportunities for under-explored or unexplored frontier basins. ION currently has 10 SPANs available and is in the detailed planning stage for additional programs worldwide.”
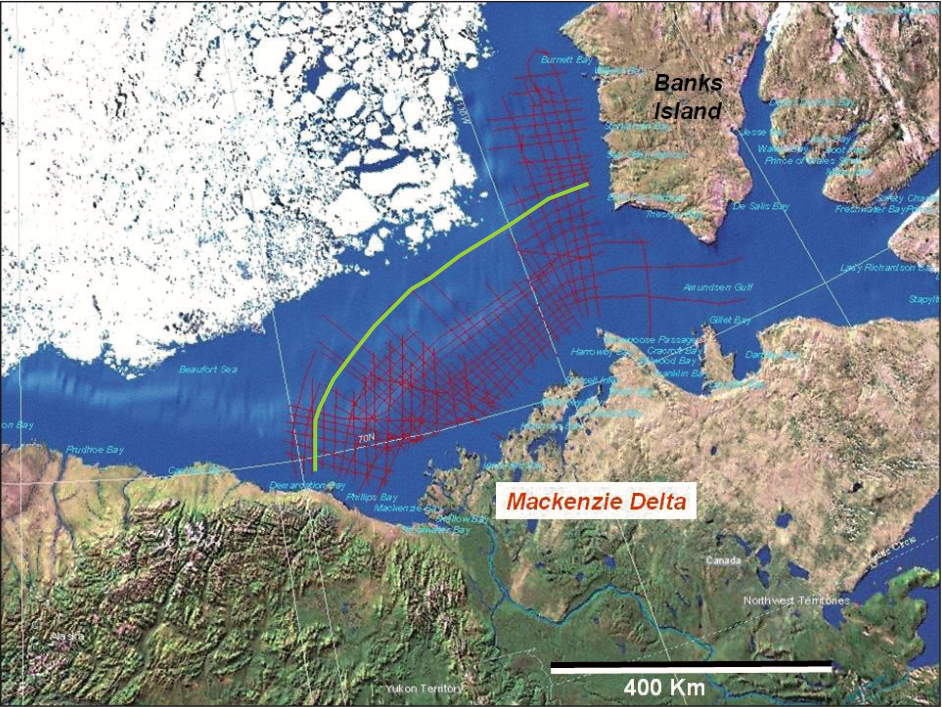
The line shown on this issue’s seismic foldout (pages 36-38) was part of one of the three season programs from 2006 to 2008 to gather 2D long-offset, reconnaissance seismic data in the Canadian Beaufort Sea. More than 16,000 km of data was collected in a geologically driven (oriented) grid along the continental margin, from the U.S. border traversing the Mackenzie Delta shelf and slope northeast to the Amundsen Gulf and Banks Island. Depending on ice conditions, the lines extend as far as possible offshore and into deep (over 2,000 m) water.
“The Arctic SPAN program is typical of our other Basin SPAN programs,” says Joe. “We designed this program to image down to the base of the crust with a 9 km long cable, 18 second recording and final depth processing (prestack depth migration) to 40 km. The seismic data are interpreted together with simultaneously collected gravity-magnetic data to regionally map the crustal continent-ocean boundary (COB) and the top of the MOHO discontinuity. The seismic data is tied to existing well data to identify the major stratigraphic sequences. This Beaufort survey was specifically designed to image the entire crust and basin architecture along with excellent seismic resolution within exploration depths (8 km).”
A key line
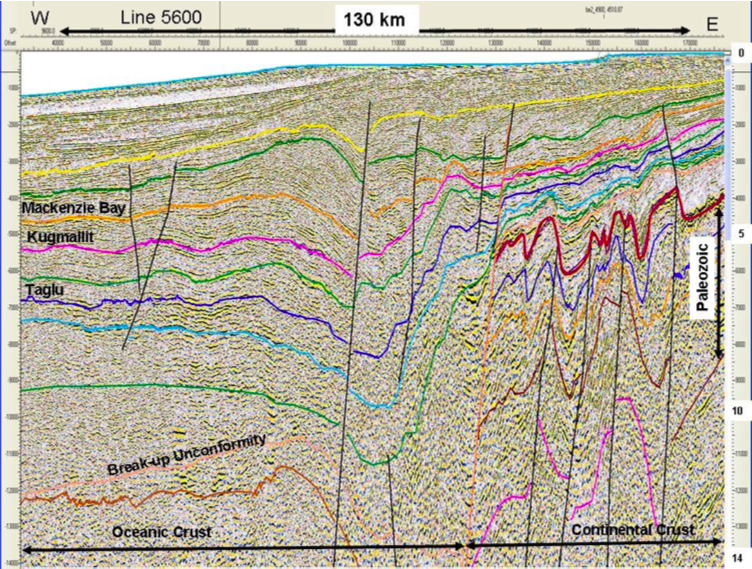
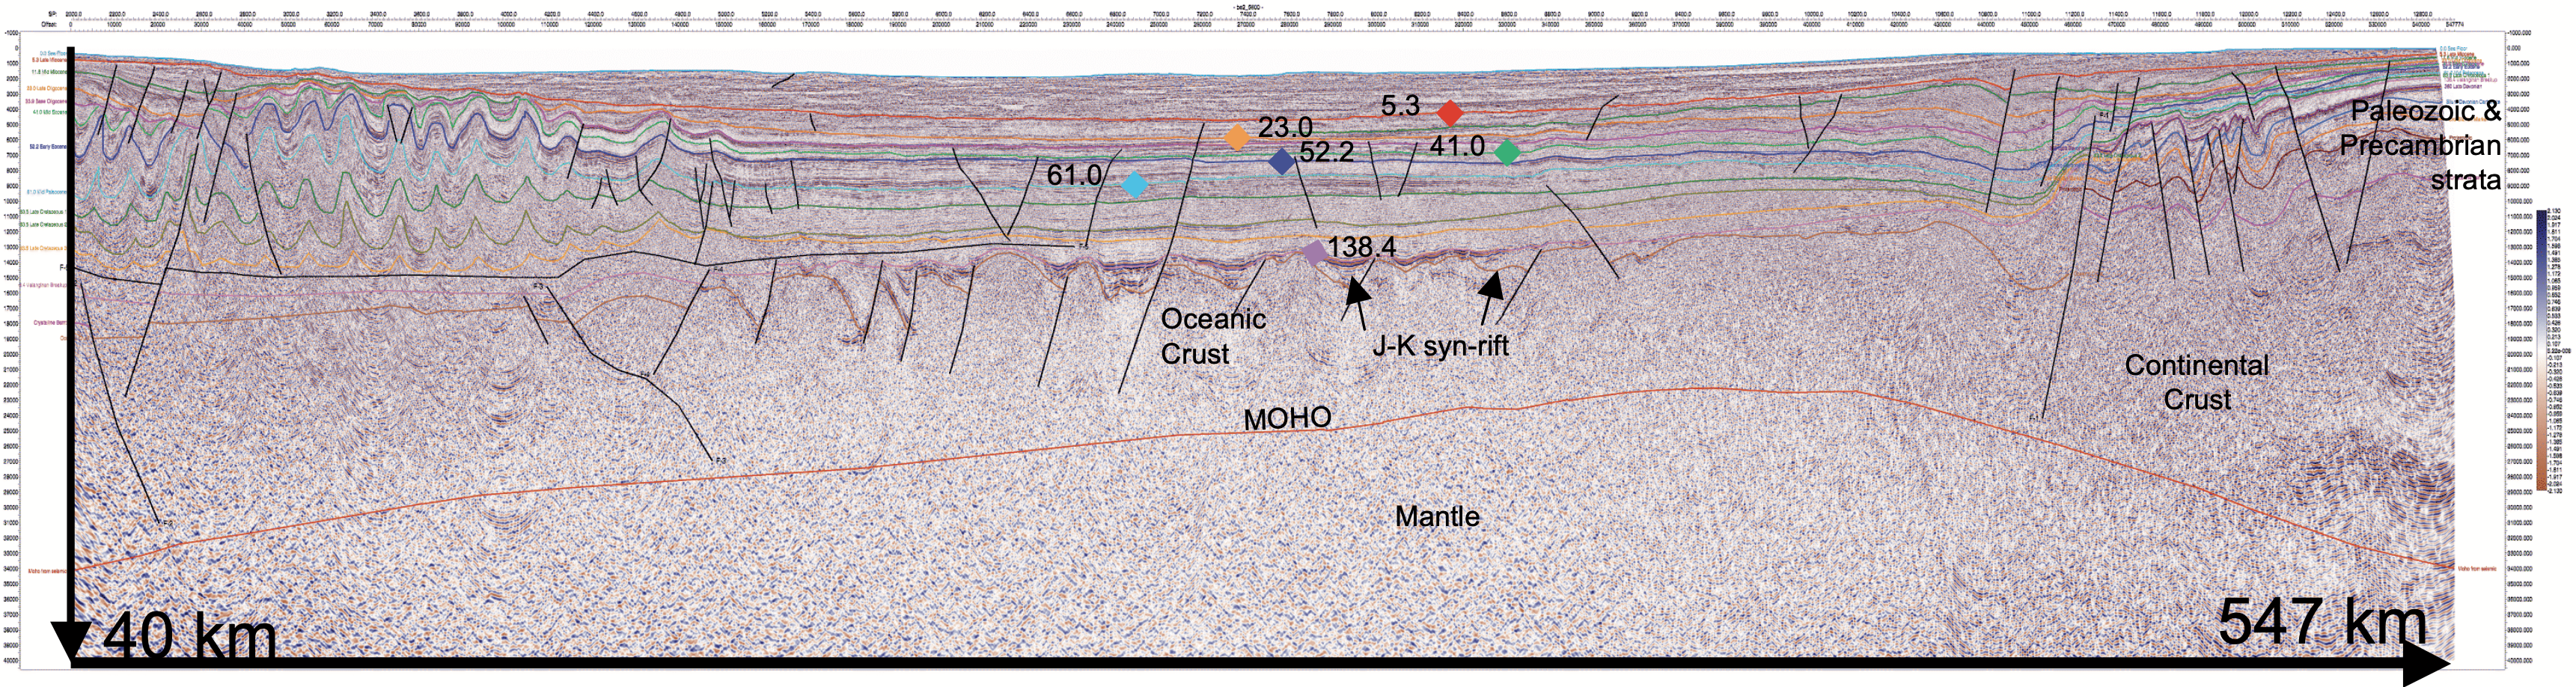
“The 547 km-long Line 5600 is the most seaward strike line in the Beaufort survey and the most dramatic, revealing the variable basin architecture in three distinct crustal domains,” says Dr. Menno Dinkelman, ION’s chief geologist. “The southwest end traverses the Beaufort fold and thrust belt of the highly prospective offshore Mackenzie Delta. The fold belt has a very deep (15 km) detachment zone overlying oceanic crust, including the inferred southward extension of the buried mid-ocean ridge beneath the deformation front. The central portion of the line is in deep water (>1,000 m) with flat lying sediments on oceanic crust. The eastern part of the line crosses the Continent-Ocean Boundary (COB) of the passive margin along the Banks Island shelf. This line also ties the entire 15+ km-thick Canada Basin Megasequence of Late Jurassic to Recent age from the area with well control in the south to the frontier exploration territory to the north at offshore Banks Island that has thus far not been penetrated by wells.”
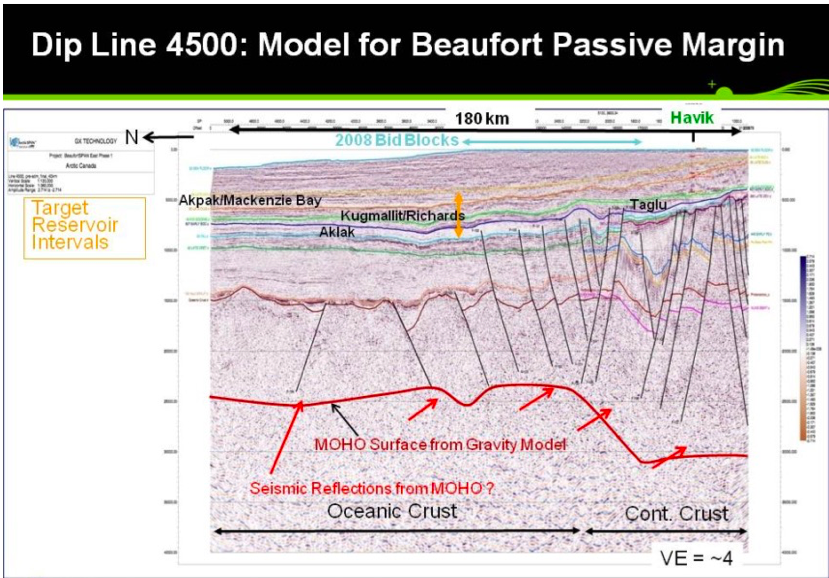
Passive margin
The central portion of Line 5600 shows the most important stratigraphic sequences designated by age. The Plio-Pleistocene sequence (0-5.3 Ma) is more than 3 km thick. Many intra-sequence unconformities, erosional, and truncation features are seen in the Miocene (23.0 Ma) and younger sediments seaward of the shelf edge onto the continental slope. The Valanginian (136.4 Ma) breakup unconformity syn-rift blocks, and the top of faulted, tilted blocks of oceanic crust are clearly shown.
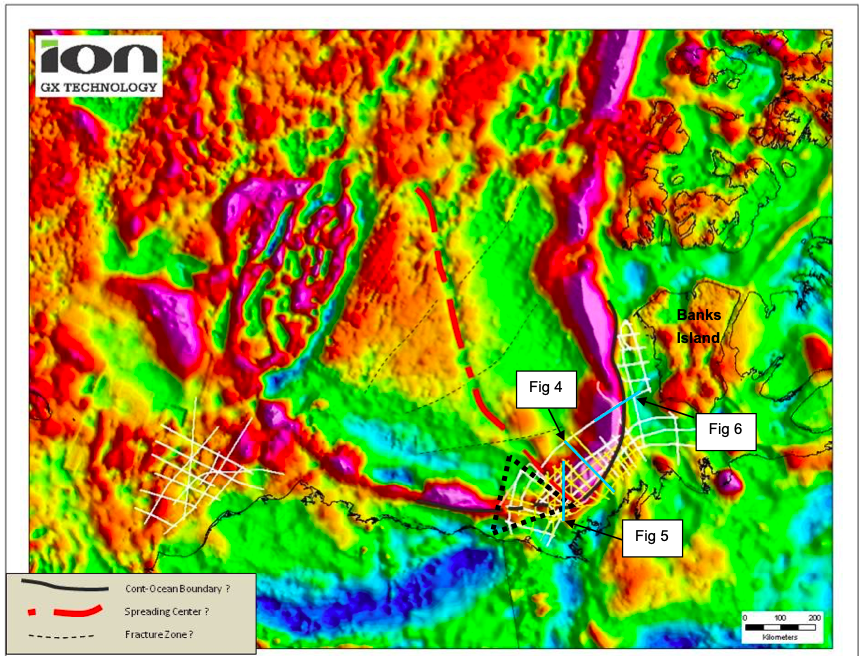
The opening history of the Canadian Basin has been debated for years. “Although many questions remain and need to be more fully investigated, as it stands now the SPAN data appear to support a rotational opening of the basin and an extension of the ‘paleo-spreading center’ to near the mouth of the Mackenzie River,” says Dr.Dinkelman.“We also have identified a passive margin boundary that extends along the Tuk Peninsula and Banks Island. The continuation into the Alaska Beaufort Sea is masked by the thickness of the Mackenzie suggest that a significant part of the delta is underlain by oceanic crust which appears to be more expansive than previously mapped.”
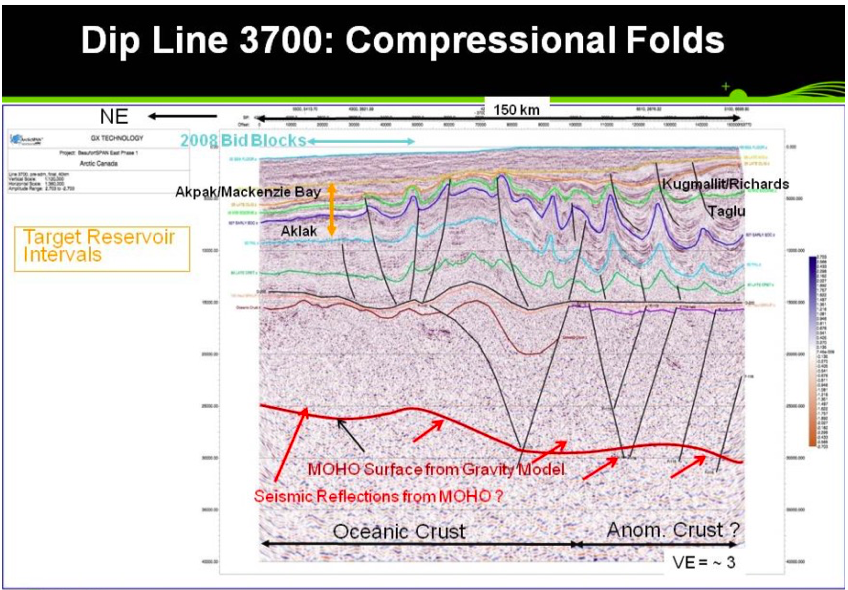
Beaufort foldbelt
The structural style changes on the south-eastern portion of Line 5600. Gravity sliding and Brooks Range compression in north-eastern Alaska have created folds and thrusts in the highly prospective offshore Beaufort Foldbelt. The master detachment level lies at approximately 15 km depths along the southern and western parts of the area. The well developed growth synclines between the green and pink reflectors (Late Eocene, 41-34 Ma) indicate the age of the main folding event. A younger, late-Tertiary compressional event caused the structural inversion, folded the detachment surface, and created a large structure at the shelf edge which extends into deeper waters.
“This inversion structure is located where we have postulated the presence of a now inactive spreading center under the delta sediments,” says Dr. Dinkelman.
Prospective eastern section
The eastern end of the line overlies continental crust. At the continental margin, high angle, basin-bounding faults separate the Paleozoic sequences mapped on the Canadian Arctic Islands from the oceanic crust and rift-sediments. This transition at the COB is interpreted as a major crustal fault.
“The Meso-Cenozoic stratigraphy is well imaged and attains a thickness in excess of 12km, ”says Dr.Dinkelman.“This is considerably thicker than previously thought would be the case with this offshore area being more than 300 km from the Mackenzie River sediment source. In addition, in the deeper waters offshore the southeastern edge of Banks Island, a major rollover feature is imaged in Late Cretaceous and younger sedimentary sequences along one of the major down-to-the-basin dipping faults seaward of the COB. The full extent of this feature has not yet been mapped but suggests hydrocarbon trapping possibilities along this boundary. The rollover is almost 30 km wide and has nearly 800 m of structural relief.”
Landward, the Paleozoic section is disrupted by down-to-the-basin faults. Depth to the MOHO is almost 30 km beneath the highly-reflective, lower continental crust near the termination of Line 5600.
“Whether dealing with exploration frontiers in the Arctic margins or synthesizing regional tectonics in established petroliferous provinces such as the Mackenzie Delta, these state-of-the-art deep seismic surveys provide thought provoking illumination of basin scale tectonics and crustal architecture,” Dr. Dinkelman concludes. “We have a firm foundation for basin analysis and assessment.”