An improved knowledge of fault systems is important in understanding Suriname’s onshore oil fields – and the application of FTG data can be a vital tool in unlocking this knowledge.
Suriname (Figure 1) is part of the Guiana Shield, which stretches between the Orinoco and the Amazon rivers and includes eastern Venezuela, Guyana, Suriname, French Guiana, and northern Brazil. Geologically, the onshore Surinamese territory is divided into exposed crystalline basement, principally igneous and metamorphic rocks (80%) and the coastal plain (20%), where the crystalline basement is covered by Upper Cretaceous to Holocene sediments, although only Pliocene to Holocene sediments can be found at the surface (Figure 2). The coastal plain is part of the larger Suriname-Guyana Sedimentary Basin, which encompasses the coastal area of French Guiana, Suriname and Guyana. Most of the basin lies offshore, where the sediment section becomes thicker as the basin deepens.
Three oilfields are present in the onshore area of Suriname, namely Tambaredjo, Calcutta and Tambaredjo Northwest. They produce from Paleocene, Eocene and Miocene reservoirs, which were deposited in a continental to shallow marine setting. The Tambaredjo oilfield has been in production since 1982. Close to 115 MMbo have been produced from these three oilfields with a remaining reserve of more than 87 MMbo. The current production from them is about 17,000 bopd.
Figure 2: The coastal plain of Suriname.
Onshore Stratigraphy
The sediments of the Suriname part of the Suriname-Guyana Basin are part of the Corantijn Group. Based on age data collected to date, the onshore sedimentary column comprises mainly clastic sediments from probably the Upper Cretaceous to the Holocene.
The regional dip and thickness of the total onshore sedimentary column is governed by the topography of the Precambrian basement. The Calcutta Uplift, located more or less in the center of the Suriname part of the basin, has had an effect on the sedimentary thickness and stratigraphy. The sediment package thickens east to west away from the Calcutta Uplift (Figure 3), with the thinnest sedimentary column on the Uplift itself. In a north-south direction the sedimentary column thickens northwards (Figure 4, below).
Figure 3: West–east 2D seismic cross-section with the fault-bounded Calcutta Uplift. (Source: Staatsolie, 2016)
The Cretaceous section consists of continental deposits with evidence of several cycles of exposure to erosion. The Tertiary section, by comparison, comprises coastal to shallow marine deposits, while Quaternary sediments are mainly composed of sand and shales with minor shell sand. The presence of hydrocarbons in the onshore are from Saramacca (Paleocene) to Coesewijne (Miocene) sands. The sedimentary facies of the Paleocene section changes laterally and is divided into the Saramacca, Alliance and Onverdacht Formation.
Figure 4: South-north stratigraphic cross-section. (Source: Staatsolie, 2016)
Structure and Plays
The total onshore sedimentary section was deposited during the Passive Margin Phase in the Late Cretaceous to Recent. The structure in the onshore area is dominated by basement-rooted faults, as can be observed on seismic data. Only minor tectonic activities occurred in this period along the margins of the Guiana Shield, including eastward movement of the Caribbean Plate in the Tertiary and the Miocene Andes Orogeny. Most of the faults in the onshore area terminate in the Eocene Upper Saramacca Formation, with some in the Miocene Coesewijne Formation. 2D seismic data has been acquired in all onshore blocks and the Tambaredjo Block is also covered with 3D seismic data.
Based on interpretation of the 3D seismic data over the Tambaredjo oilfield, two major fault systems can be seen impacting the hydrocarbon entrapment, namely the east-west Tambaredjo Fault and the north-east to south-west Broederschap Fault. A major north-east to south-west fault system in the Weg naar Zee Block in the central coastal area also created traps for hydrocarbon accumulations. The majority of the faults mapped in the onshore to date follow these orientations, and most can be categorized as strike-slip type.
Structuration has had a high impact on oil migration and entrapment, and an improved understanding of the architecture of faults may give explorers a better understanding of the exploration risks in certain areas – which is where FTG data comes in.
Figure 5a: Several photos taken over the mouth of the Suriname River, showing the terrain of the survey area. Land based exploration techniques are operationally challenging; hence the planned airborne program is a preferred technique to advance the geological understanding of the area. (Source: Staatsolie)
Figure 5b: Several photos taken over the mouth of the Suriname River, showing the terrain of the survey area. Land based exploration techniques are operationally challenging; hence the planned airborne program is a preferred technique to advance the geological understanding of the area. (Source: Staatsolie)
Figure 5c: Several photos taken over the mouth of the Suriname River, showing the terrain of the survey area. Land based exploration techniques are operationally challenging; hence the planned airborne program is a preferred technique to advance the geological understanding of the area. (Source: Staatsolie)
What is FTG Technology?
Onshore Suriname is a very high cost environment in which to acquire seismic. Integration of the sparse 2D seismic with potential field (magnetic and gravity) data defines some structural elements. The magnetic lineaments (Figure 6) correspond to faults in many cases and thus contribute to the understanding of the geological model of the area. Potential field data offer the opportunity to extrapolate and interpolate the fault system between sparse seismic data.
Figure 6: Incorporation of residual RTP – horizontal gradient vs. seismic section. Fault F1 has an offset of 80- 90m as can be seen on the seismic section. The map on the right shows this fault to have a west-south-west to east-north-east orientation. Other faults can also be depicted on the residual RTP – horizontal gradient. (Source: Staatsolie, 2016)
It is believed that the remaining potential of the onshore area is linked to fault-bounded plays. Even with the available 2D regional seismic data, together with aeromagnetic data, all faults could not be mapped with high accuracy. In order to improve accuracy and confidence of fault mapping and further de-risk prospects and/or leads, Full Tensor Gravity Gradiometry (FTG) data will be acquired and integrated with the existing 2D seismic and aeromagnetic data.
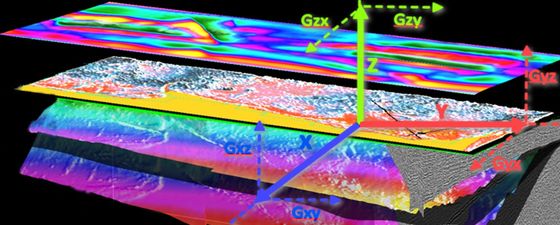
The design of the Lockheed Martin FTG was originally conceived as a U.S Navy sensing instrument. The technology was declassified in the mid-90’s and made available for commercial exploration use. The FTG instrument design differs somewhat from conventional (i.e. scalar) gravimeters; these measure the bulk downward pull of the Earth’s gravity, whereas FTG instruments measure the gravity gradients between multiple sensors in all three orthogonal directions (Figure 7) thereby fully describing the gravity field at the measurement point. This allows the user to measure how the gravity field varies in all directions at a much higher resolution, all from a moving platform. In practice, multi-directional gravity gradients are useful to an interpreter as they can yield extra information on the orientation of structural grain and faulting.
Figure 7: a) shows the conventional scalar gravity measurement; b) shows the nine gradients derived from the FTG instrument. (Source: AustinBridgeporth)
Figure 7: a) shows the conventional scalar gravity measurement; b) shows the nine gradients derived from the FTG instrument. (Source: AustinBridgeporth)
Airborne data can be acquired rapidly over large areas that are difficult to access from the ground and provide a data-rich map that can de-risk future exploration. Historically, FTG data have been used in a variety of geological settings to aid with mapping basin architecture, basement depth, faults, and intra-sedimentary structure. Where young sediments are juxtaposed against crystalline basement, the often large density contrast associated with such a configuration suggests that the gravity technique is the appropriate geophysical technology to use. The successful and much publicized application of FTG in the rift valley system in East Africa is a good example of this (see Western Tanzania: The Lake Rukwa and Lake Nyasa Rifts). The onshore Suriname presents a similar geophysical model in the sense that younger sediments overly old crystalline (and therefore denser) basement. Therefore, in areas such as onshore Suriname where 2D seismic data are sparse, FTG data can be integrated to link structure and map faults between the seismic lines.
FTG Feasibility Modelling
In order to demonstrate the applicability of FTG data to onshore Suriname, AustinBridgeporth conducted a feasibility study over part of onshore Suriname (Figure 8) to test the expected FTG response to a geological model using the following workflow:
Construct a representative 3D geological model
Assign densities to the key lithological units
Forward calculate the expected FTG response
Add typical instrumentation noise to the calculated FTG response (this simulates realistic survey conditions)
Analyse final filtered grids
Figure 8: The location of the study area (black polygon), seismic (black lines) and wells used for the study. The red polygons show the onshore licence areas.
Figure 9 below shows the top basement, top Cretaceous and topography horizons used to build the 3D model and compute the associated FTG response which was then bandpass filtered. The FTG colour-scale depicts cooler colours as gravity lows and warmer colors as gravity highs. Wavelength filters can be applied to the broadband FTG data to focus on deeper or shallower geological structures. In this case, longer wavelength signal is analyzed to yield information on the deeper broad trend of sediment thinning from north to south. Shorter wavelength signal (top-right image) is analyzed to reveal intra-sedimentary structure and faults both at basement level and within the overlying sediments. Interpretation of the FTG response then illustrates how a structure and fault map can be derived.
Figure 9: The center image shows the stacked horizons used to build a representative 3D geological model. The filtered FTG response is also shown (top-right image) which is then interpreted to produce a structure and faults map (bottom-left image). (Source: AustinBridgeporth)
Based on the representative model, the feasibility study demonstrates the technical applicability of airborne FTG to map sediment thickness and faulting in the study area. An improved knowledge of the fault systems will deliver insight into the potential prospectivity of onshore Suriname and help drive further focused exploration.