![]()
South Falkland Basin: Darwinian Evolution
 Volunteer Point is home to a large king penguin colony, as well as many other birds.In 2012 the Darwin East-1 well successfully tested a well-defined tilted fault block structure that exhibited an excellent DHI anomaly with amplitude conformance to structure. The pre-drill target was identified by mapping of seismic interface amplitudes, the principal tool in the interpreter’s toolbox. Following this discovery, could inversion data provide additional insight into the geological model?
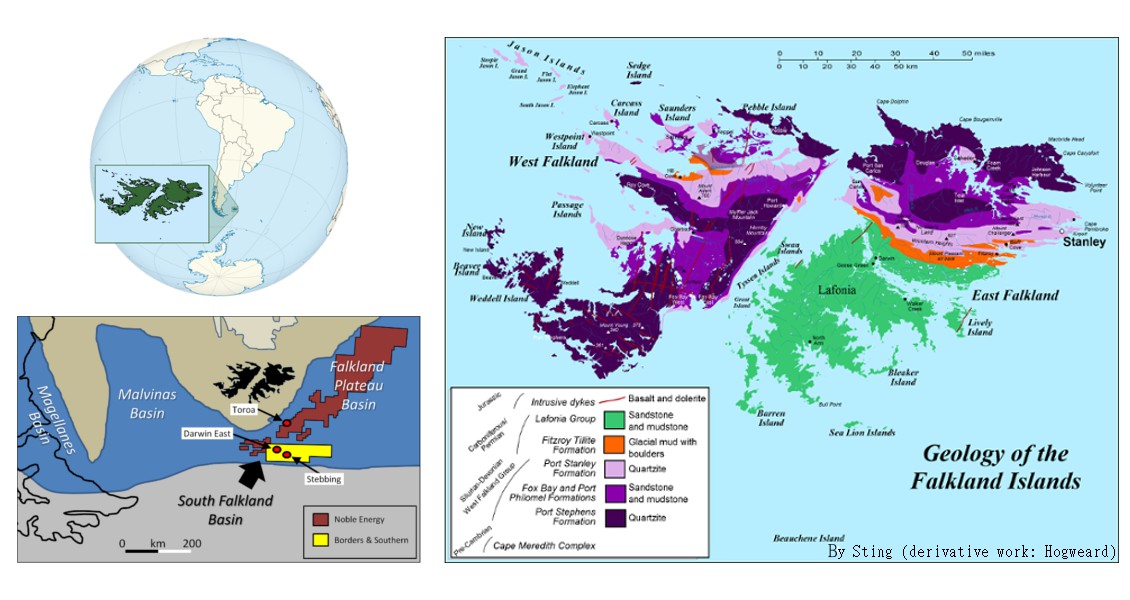
The Falkland Islands in the South Atlantic.
Evolution of the South Falkland Basin
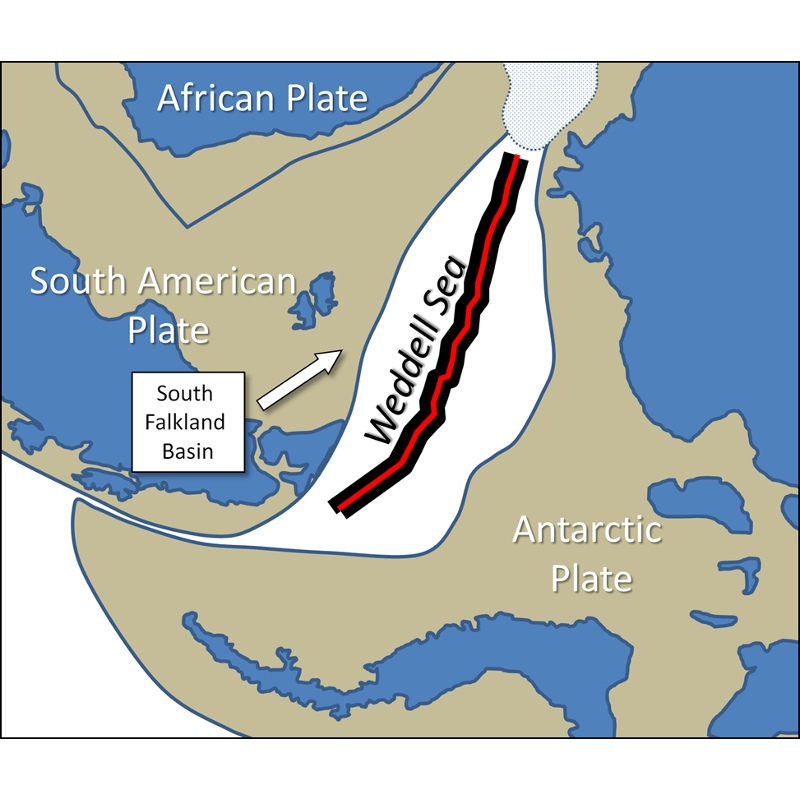 140 Ma Plate reconstruction (modified from König and Jokat 2008).The South Falkland Basin is located along the southern margin of the South American plate. The present-day tectonic setting reflects the plate convergence that took place in the mid-Tertiary, creating an inverted foreland basin. From an exploration viewpoint the observer is initially drawn into the large thrust-cored anticlines, but on closer inspection the more subtle early basin architecture is revealed.
The basin initially evolved during the Late Jurassic/Early Cretaceous as a result of separation between Antarctica and South America. After initial rifting the South Falkland Basin developed as a passive margin bordering the expanding Weddell Sea. Local stratigraphy is broadly similar to the adjoining Malvinas and Magellanes Basins. The passive margin setting continued throughout the Cretaceous period into the early Tertiary. During the early-mid Tertiary differential movements between the South American plate and Antarctica led to the development of a foreland basin. This was subsequently inverted through continued expansion of the Scotia Sea. Major tectonic activity ceased by the late Miocene.
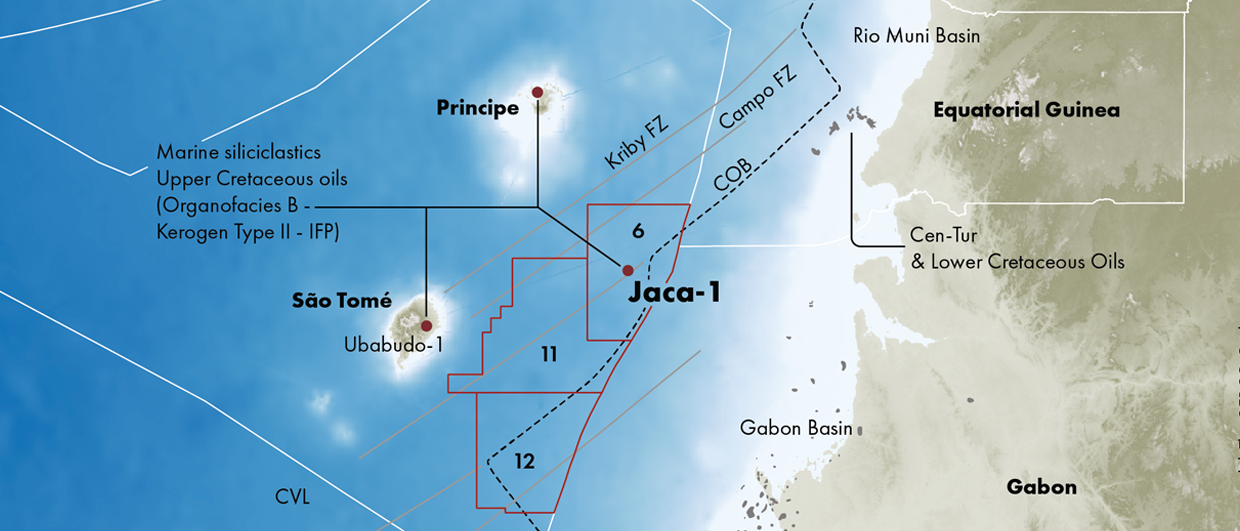
Play Elements
Anoxic marine shales of Late Jurassic to Early Cretaceous age form the principal regional source rocks. The conditions that allowed these rich source intervals to develop ceased in the late Aptian. Early Cretaceous laterally continuous shallow marine sands, deposited along the passive margin, form the main reservoir targets. Deepwater channels and fans of similar age provide additional prospectivity. Secondary targets are formed by Tertiary sediments that were flushed into the developing foreland trough. Trapping mechanisms are both structural and stratigraphic. Structures include tilted fault blocks and thrust cored anticlines.
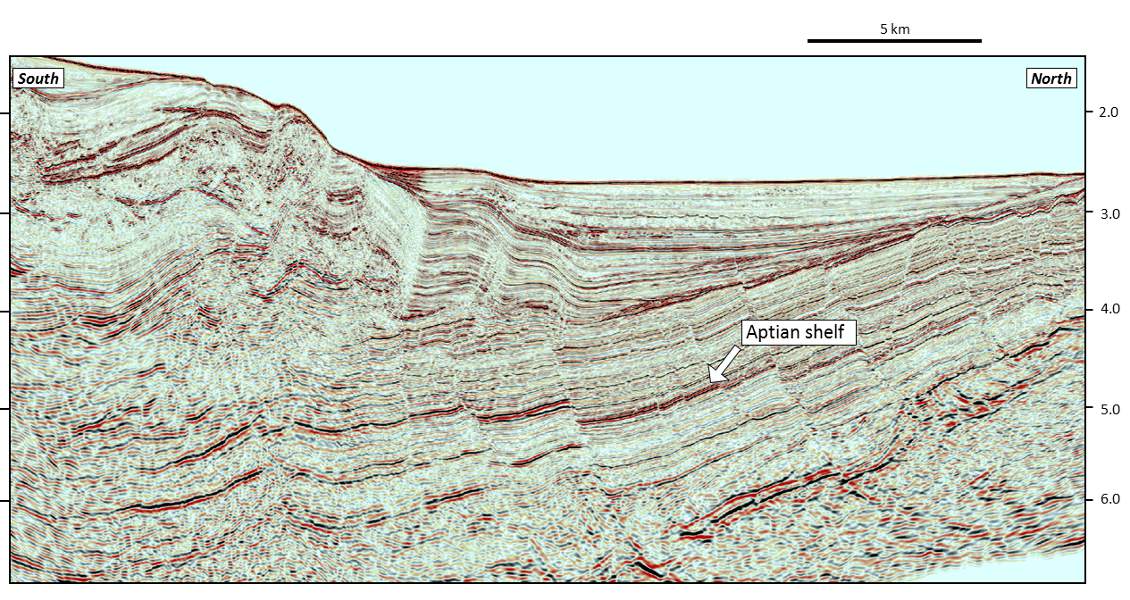
Seismic time section traversing south to north over the South Falkland Basin.
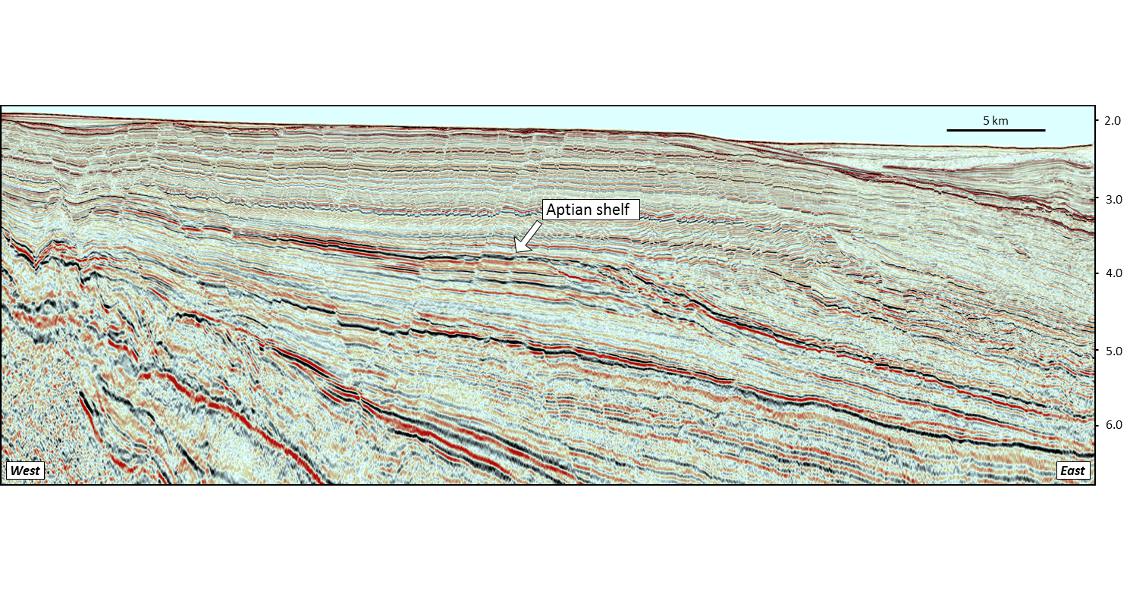
West to east seismic time section. Note the broad Aptian aged shelf, slope and basin floor architecture.
Exploration Highlights
The initial exploration assessment was based on regional geology and sparse 2D seismic. In 2008 a 1,500 km2 3D seismic survey was acquired over the western portion of the Borders & Southern (B&S) block covering the highest ranked leads. Processing of the 2008 data consisted of a standard time processing sequence including 2D SRME. The Darwin prospect was identified as two tilted fault blocks with excellent amplitude conformance to structure, denoted East and West respectively. Amplitude maps extracted along the top Aptian horizon clearly outlined the reservoir fairway on the Early Cretaceous shelf. Subsequent pre-stack work demonstrated amplitude behaviour consistent with the presence of a class 3 AVO anomaly on the Darwin prospect, providing increased confidence in the geological interpretation.
Prior to drilling the Darwin discovery, only one other well had been drilled in the South Falkland Basin. Toroa-1, drilled by BHP Billiton in 2010, tested an Early Cretaceous/Late Jurassic transgressive sand unit in a stratigraphic pinch-out play. The well was located on the basin margin. Although the well was dry it did encounter rich source intervals and thick high quality reservoir units within the Early Cretaceous. In 2012 B&S drilled 61/17-1 on the Darwin East tilted fault block. The key pre-drill risk was considered to be hydrocarbon phase. The target horizon was 2,600m below mud line, located in 2,000m of water. A gross hydrocarbon ‘down-to’ interval of 84.5m was encountered (net 67.8m). The wellbore penetrated a thick shale unit below the main reservoir, which continued below the depth of the hydrocarbon contact identified on seismic, consequently the nature of the fluid below the contact remains untested. The reservoir consists of quartz-dominated shelf sand with an average porosity of 22% and average permeability of 337 mD. Reservoir quality was similar to the equivalent stratigraphic interval penetrated by the Toroa-1 well located 70km to the north-east. Fluid samples recovered from the well confirmed the presence of a high yield gas condensate (148 to 152 bo/MMcfg). Detailed analysis indicates that the yield increases with depth. Current management assessment indicates a prospective liquid recoverable resource in excess of 263 MMbo.
The third well in the basin probed a large anticline within the Tertiary fold and thrust belt. Although the well confirmed the presence of hydrocarbons, no viable Tertiary reservoir was penetrated and abnormal pore pressures prevented the well from reaching all the pre-drill target intervals.
A full suite of logs was acquired in the Darwin East well, facilitating quantitative seismic analysis. As anticipated, initial fluid substitution work demonstrated the strong seismic response of the gas condensate when compared to brine-filled cases. This separation is clearly observed on P-impedance/Poissons ratio cross plots. The separation between liquid oil and brine was less obvious and wholly dependent upon gas saturation.
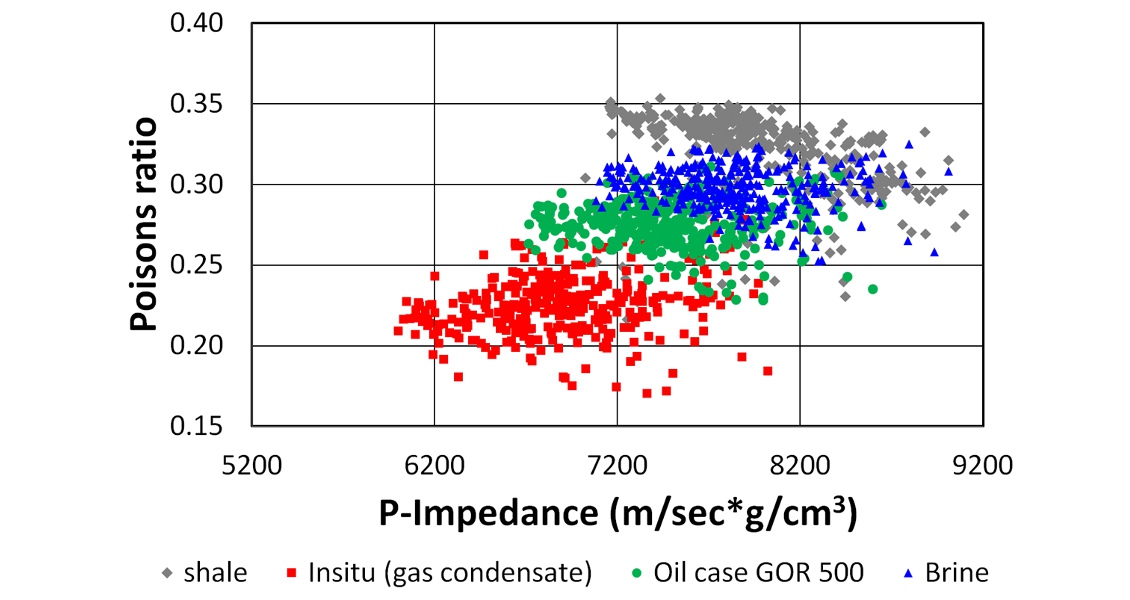
Cross plot of AI vs. PR for in-situ and modelled-fluid cases through the reservoir interval.
Enhancing the Image
In 2014, a second 3D survey was acquired with Geostreamer™ in order to track the Darwin discovery play fairway beyond the limits of the 2008 survey. To ensure a seamless merge between the two 3D volumes, the conventional 2008 data was reprocessed. A depth-processing sequence was chosen and 3D SRME was included to minimise diffracted multiple leakage into the target levels. The datasets were merged pre-3D SRME to ensure no loss in multiple prediction. An early focus on low frequency preservation and wavelet control meant that no further residual matching was necessary. The later iterations were carried out using a ‘finite offset’ tomography scheme enabling smaller scale length velocity variations to be resolved in comparison to earlier phases of tomography.
Reprocessing of the conventional 2008 data also reduced the residual multiples seen in the original data, resulting in a sharper image. The decision to go to depth has reduced the overburden affects resulting in an improved dataset for the interpreter.
An Inverse Perspective
Following completion of processing and merging, a post stack inversion was run assisted by the use of the vertical seismic interval velocities. This cost-effective inversion product can be generated shortly after processing, enabling the data to feed promptly into interpretation work. The inversion demonstrated an excellent match to the existing interpretation and a qualitatively good match to the well data. Whilst there are many factors that influence the success of a post stack inversion to recover a representative p-impedance sequence, the focus on low frequencies, wavelet control, careful monitoring of the interval velocities and targeted post migration conditioning were significant controlling factors. The standard approach to horizon mapping is through the picking of seismic amplitude peaks and troughs. These maxima and minima amplitudes are a property of the interface between two layers. Recovery of an acoustic impedance sequence, a layer property, which matches both seismic and well data, can be used to enhance the interpretation of seismic data by illuminating layer-based configurations.
A continuous horizon picked on an amplitude response may represent a particular stratal surface at a moment in time. But this surface may not reveal the subtle facies changes of the lithological units that reside below this interface. Inversion data can expose these variations in acoustic impedance and provide an additional interpretation tool. The differences in acoustic impedance may also help to differentiate between brine- and oil-filled sands. One uncertainty being tested on the Darwin discovery is the potential presence of a down-dip oil accumulation. The top reservoir amplitude map clearly defines the gas condensate accumulation but the rock property differentiation between certain oil cases and brine filled sands is more subtle and is not resolved with amplitude mapping. As expected, the inversion volume also highlights the lower impedance gas condensate. However, a variation in acoustic impedance between the reservoir interval below the gas condensate and the depth equivalent reservoir on the downthrown side of the bounding fault identifies a potential anomaly. The anomaly also expresses an apparent conformance to structure. It is possible that this variation could represent an oil rim below the gas condensate.
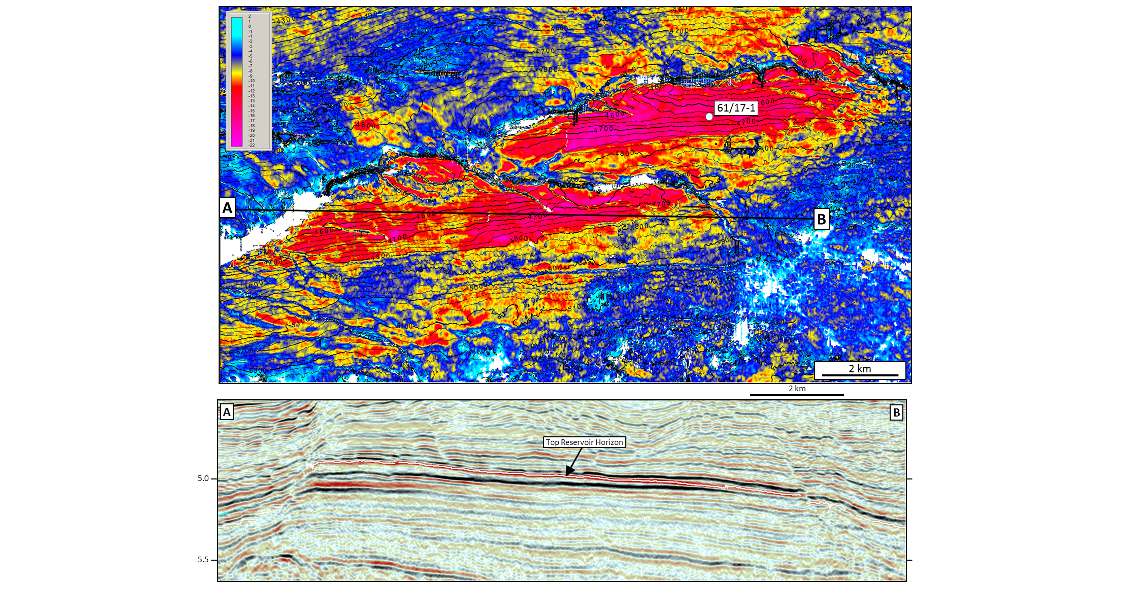
Full fold amplitude data: horizon amplitude map and accompanying seismic section. Note amplitude conformance to depth contours.
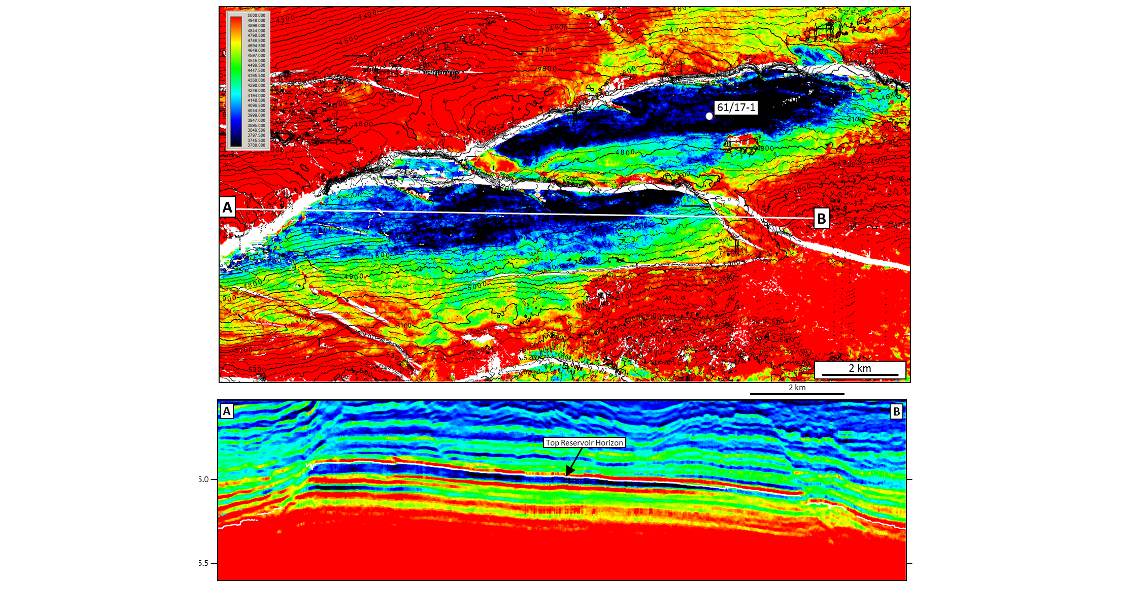
Sparse spike inversion data: map and accompanying seismic section showing the inversion response of the main Darwin East reservoir unit.
Evolution Beyond Darwin
Initial post stack inversion data has provided additional facies insights that were less obvious when reviewing amplitude data. The observed conformance to structure of the interval below the gas condensate in the Darwin Field could be coincidental but there is a physical expression that requires further investigation. To this end a standard simultaneous inversion workflow is currently being run to study the elastic response in more detail. Petrophysical log data from the Darwin East well will be fully incorporated within the low frequency model. Inversion data has led to an enhanced understanding of the facies relationships within the target play fairway. This knowledge can now be used to help de-risk the extensive prospect portfolio and identify new plays. It is anticipated that a refined inversion product will assist in generating further discoveries in this emerging play fairway.