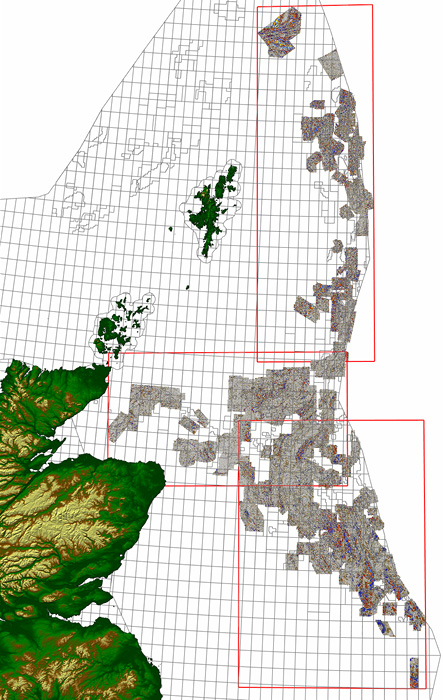
During the pandemic, Lyme Bay Consulting took the opportunity to download all the Operator-released 3D seismic data in the UKCS to produce a series of Post-Stack Merged Seismic Volumes covering the Central North Sea (CNS), Outer Moray Firth (OMF), Northern North Sea (NNS) and Faroe-Shetlands Basin (FSB).
Given the current energy security risks and increasing effort and research into energy transition and CCS, we are pleased to announce, subject to completion of contracts, that this data will be handed over to the North Sea Transition Authority (NSTA) and be available for free public distribution via the National Data Repository (NDR).
This will allow unconditional access to the data for research institutions and large and small companies alike in both the oil and gas sector as well as carbon capture and storage (CCS) and renewables.
With this exciting news, we felt it timely to reflect on the history of large-scale regional merged seismic data and its many advantages.
It is more than 20 years since the concept of large-scale merged seismic projects was brought to life by a leading seismic company with a multi-client (MC) seismic division. These merged datasets are now commonplace in many basins the world over and an integral component of oil company seismic data portfolios.
For some of us who have worked in the industry for many years, the early days of these merged projects is relatively well known. To those with a few less years under the belt, they are ‘part of the furniture’ and are rarely given a second thought and the trials and tribulations of getting these projects off the ground at the turn of the century are perhaps less well known.
If these surveys could be integrated and merged on the same super grid and balanced in amplitude and phase, then there were major advantages over the numerous and disparate individual surveys.
Seeing the big picture
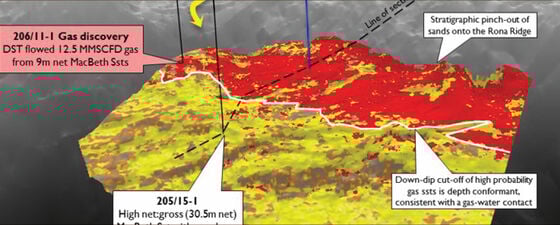
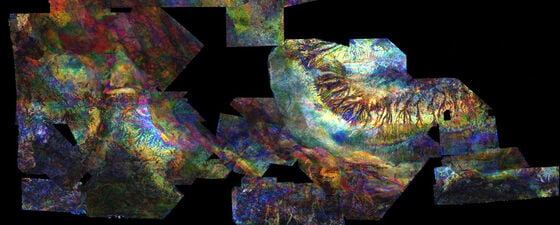
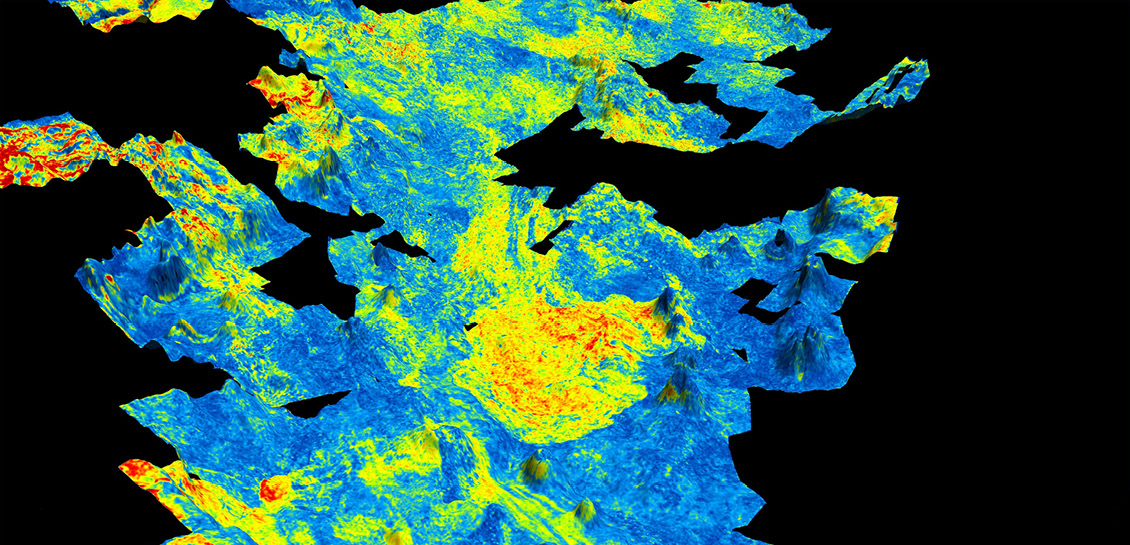
One big advantage, marketed in the early days using the famous Maureen Fan image, was the ability to extend interpretation seamlessly across large areas, removing the ‘postage stamp’ interpretation approach allowing both explorationists and developers to view their area of interest with adjacent geology and see it in proper regional and sedimentological context.
Whether placing a prospect within a regional play-fairway or obtaining a better understanding of the depositional environment for a discovery or development, this ability to map outside the immediate area of interest was, and still is, of great value. Seeing the geology within a company’s licence area in a regional context and tying formations to wells across multiple licence blocks and even much larger UKCS quadrants, allowed the early establishment of play models within an exploration team and became a vital aid in identifying new or missed prospects.
This ability to derive relevant and detailed regional play fairway maps directly from seismic, calibrated to well data, provides a far better understanding of sediment distribution and of prospectivity concepts. The ability to map them directly from distal analogues of offset field and well data to a prospect or discovery allows one to understand and quantify risk with more detailed observations.
There is a clear commercial benefit too. The ability to independently review farm-in opportunities or open acreage prior to third party discussions, promotes improved early understanding and allows for increased relevance and understanding when attending farm-out data rooms.
How it started and the early reality
To readers brought up on multi-terabyte disks, high CPU clock speeds, numerous gigabytes of RAM and high-end graphics cards, the challenge of loading and interpreting regional merged datasets must seem trivial.
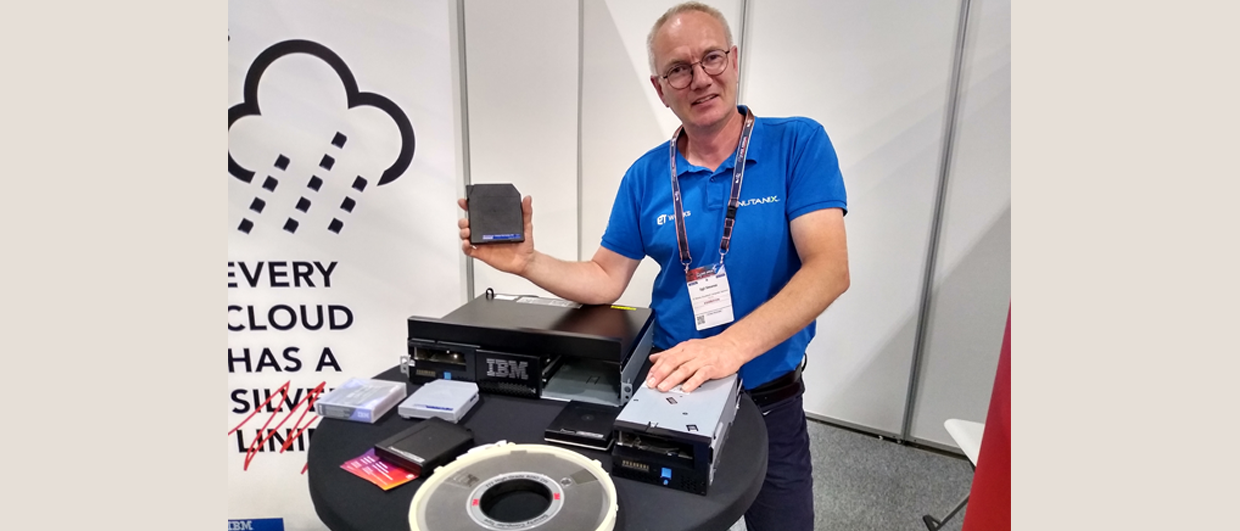
However, to put the challenge in perspective, my first interpretation workstation, an IBM RT with five 300 MB SCSI (Small Computer System Interface) disks and a tie wrap to keep the A4-sized graphics card in its slot, was cutting edge in 1988. Just over a decade later, in 1999, I was blessed with Sun Sparc 60 workstation and a RAID (Redundant Arrays of Independent Disks) containing twenty 9 GB SCSI disks which were full to the brim with ongoing client and MC interpretation projects. It was at this time that the Geoscience Director approached me and asked me to look at the feasibility of loading and interpreting the entire merged Central North Sea seismic volume.
The scale of the challenge
The first issue was that the dataset size was far too large for the interpretation software and hardware technologies available at the time. One of the interpretation software packages even had a 16-bit number limitation (32767) on the number of seismic lines and number of crosslines in any given survey and an upper limit on the size of the loaded volumes. Interpretation of modest seismic volumes was already difficult as most software and hardware was limited to 2 GB of RAM and, if pushed, paging memory in and out of disk-partitioned swap space.
Due to tape capacity limitations, the first SEGY data was delivered in 1000×1000 volumes or tiles that fitted on an IBM 3590 cartridge. The first tile was loaded at full resolution, but it was quickly established that to have any hope of success, the data had to be sub-sampled. Comparison tests were carried out comparing the 12.5m binned data to sub-sampled 25m, 50m and 100m versions. 50m bin size was chosen as the level of seismic aliasing was only an issue on very steep flanks of salt diapirs. This gave a volume that was 1/16th of the size of the original SEGY data.
Following on from this, the 50m volume was then tested at 8 bit, 16 bit and 32 bit. The space-saving 8-bit was really the only option at this point as this reduced the data again to ¼ of its 50m volume size, an overall reduction of 1/64th of the size of the original SEGY. The 8-bit data however was deemed unacceptable as the scaling and clipping required reduced the dynamic range of the amplitudes and created unwanted fingerprint effects on auto-tracked horizons and subsequent attribute maps.
Just as we were about to throw in the towel, along came workstation compressed format seismic which radically changed our approach. With a compression fidelity of 85, a 50x50m volume at 32-bit resolution shrank to as little as 300 MB per tile. This allowed us to load the data at 32 bit and create locally stored 8-bit RAM friendly, auto-track volumes as and when required.
The irony of merging all the UKCS seismic 3D datasets into large regional volumes and then breaking them apart into over 100 tiled projects was not lost on us. However, it would not be for another 10 years or so before hardware and some interpretation software would catch up and allow for the full merged data to be loaded into one contiguous data cube.
With over 20 interpreters working on the data at any one time, the advantage of the tiled projects became evident as it allowed for focused and easily managed interpretation and QC. Additionally, when new data was released, the tiles were easily updated without having to replace the entire volume. If a tile was corrupted or data accidentally deleted, it was easily restored with minimal downtime. As for ‘gluing’ it all back together again, all of the data management, exports, imports and mapping were command-line scripted and automated, driven by a strict regime of project, horizon and user naming conventions.
And so, to the present day
Since then, the situation has changed dramatically, mostly due to the exponential improvements in computing hardware and its reduced cost. We now have access to superfast PCs, larger capacity and spectacularly cheaper and faster disk space, Gigabit local area networks and vast amounts of RAM as standard. This means that regional seismic projects can be loaded, as originally intended, in one cube at 32-bit resolution and at 12.5m or 25m bin size.
There are still some software platforms that struggle with large volumes, large horizon files, or both, but generally the ability to use and capitalise on large regional seismic volumes has improved to the point that it should be standard practice for any interpreter and/or exploration or development team to review regional data and offset analogues in any subsurface workflow.
UKCS merged volume improvements
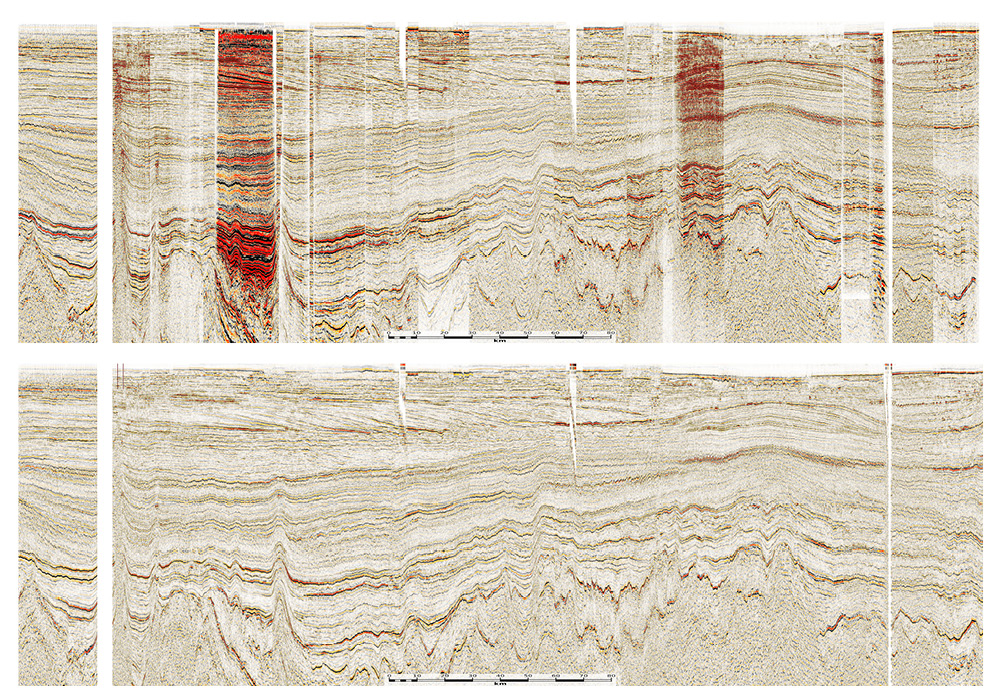
Below is an example of the uplift the Lyme Bay (LBC) merged UKCS has over a raw merge of released NDR 3D data. Our conditioning approach has produced a balanced volume that is far superior for both regional interpretation and prospectivity mapping given the noise reduction, amplitude and phase matching, and improvements in reflector continuity.
In addition to the LBC Merged Volumes for the CNS, OMF, NNS and FSB areas, the 130+ corrected individual input volumes will also be made available via the NDR. These have been corrected for navigation and CRS issues, the byte locations standardised, true live-trace polygons created and data re-binned to a common grid. This will allow users the ability to remerge surveys using their own phase and shift parameters, without the need for re-binning the legacy 3D survey if desired.