Field managers are required to make costly decisions, relying on data that almost always could be improved. Entire projects are in jeopardy if the wrong questions are asked or answers are not sufficiently sound. Will a new survey be fit for purpose? Is it the data that is causing issues, or rather the processing flow? Should one try something new to improve imaging or repeat the old (for time-lapse reservoir information)? How can we improve interpretation to mitigate risk? Balancing budget and benefit may sometimes be the most challenging part. But it might not need to be. Ray-based seismic modeling might not make the decision for you, but it can provide essential information before proceeding with a gamble.
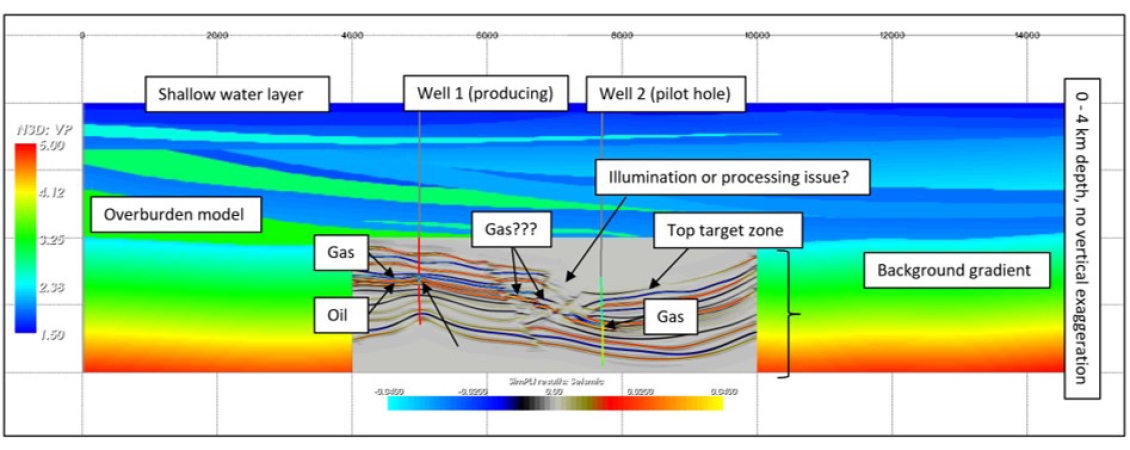
Figure 1: General setting and model representation. © NORSAR.
The synthetic model in this article combines a typical oil and gas reservoir with complex structures from an ancient channel and levee system (Figure 1). While this is a realistic setting, as found, for example in the Bay of Bengal, it can be considered analogous for any laterally and vertically varying velocity fields that reveal moderate impedance contrasts. The reservoir, on the other hand, contains poorly imaged tilted blocks. The poor imaging could either stem from overburden effects or target dip, a scenario often encountered in many parts of the world.
The case we are looking at here can be described as follows. There is an existing towed streamer survey (crossstrike) with 3 km maximum offset, that initially provided the basis for a drilling campaign. One reservoir is already producing oil, the other one has proven gas but requires further development. What happens in the tilted blocks between the reservoirs is unclear, as seismic interpretation is hampered by imaging issues. The key question of this study is whether careful reprocessing of existing data can save the cost of acquiring new data.
Will a New Survey Improve the Image?
The first part of this study is a classic illumination test, i.e., the existing survey is evaluated by modeling all shots within a representative depth model. Typically, the model would be built from interfaces picked from migrated seismic sections and from interval properties as determined from seismic velocity analysis, well logs, check shots, or even best guesses.
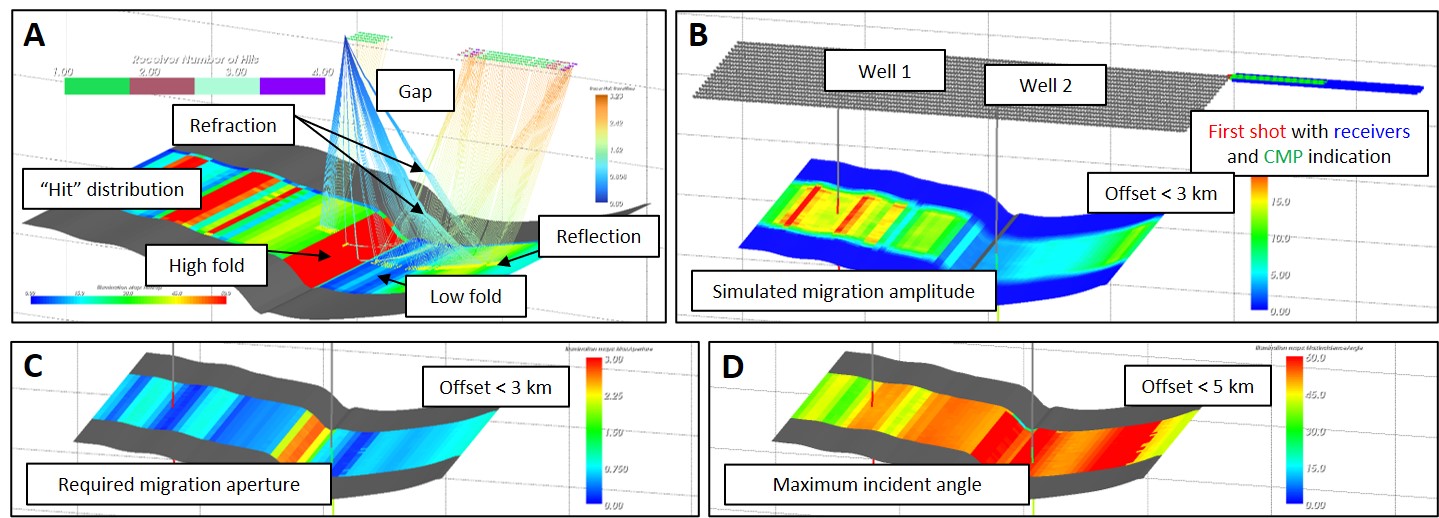
Figure 2: Selected results of the illumination study, showing A: ray paths for a single shot and a single receiver line as compared to the reflection point distribution on the target (‘hit map’), B: simulated migration amplitude along the target, C: required migration aperture for seismic imaging, and D: maximum incident angle at the target (if maximum offset is increased from the initial 3 km to 5 km). © NORSAR.
On the modeling side, a technique called wavefront construction was used in this study. In other words, wavefronts rather than rays are propagated through the model, which is much closer to what is happening in the field (and much more efficient in the presence of many receivers). As the wavefronts are constructed from rays, the rays are still available and can be displayed and utilized as in classic ray tracing. A key feature of ray-based modeling is that simulations can be limited to selected parts of the wavefield (e.g., a primary target reflection). This is fundamentally different to full wavefield data and makes the process very efficient. As reflection points are known, ray-based modeling is also suited for generating attribute maps directly on the target of interest.
In this case, the target is illuminated unevenly (Figure 2A), even though the survey was densely sampled and regular. Especially the steeply dipping top of the tilted blocks receives many ‘hits’, but also seems to generate a shadow zone close to its base. Ray path analysis reveals that the shadow zone is caused by refractions in the overburden, which deflect rays from the affected area. Another core observation is that illuminating the dipping section requires a large migration aperture, i.e., contributing shots and receivers are not located right above the slope, but further away. Consequently, ray paths are longer and both attenuation and geometrical spreading are effectively reducing amplitude. This can be visualized by using an illumination parameter called Simulated Migration Amplitude (SMA) (Figure 2B), which is generated by migrating reflection events along the target. For the given example, this mainly shows that target coverage and final reflection amplitude are only loosely related, and many ‘hits’ do not necessarily produce a strong amplitude in seismic sections. Also, the dipping section will be poorly imaged if migration aperture is set too small when processing (Figure 2C).
The question whether a new survey with a different geometry will do better, requires moving from survey evaluation to survey planning. Many different survey geometries could now be tested, but as the area is almost 2.5D (i.e., not much changing along strike), there are only two key options that seem to make sense: using longer offsets and running the survey along strike rather than cross strike. Checking the effect of larger offsets is simple, as typically long cables are used for modeling anyway (for exactly this purpose). It turns out that incident angles become over-critical if offsets are increasing beyond 3 km (Figure 2D). Longer cables would therefore nominally increase the fold, but not provide much extra contribution directly used for seismic processing. If only subcritical events are considered, attribute maps for an along-strike survey do not reveal any advantage to the initial survey geometry.
Thus, on initial consideration, new data may seem to be a waste. However, there may still be good reasons for shooting along strike, as the second survey azimuth could be combined with the first to increase fold and signal-to-noise ratio. There may also be good reasons for repeating the existing survey, as this could be used for monitoring the reservoir, and ideally, estimating fluid saturation and pore pressure therein. However, can we predict whether there would be a sufficient 4D signal for this?
Predicting 4D Success
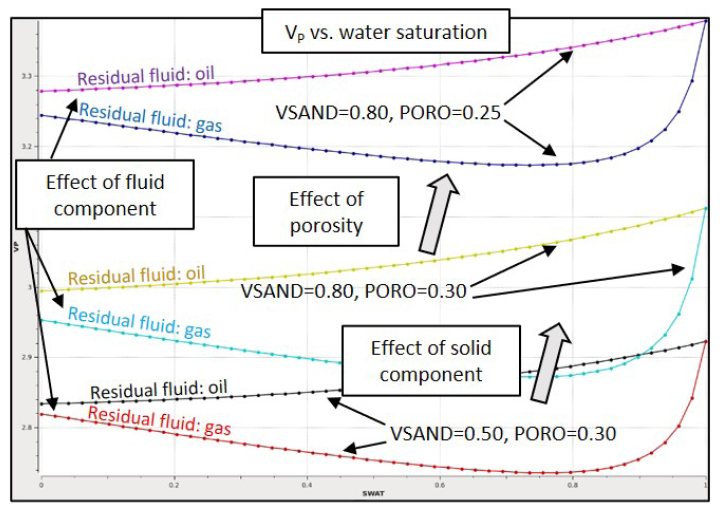
Figure 3: Sample calculations from a rock model, indicating how fluid saturation, shale content and porosity affect P-wave velocity. © NORSAR.
Time-lapse studies typically start with a fluid simulation model that produces numerous scenarios for many different time steps. To translate fluid flow simulation into 4D seismic signals, two steps are required. The first uses rock physics to convert parameters like fluid saturation, shale content, porosity, and pore pressure into elastic parameters (Figure 3), as these are needed for calculating reflectivity. This means, rock models can indicate how reflection coefficients are changing in response to production. It is recommended that rock models are calibrated by well-log data in each specific case. The second uses a suitable fast-track method for Pre-Stack Depth Migration (PSDM) simulation, as many different scenarios need to be evaluated efficiently. Point-spread functions, as generated from ray-based modeling, may act as 3D convolution wavelets that can be directly applied to reservoir models (or, more specifically, to incident-angle-dependent reflectivity grids). This process is almost as quick as classic 1D convolution but considers both illumination and resolution effects. Calculating the difference between a base case and a monitor case allows for estimating the amplitude change and thus the expected 4D signal (Figure 4). In the given case, a reasonable 10% reduction in reflection amplitude seems to suggest that a monitor survey might be worthwhile. However, there still is the issue that tilted blocks are not sufficiently imaged, which obviously cannot be rectified by choosing larger offsets or a different survey azimuth. It is therefore time to get back to the initial question of ‘will it be beneficial to reprocess instead of acquiring new data?’
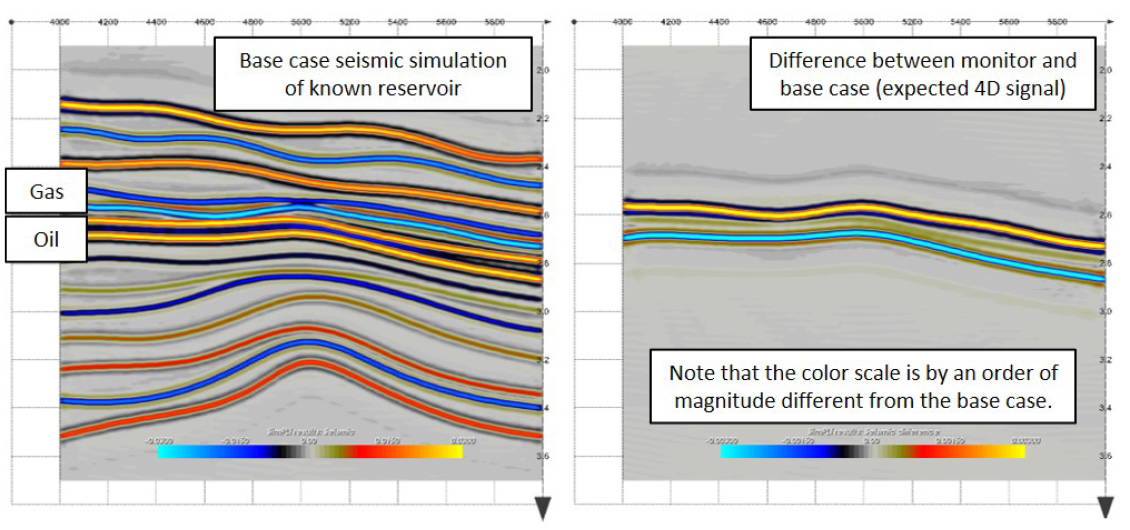
Figure 4: Estimated 4D effect from a fluid simulation model. © NORSAR.
Reprocess or Not?
Traditionally, ray-based modeling data are not well suited for processing tests, as amplitudes for triplications and caustics are not well represented and may distort images by systematic artefacts. However, the approach to fast-track PSDM simulation as outlined above may help, as it indicates the impact of migration aperture on both the final seismic image, and its lateral and vertical resolution (Figure 5). In other words, if the migration aperture was too small when the initial seismic data were processed, poor imaging of tilted blocks is explainable, and may be fixed by reprocessing.
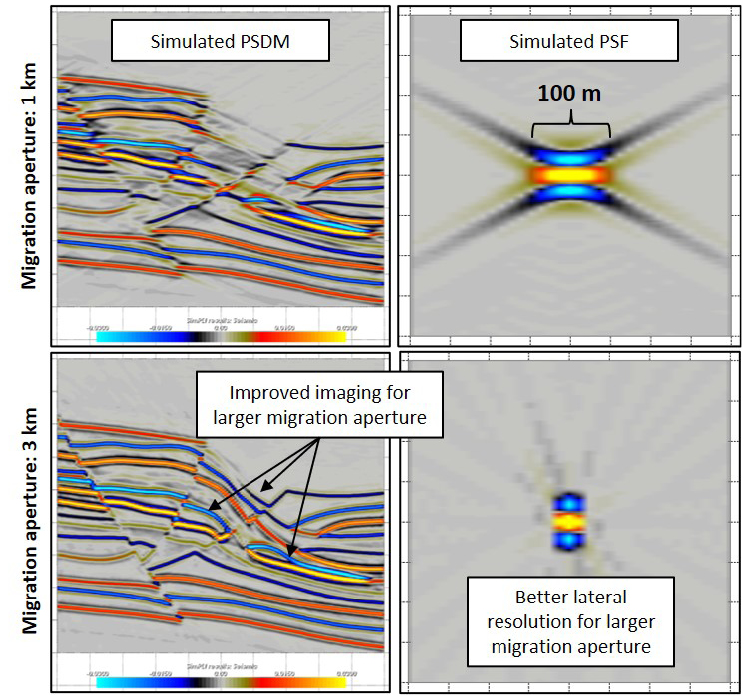
Figure 5: The impact of migration aperture on the seismic image and its lateral resolution. © NORSAR.
It also is worthwhile checking whether the velocity field used for seismic migration was accurate enough. This cannot be tested by a fast-track filter approach but requires migrating synthetic shot gathers. Ray-based Kirchhoff modeling as used in this study can be limited to P-P primary signals from the target volume of interest, and therefore provides an efficient alternative to more comprehensive (but also more expensive and time consuming) concepts like full waveform modeling. Synthetics generated by this process include diffractions and are therefore suitable for migration tests. Using different background models for Kirchhoff target migration, i.e., different velocity fields, the effect of upgraded velocity information on the final image can be tested directly. In this case, seismic image quality suffers a lot if migration velocity in a few overburden layers is wrong by as little as 10% (Figure 6). If updated velocity information has been made available since the data were initially processed, reprocessing would make a lot of sense. It would likely also allow for better interpretation of the tilted blocks. Ray-based modeling could then be used for identifying qualified events for accurate amplitude variation with offset (AVO) analysis, by generating shot gathers for model iterations based on assumptions of the oil or gas content in the potential reservoir. Comparing modeled shot gathers to field records will then provide additional confidence in interpretation. This may mitigate exploration and production risks, and even de-risk a potential drilling campaign.
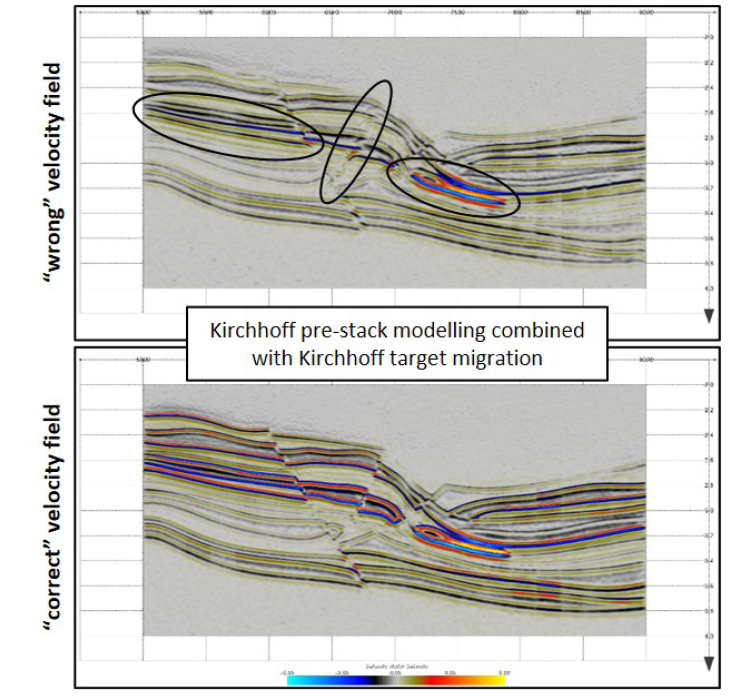
Figure 6: The impact of inaccurate velocity fields on the seismic image. © NORSAR.
Combining different ray-based modeling approaches may not only guide new seismic acquisition, but also help to make the most out of existing data.