Integrating geology, engineering and economics into a detailed simulation model allows for the accurate prediction of shale oil and gas full-field reserves and their future production
Key to economic and environmentally friendly development planning for an oil and gas field is to know how much of the resource can be recovered and by what means, and where the resource is located. For conventional fields, the process starts with exploration. Once an economic field has been found, the planning for that development takes place and can include well pads, pipelines and extraction facilities, culminating in proposals for the final abandonment of the site once the resources have been exhausted.
Shale or continuous reservoirs are more challenging to produce and pose a different and more difficult problem in assessing full-field reserves. This uncertainty makes the development planning process and the related impacts that policy-makers and the public must deal with problematic. However, accurate predictions are necessary and provide a common ground where industry, policy-makers and the public can come to terms with the complex issues related to development of a valuable resource.
New wells being drilled to exploit shale resources stand alongside pump jacks bringing oil to the surface from conventional reservoirs in the Delaware Basin of west Texas. Innovative techniques using horizontal well bores and staged fracking will keep the Permian Basin Province a major US oil producer for many years to come. (Source: Thomas Smith)
New Approach
For the past seven years, the Bureau of Economic Geology’s (BEG) scientists, engineers and economists at the University of Texas at Austin – led by physicist and economist Svetlana Ikonnikova, engineer John Browning and geologist Scott Tinker – have been using a new approach to answer questions on just how much, where, and when a shale field will produce through time. By assessing continuous (unconventional) reservoirs using a multi-disciplinary, bottom-up approach, they can make a simulated model of the entire field. This model, the most detailed publicly available in the industry, takes into account where each well is expected to be drilled and the number of future locations, how its completion would affect investment costs, and how all the produced elements, such as liquids, natural gas and water, will affect the revenue.
The team has completed studies on four shale gas and two shale oil basins to date. They have recently begun work in the Permian Basin Province located in west Texas and south-east New Mexico, led by Ikonnikova and engineer Mark Walsh. The 400 by 480 km area contains the Delaware Basin on the west side of the Central Basin platform and the Midland Basin to the east of that platform.
Permian Basin Province
Unconventional resources are leading the production surge in the Permian Basin. (Source: BEG)
The Permian Basin Province is one of the world’s great oil-producing regions, delivering 17% of the US’s total oil production (see, The Permian Basin – A Brief Overview). Oil production has been steadily rising since 2008 to over 2 MMbopd (currently 20% of the US’s daily oil production), matching the previous peak production mark achieved in 1973. Exploitation of the area’s huge and varied unconventional plays has more than doubled daily production in less than a decade. These resources could make this one of the largest oil basins in the world. The US Geological Survey (USGS) recently assessed just one horizon in the Midland Basin (the easternmost basin of the Permian Basin Province), the Wolfcamp Shale. Their technically recoverable mean resources of 20 Bbo and 16 Tcfg is the largest estimate of continuous oil ever assessed in the US.
BEG scientists are in the process of analysing the geology, engineering and economics that can be used in their detailed simulation model. Once completed, they will be able to accurately forecast production and recoverable hydrocarbons for this vast area containing multiple (seven for each basin) reservoir horizons. This task will take years to complete but will have far-reaching implications as to balance of trade, regulation and infrastructure planning, carbon and methane emissions, and energy security.
The Barnett Study
Improving on other estimates, the BEG studies map the original gas-in-place for the play. In the Barnett Shale play map, the red colours represent the highest concentrations of free gas in place down to the lowest in blue. (Source: Guin McDade, BEG)
The Barnett Shale play, located in north Texas west of Dallas, is the place where the ‘shale revolution’ got up and running, thanks to the efforts of Mitchell Energy in the early 1980s (see, Producing Gas from Shales). It is also the play in which BEG scientists first developed their methodology in determining full-field reserves and production forecasts for shale reservoirs.
This study, completed in 2013, provides a new benchmark with which to compare the more general, top-down approach to shale resources. The detailed, integrated study allows for scenario testing based on several technical and economic parameters. Their base case forecasts a cumulative 45 Tcf of economically recoverable reserves and they predict production will decline to about 900 Bcf/year by 2030 from a 2013 peak of 2 Tcf/year. This forecast falls in the mid- to higher end of other published predictions in suggesting that the Barnett will be a major gas producer for at least another 15 years.
This Barnett study offers several unique contributions to understanding how the play will be developed over time. For this model, they analysed 10 productivity tiers and determined detailed well economics, well attrition rates, quantification of well-drainage volumes, and recovery factors for each tier.
Resource Assessments
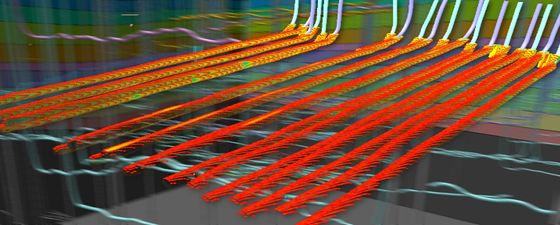
3D visualization of lateral wellbores.
Resource assessments are estimates that try to quantify something that cannot be accurately known until that resource has been depleted. Such assessments are based on the data, information and methodology currently available, making them subject to revisions over time as improvements in the data and assessment methods occur.
Resource estimates are prepared for many reasons and utilise a variety of methods. To make use of any estimate, and to compare them, it is necessary to understand the how and why it was prepared, the extent and reliability of the data on which the estimate is based, the expertise of the assessors, and the limitations of the methodology used. Adequate documentation must also be provided to allow users to evaluate the estimates and be able to compare different resource assessments.
Most resource assessments use a top-down approach to analyse plays and typically arrive at a probability range for the resources. BEG’s bottom-up approach quantifies well-drainage volumes and recovery factors to obtain a numerical model that will predict full-field reserves and forecast production for a variety of economic scenarios.
Methodology and Workflow
Underlying any play resource is the geological characterisation of that play. A stratigraphic framework is built from an extensive network of correlated well logs and put into a 3D geocellular model, where each geological layer in the Midland and Delaware Basins is represented. Using core analyses and petrophysical interpretations to understand the reservoirs, the hydrocarbon pore volume (HPV) is distributed in the 3D model. A fluid property model is then derived using pressure, volume and temperature (PVT) reports, oil gravity, pressure, and pressure gradient. Incorporating the HPV and fluid properties, the resource in-place can be estimated. This is all validated using the results of production analysis, particularly estimated individual well recovery factors, to identify areas that require additional data and analysis.
Concurrent with the geological analysis, BEG engineers are performing decline analysis and reservoir engineering. Using pressure, porosity, fluid viscosity and water saturation as input parameters into their physics-based model specifically designed for shale reservoirs, they can estimate future production from all existing wells. By understanding what existing wells will produce and drain, the BEG model is able to create rigorous scenarios for what remains to be produced from undrilled regions. Engineers also run full 3D reservoir simulations on representative window areas in the field to ensure accuracy and identify the most essential reservoir properties necessary to explain well production. From here, a decline model is developed. Expected future monthly production of oil, gas and water over the well’s lifetime is predicted by this decline analysis. In combination with simulations, the analysis also allows the researcher to estimate effective stimulated rock volume and perform recovery factor studies. This becomes important in successive analyses of completions and expected future drilling patterns and their interrelation with per well expected production.
A statistical analysis is performed to identify the drivers of well productivity and to forecast productivity of future wells given a well’s location. Particular attention is paid to well landing, completion date, and completion parameters. The expected productivity of wells combined with the projected number of wells left to be drilled in each square mile – given the thickness of each zone – are used to determine the technically recoverable resource with great granularity (level of detail). The inventory of future wells and their performance serve also to underlay further analysis of the possible future development of the basin as a whole, and within each zone.
To predict the path that future development will take, forecasts for the performance of existing and future wells will be input into a well economic analysis. The profitability of existing wells and how wells of varying attractiveness have been drilled and completed over time is analysed to calibrate the expected drilling model. Based on expected profitability of future wells, a model is built projecting future drilling and how it is likely to change depending on technological progress, market parameters, infrastructure development, and costs associated with existing and future regulations. By answering the questions “where, when, and how will the wells be drilled?” the BEG team, guided by past play activity, can build much more accurate future production outlooks.
The final products include production over time in each tier (on left) and production for different gas prices. Both graphs are from the Barnett Shale study completed in 2013. (Source: BEG)
Using All Resources
Shown are a collection of wells colour-coded by completion zone, with the end point coloured by total production to date. A distributed facies cross-section in the foreground was distributed from several hundred wells. This illustration shows the multiple shale targets that add complexity to the BEG study and huge oil reserves in the area. (Source: Robin Dommisse, BEG)
Dr. Frank Male, BEG researcher, concludes, “To ensure that our assumptions are realistic and incorporate the major trends, we meet with key operators in each play. Supported by data on cost structures, drilling and completion approaches across the basin, and by understanding efficiency gains and areas subject to future improvements, we investigate the sensitivity of our projections. We run scenarios with varying assumptions on technology, economics, regulations, etc. The granular results are shared with state authorities, industry representatives, public, and research communities. Given the increasing share of shale gas and shale oil in the US energy supply, the related energy security benefits and environmental risks make the study valuable for the general public and policy makers.
“Our motivation for undertaking these detailed studies is to build the best, most robust, and transparent framework for discussing shale basins like the Permian,” Dr. Male continues. “Once the framework is in place, we can start to tackle a wide range of questions important for the local, state, and US economy. Some of the issues include energy supply, security and sustainability of the supply, environmental impacts, infrastructure planning and management, and fiscal issues. For example, with water flowback, production, and completion analysis tied into field development scenarios, we can study how the water footprint of the Permian Basin evolves over time. These studies are designed to be of direct interest to stake-holders impacted by the field development.”
References
Producing Gas from Shales by Thomas Smith
A rock as tight as a table top, the Barnett Shale has become the most prolific gas reservoir in Texas and the largest active natural gas play in the United States. Exploration in this play is truly cutting edge, pioneering stimulation technology that will undoubtedly lead to new shale gas production throughout the world. This article appeared in Vol. 4, No. 2
The Permian Basin – A Brief Overview by Thomas Smith
The Permian Basin region is 400 km wide and 480 km long and has produced over 35 billion barrels of oil since 1921, currently accounting for 17% of total US production. This article appeared in Vol. 9, No. 6
From the Geo ExPro archive
Unlocking the Earth – A Short History of Hydraulic Fracturing by Michael Quentin Morton
The recent shale gas boom is a reminder that the effective use of hydraulic fracturing in shale formations is a relatively new phenomenon. However, this ‘fracking’ (also called ‘fracing’ or ‘fraccing’ in the technical literature) has been around for longer than many people realise, and the use of unconventional techniques to extract oil and gas from the ground has developed over more than 150 years. This article appeared in Vol. 10, No. 6
A Workflow for Success in Shales by Ted Holden, John Pendrel, Fred Jenson and Peter Mesdag
Following a rock properties-based workflow for shale plays makes it possible to gather intelligence which not only defines where to drill and how to frac, but also better predicts the economic outcome. This article appeared in Vol. 10, No. 3
Finding sweet-spots and quantifying recovery potential in unconventional plays by Ian J Cockerill and Aaron W Hughes
Using the Montney Play as an example of how a Common Risk Segment Mapping approach can be applied to quantifying Estimated Ultimate Recovery in pervasive hydrocarbon systems. This article appeared online in August, 2015