Over the last two years companies exploring North West Africa have seen a high value of return.
This regional update is brought to you by Rystad Energy.
Conventionally, African exploration has been focused in Nigeria, Egypt and Libya; most other frontiers were either underexplored or not explored at all. However, in recent times Africa has been the hot spot for exploration activity, mostly concentrated in West Africa, offshore Mozambique and Tanzania, and the East African rift system in Kenya and Uganda, as well as the opening of new carbonate plays in the Nile Delta. The slump in oil markets has had a huge impact on exploration activity, with a decline of about 60% in the African continent since 2015.
The drop in activity since 2015, however, is not indicative of exploration efficiency. The success ratio (i.e. the percentage of wells encountering hydrocarbons) has been almost 60% since 2015 for both East and West Africa, but fell from 70% to 50% for North Africa. In the same period, the average discovered volumes per well dropped from 106 to 7 MMboe in North Africa and remained constant at around 50 MMboe and 70 MMboe for East and West Africa respectively. Exploration efficiency clearly highlights that overall exploration was a success in both East and West Africa.
Discovered resources (left axis) in the African continent per year by regions and the number of exploration wells (right axis, line graph) by region. Source: Rystad Energy ECube
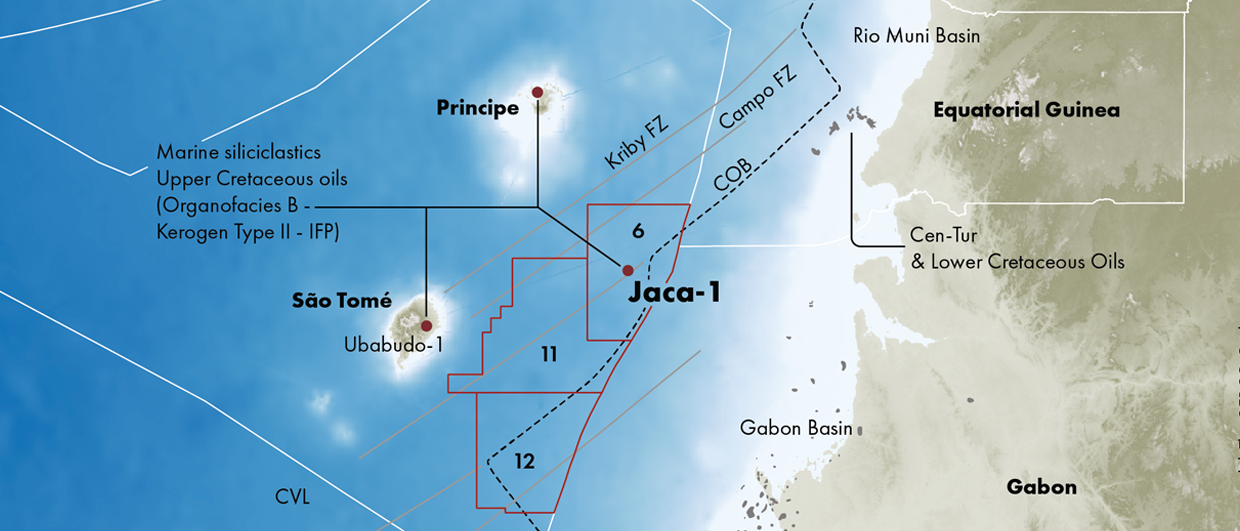
The discovered volumes from 2010 to 2012 came from East Africa, with giant gas discoveries like Prosperidade, Mamba South and Golfinho. From 2013 to 2014 most of the discovered volumes in Africa were uniformly distributed between East, West and North Africa. Following the drop in the oil price, there was Eni’s Zohr discovery in 2015, which revitalised interest in the Mediterranean. However, over the last two years average discovered volumes have plunged significantly in both East and North Africa. All the major discoveries, like Ahmeyim and Yakaar, come from Senegal and Mauritania in North West Africa with operators including Kosmos Energy and BP.
After analysis of companies involved in exploration since 2015, we observe that BP has reserves of around 2.5 Bboe, followed by Eni at around 2.4 Bboe and Kosmos Energy with about 1 Bboe. The exploration cost after tax is approximately US$822, $1,233 and $315 million respectively for these companies and the value of discoveries for them is around nine, four and three billion US$ each. This clearly indicates that since 2015, BP, Eni and Kosmos Energy have created substantial value in their respective regions by discovering assets that are worth more than their investments after tax. Thus, we can conclude that in the last couple of years, considerable value has been added through exploration in North West Africa as compared to the rest of Africa.
Abbreviations
Numbers
(US and scientific community)
M: thousand = 1 x 10³
MM: million = 1 x 10⁶
B: billion = 1 x 10⁹
T: trillion = 1 x 10¹²
Liquids
barrel = bbl = 159 litre
boe: barrels of oil equivalent
bopd: barrels (bbls) of oil per day
bcpd: bbls of condensate per day
wpd: bbls of water per day
Gas
MMscfg: million ft3 gas
MMscmg: million m3 gas
Tcfg: trillion cubic feet of gas
Ma: Million years ago
LNG
Liquified Natural Gas (LNG) is natural gas (primarily methane) cooled to a temperature of approximately -260 oC.
NGL
Natural gas liquids (NGL) include propane, butane, pentane, hexane and heptane, but not methane and ethane.
Reserves and resources
P1 reserves: Quantity of hydrocarbons believed recoverable with a 90% probability
P2 reserves: Quantity of hydrocarbons believed recoverable with a 50% probability
P3 reserves: Quantity of hydrocarbons believed recoverable with a 10% probability
Oilfield glossary:
www.glossary.oilfield.slb.com


