An innovative new modelling workflow for reservoir characterisation has been developed that is capable of producing an advanced 3D geomodel of any subsurface zone of interest and can identify potential sand gas or oil zones that have previously lain undetected within a producing area.
Reservoir modelling requires the incorporation of data from various sources, along with the integration of knowledge and technical skills from a multitude of disciplines. Successfully incorporating 3D seismic data, in particular, is key to modelling any hydrocarbon field, as it provides critical insights into spatial distribution and various geological reservoir properties. Common challenges in hydrocarbon exploration and field development centre on the complexities and uncertainties embedded within the subsurface structure and associated formations, which may include structures such as channel bodies, beaches, dunes, turbidites, faulting and other associated depositional and structural features that need to be incorporated into the model.
Geomodelling workflow for the study.
In recent years geocellular reservoir modelling has therefore become an essential tool throughout the life cycle of any field. Continuing improvements in the algorithmic logic of subsurface petroleum geological software is always key to achieving greater accuracy in delineating potential prospects and fields. With this in mind, an advanced 3D geomodelling algorithm has been developed by Dimension Strata and has subsequently been successfully tested on several prominent hydrocarbon fields, most recently as a study on a producing gas field in Brunei.
This study deliberately used a very limited dataset, consisting of a single 3D seismic depth cube and one geological report, yet the geomodelling algorithm was able to accurately delineate probable structural features and identify prospective depositional geobodies within the field. It was decided to use a small dataset to demonstrate that it is possible to get useful interpretational outcomes using this method even for an area known to have limited data. The study demonstrates that using this workflow enables the modeller to geologically ‘guess’ the subsurface despite having a relatively small amount of data, allowing us to explore in challenging subsurface scenarios. It also found that by using additional information, such as well log data, in the existing geomodel, it was possible to successfully correlate and calibrate the results.
Facies Palaeo-Trend Modelling Workflow
Amplitude classification using Dimension Strata’s algorithm. Class IA is most prospective, Class III least prospective.
A two-phased approach was used for the study. Initially, a model structure was developed using lithological characteristics based on differences in seismic amplitude responses within the interpretational framework. This was followed by facies palaeo-trend modelling (FPTM), which uses a detailed trace-cell-analogue approach for the modelled grids of the reservoir, thus incorporating interpreters’ understanding of the subsurface geology within the workflow. FPTM comprises structural qualitative and quantitative geobody and reservoir geomodelling and incorporates interpreted layers such as 3D horizons and available faults within the 3D, ultimately giving a more advanced output in terms of cellular gridded models. In addition, a novel stochastic method was used along with Dimension Strata’s advanced 3D geomodelling algorithm, which provided considerably improved structural and 3D facies frameworks of the studied field.
The study combined volume-based modelling with Dimension Strata’s proprietary 3D seismic interpretation and reservoir geomodelling system, in which amplitude anomaly-based seismic interpretation, together with amplitude anomaly factor, are used to determine different amplitude classes for specific horizons and/or fault interpretation. Amplitude anomaly factor is a ‘patent-pending’ term used to describe the part of the new geomodelling workflow that is capable of building an amplitude classification database from 2D and 3D seismic data.
Geobody Modelling
Structural orientation of the interpreted horizons. © Dimension Strata.
Structural reconstruction was an important aspect of this study because it acted as the primary basis for the geobody modelling. The first step in creating a structural framework network was developed using the 3D seismic cube with interpreted seismic horizons. Utilising the new workflow, it was possible to grid the model to the surprising level of 50m2 per grid cell without any loss of resolution in the interpreted structural and geobody parameters across the entire 3D volume. Quality checks were rigorously applied during the modelling phases. The volume-based structural model was then used as a base for the final facies palaeo-trend modelling.
The potential reservoir zones were initially identified using integrated seismic analysis within the horizon modelling phase. This incorporation ultimately enabled the placement of the zone boundaries of all the modelled layers of the study field. Although the data provided for the study was limited to a single seismic cube, the present-day depositional pattern in the area and previously studied depositional settings were also used in the model to help develop the FPTM trend. This study was entirely based on the geometric inputs that control particular geobody shapes, such as thickness and width.
The facies modelling workflow for the studied reservoir followed three robust steps. During the initial stage, depositional bodies were generated using the FPTM algorithm, and this was followed by the definition of the boundaries of the interpreted geobodies. In the last step, the internal geometry and heterogeneity of the facies were developed in order to generate the final FPTM of the studied reservoirs.
Mapped Horizons
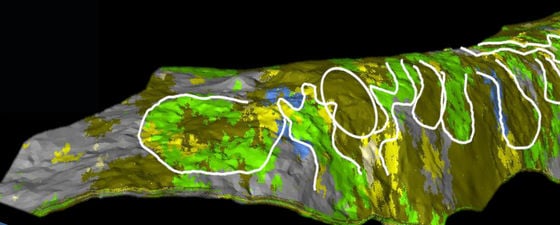
Facies dimensions and distribution within the modelled output of the field. The white solid lines represent potential siliciclastic sand or mixed clastics lobes, where the probability of sand is from 45 to 75%. White oval represents area of 90% probability of reservoir sands, modelled in those particular cells. © Dimension Strata.
Three horizons were interpreted for the study using the advanced geomodelling algorithm. A geodatabase incorporating seismic amplitude anomalies, along with amplitude normalised factor (ANF), calculated through the algorithm, was used to determine these target horizons. ANF is a module of the company’s OrbStrata software that uses a specific statistical formula to classify probability of occurrence of sand versus non-sand facies. The number is a unitless derivative from 0 to 1, in which lower fractions correlate to higher possibilities of shale/mudstone and higher fractions represent lower possibilities of shale. As the study was based exclusively on seismic data (in depth), this meant the determination of ANF helped to delineate probable lithofacies classes within the field. The application of amplitude classification, whereby amplitude from the seismic data is used to develop a lithology-specific classification, means it is possible to segregate potential lithologies while the seismic interpretation process is being performed. Amplitude class was developed for the study area based on the zone of interest and exclusively involves the classification within that zone’s boundaries.
Structurally, the reservoir zone, situated between the top and bottom reservoir surfaces, was interpreted to be devoid of any faults. It is a classic 4-way dip closure structure oriented roughly north-east to south-west and is thicker in the central part of the structural model and thinner either side. The average azimuth of the structure is N40°E.
Modelling the Target Zones
Seismic facies occurrence in different layers identified within the model. © Dimension Strata.
The algorithm uses a combination of sequential indicator simulation (for flexibility in defining different variables within the model), truncated Gaussian simulation, and the facies palaeo-trend modelling algorithm, to develop 3D seismic-based facies, putting more weight on the seismic amplitude anomaly in order to determine logical facies distribution spatially. The study was able to use all available modelling parameters, with only the use of seismic data in the depth domain. Taking into consideration the constraints set for the study, such as limited area and database, it is remarkable to note that the geomodels that it has produced accurately coincide with the known subsurface features of the target zone of the study field. Determining 3D geometries of the interpreted horizons was a key component of this study. As the facies and facies classes were directly related to the quality of the prospective reservoir zone, facies geometries needed to be carefully interpreted.
According to the facies associations and a review of previous research undertaken in this area, the study concluded that the prevalent depositional setting was an offshore deep sea fan environment. This was also evident from the seismic facies modelling. From the topmost surface of the target reservoir zone, it was evident that different sand facies were distributed in a fan shape along the south-west and south-east portion of the model.
The resulting model clearly describes the crucial changes in geometry of the facies, which potentially is of great importance for future drilling campaigns within the modelled zone. As can be seen in the figure to the right, potential sand deposits with a higher probability of containing hydrocarbons were present in Layer 5, especially in the south-west and central north-eastern part of the model.
The facies model has been compared to the known gas-water contact (GWC) for the studied zone and found to be consistent with it, paving the way for hydrocarbon exploration and development within the facies above the GWC level. Applying the major interpretational modules of the new algorithm, the depositional facies above the GWC were found to have a high probability of a sand percentage of over 45%, based on the seismic amplitude anomaly identification and from interpreted attributes.
The spatial distribution of the potential sand facies derived through this workflow has been interpreted and the overall interpretation of the different probabilities of sand occurrence within the model suggests that P50 and P60 sands (i.e. the probability of the occurrence of potential siliciclastics) are more likely to occur within the middle layers, whereas P70 and P80 sands are found in the deeper layers of the model and P90 sands within the middle and upper layers of the model.
Advanced Geomodelling Workflow Shows Potential
This advanced geomodelling workflow equipped with facies palaeo-trend modelling has been tested on several prominent hydrocarbon fields and prospects in the Asia Pacific region and has demonstrated great potential to help resolve complex depositional facies interpretations, with substantially improved exploration outcomes.
Advertisement