Natural fracture networks are not created equal. In a tight reservoir, they may enhance the permeability and give production an upside. In a porous reservoir, a natural fracture network may connect to water, in which faults and fracture zones may want to be avoided. In some reservoirs, the fractures may be insignificant to operations and production. But how can we know which of these scenarios might ring true for your reservoir? Integrating the right datasets is critical to understanding the impact, or lack thereof, of natural fracture networks.
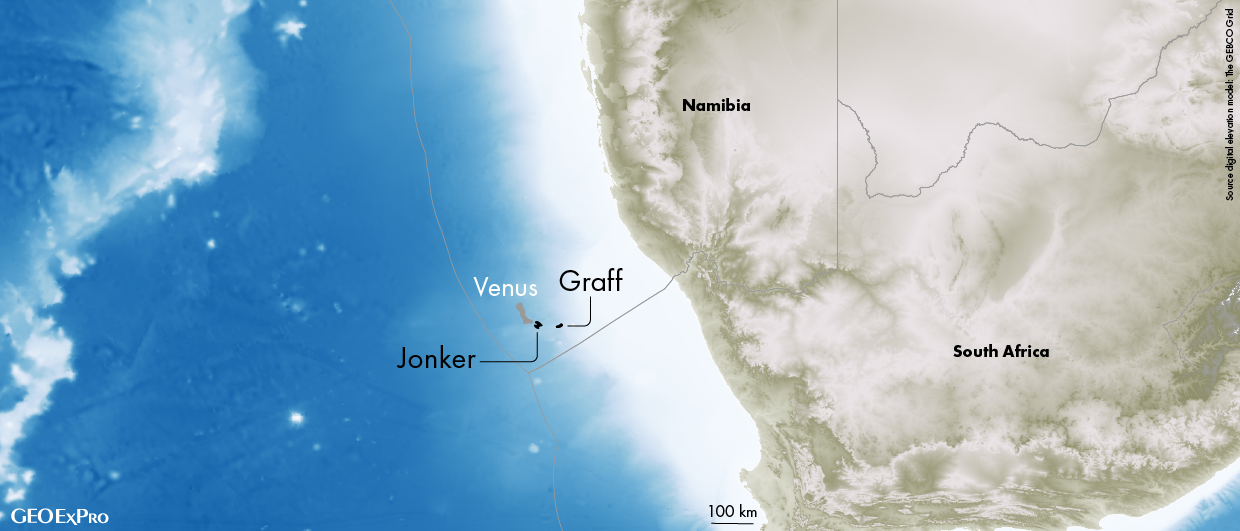
A recent analysis on a vertical data well in the Delaware Basin allowed us to understand the impact of an open natural fracture zone on an interval we were appraising. Data from this well includes 600 feet of continuous core, petrophysical, image, and geomechanical logs, along with 13 in situ pressure gauges spanning 2 horizontal target zones. The core fracture analysis captured the fracture type, density, adherence, mineralisation, and height (when possible). This information is posted in column 3 of Figure 1.
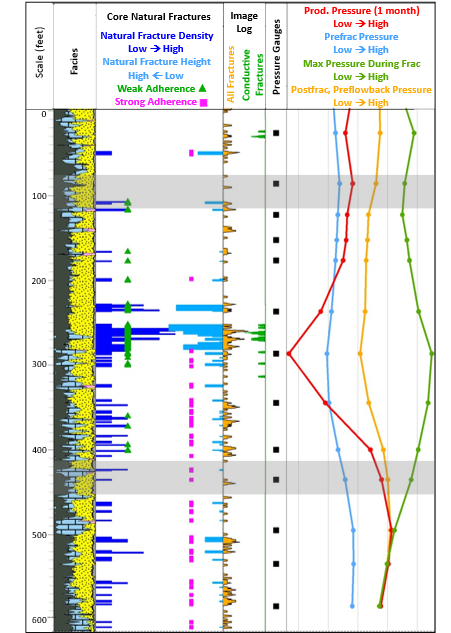
The dark blue bar chart indicates fracture density and the light blue shows fracture height. A large majority of these fractures were Mode I (opening mode). Adherence refers to how strong the mineral bond is to the matrix wall. In other words, is the fracture nicely welded or does it split easily. A weak adherence may suggest partial mineralisation, and hence greater fracture permeability. It may also indicate that upon hydraulic stimulation that existing natural fractures will be easier to prop open (vs creating new fractures). Strong adherence may suggest a stronger bond and less permeability. In column 3 of Figure 1, weak adherence is indicated by a green triangle and strong adherence is indicated by a pink square.
Download Issue 4 of the GEO EXPRO magazine and read much more about the subsurface aspects of the energy sector.
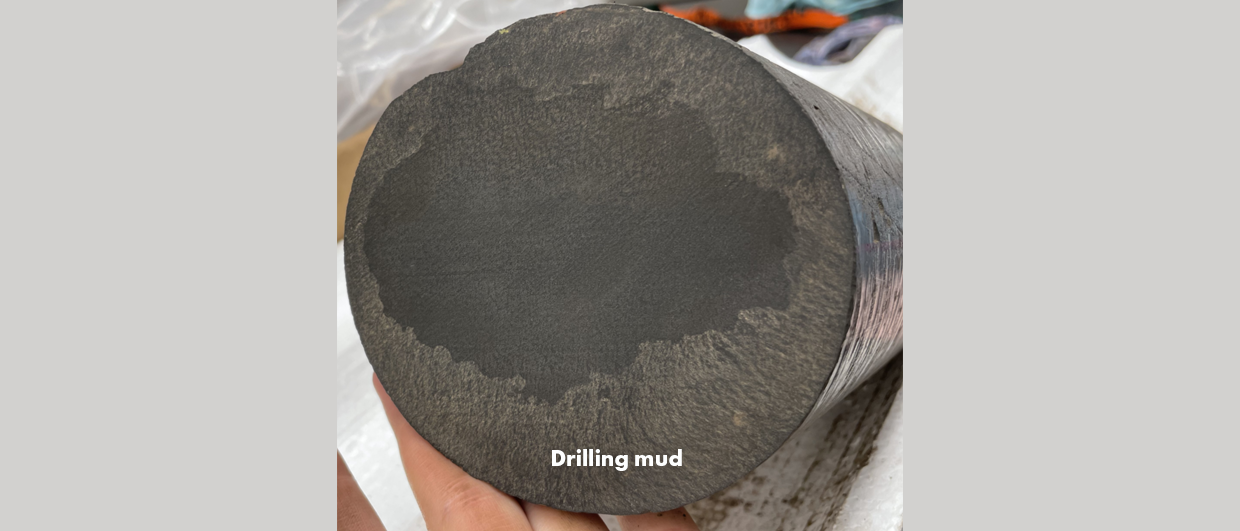
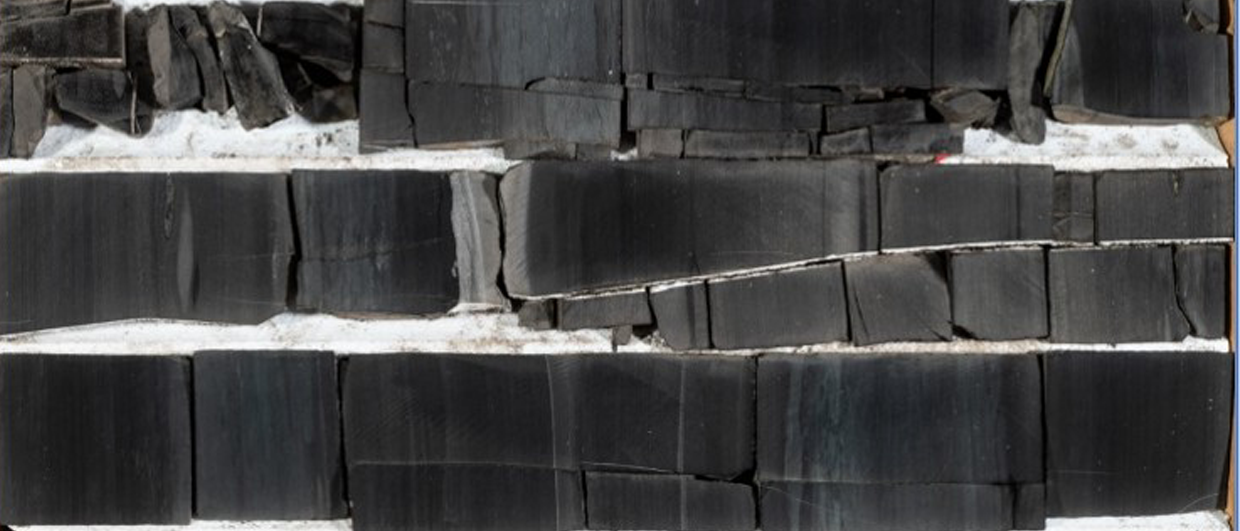
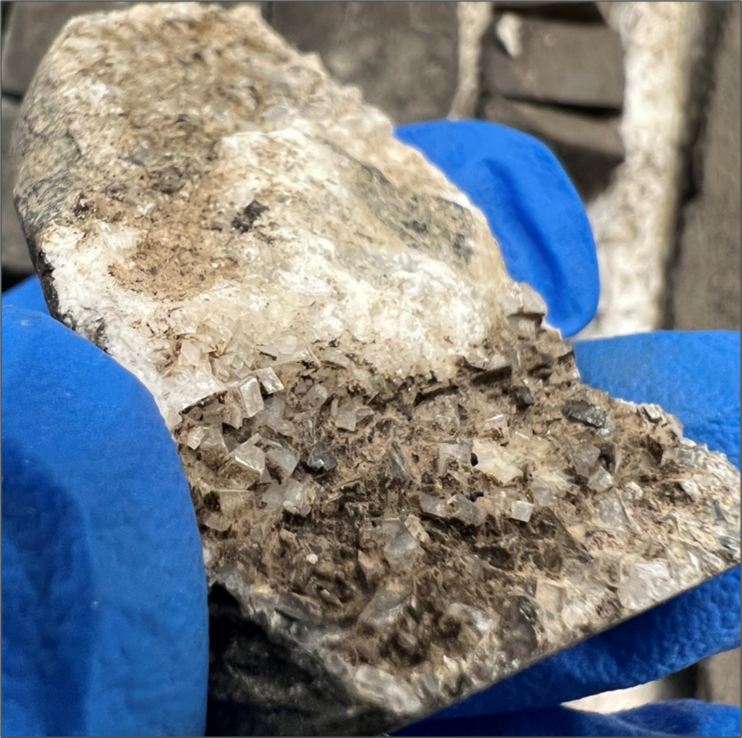
Additionally, the large open fractures in the core showed blocky rhombohedral calcite mineralisation indicating an open flow history versus a crack-seal closed flow history (Figure 2). These open fractures coincide with conductive fractures (open) observed on the image log (Column 4). Column 2 in Figure 1 shows the petrophysical facies log. It’s possible that the strong adherence in the lower half of the core is due to a more carbonate-rich facies saturating the fluids within open fractures resulting in more complete calcite mineralisation.
Pressures say it all
The biggest takeaway comes from analysing the 13 pressure gauges within the cored interval while nearby wells were being hydraulically fractured and produced. Column 6 in Figure 1 shows pre-frac pressure (blue curve), post-frac pressure pre-flowback (orange curve), maximum pressure during frac (green curve), and reservoir pressure after one month of production (red curve) from nearby wells. A highly fractured zone exists near the center of the core (Figure 2a). The pressure gauges adjacent to the highly fractured zone show anomalously low pre-frac pressure (blue curve) but the highest pressure increases during the frac (green curve). We attribute this to the fracture network being depleted by nearby parent wells, then rapidly repressurised at the start of child-well fracs. However, once the child wells were brought online, we see the highest drawdown through this zone after one month of production (red curve).
We’ve concluded that the highly fractured zone has a high order of control on the vertical drainage profile through this portion of the stratigraphic section. In contrast, the lower three pressure gauges (between 500-600 and where fracture adherence is strong), show that the producing pressure lacks any significant drawing down indicating that we are not seeing a contribution from this zone. Between the accelerated production from the fracture zone, and lack of contribution in the deeper zone, we conclude that understanding and quantifying the performance impact of the fracture zone is helping inform optimal targeting and development strategies for the asset going forward along with helping to reduce any depletion risks related to open fracture networks. The results from this vertical data well are a great example of how valuable it is to collect and integrate multidisciplinary data and expertise to help asset teams optimise operations and production for years to come!
Brendan Elliott, Sloan Anderson, Jarrett Borell, Jon Roberts & Zak Ward from Devon Energy, Oklahoma City, OK, USA also contributed to this article.