The evolving role of seismic reflection data within offshore site investigation.
Marine site investigation is, at heart, about reducing risk. Sometimes it involves minimizing the risk to operations posed by UneXploded Ordnance (UXO), shallow gas, and/or unexpected ground conditions. Other times, it mitigates the design risk for subsequent infrastructure, such as wind farm monopiles, by providing enough relevant information about the nature of the subsurface to ensure the design is appropriate for the entire installation lifecycle. Alternatively, it can simply involve reducing financial risk, such as ensuring the aggregates being targeted for extraction are a profitable resource.
At the core of these investigations sits seismic reflection data, a key methodology that is utilized across all manner of site investigation projects worldwide. Relatively cheap and fast to acquire when compared to intrusive sampling techniques, seismic reflection surveying offers the ability to image the seafloor and subsurface structure continuously in 2D or 3D over large areas and at a high fidelity. By combining multiple different seismic methods, it is possible to blend data with different resolutions and penetrations, providing both sub-meter-resolution imaging of the shallow subsurface and lower-resolution penetration of the full top-hole section, as required.
Are We Maximizing Data Potential?
As is the case within all industries, however, one must always be asking the question: are we getting maximum value from the techniques being employed?
This question has been posed many times in recent decades with regard to the seismic reflection data acquired as part of site investigations, primarily because the output from the geophysical part of a site investigation that feeds into subsequent design and/or risk mitigation phases is somewhat limited. For hazards, such as UXO or shallow gas, this often takes the form of a presence/absence map, with limited information regarding the dimensions of the potential UXO or the gas saturation within a possible gas front. When predicting ground conditions, the output from the seismic reflection interpretation commonly takes the form of a simplified ground model, mapping the depths of key interfaces, facies thickness variations and key structural features such as faults.
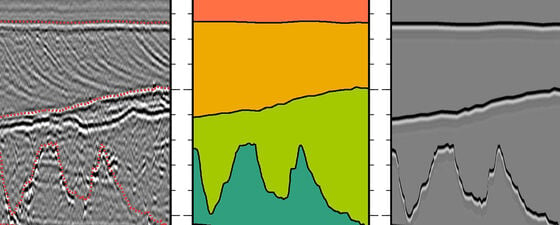
A boomer seismic reflection section from a wind farm site survey. The seismic profile is overlain with an example interpretation of major facies boundaries, along with a ground model constructed using these. To illustrate how little of the complex, subtle detail on the original seismic reflection profile is communicated in this ground model, a synthetic seismic section generated using only the major facies boundaries is also shown (right). It is clear that, unless engineers and project managers look at the seismic data, a huge amount of potentially useful information may not be communicated into the later phases of a project. Data courtesy Crown Estates.
In reality, the seismic reflection data contains much more detailed information about the nature of the subsurface. Variability in the amplitude, phase, and architecture of the reflections provide extremely useful first-order information on the nature of the sediments comprising the subsurface, under what conditions they were deposited, and how they may have been deformed post-deposition. Changes in bedding and post-depositional deformation are captured both across major facies boundaries as well as the, potentially more subtle, internal patterns within each facies.
The latter information can be particularly pertinent as it provides a direct indication as to how the properties of a particular facies might vary across a site. Within the aggregates and offshore mining industries, such information can be critical in assessing the financial viability of a deposit, characterizing it as a 3D (or pseudo-3D) rock volume. For offshore construction projects, the variability of ground conditions within each facies is important for both health and safety decision-making, such as understanding the differential loading profile between jack-up rig locations, as well as the engineering design. For cable and pipeline installation projects, understanding spatial variability in the shallow geology is critical in route planning to maximize cable performance and identify the correct trenching tool(s) for installation.
Can We Communicate Better?
These features of seismic reflection data are a key piece of information used by the seismic interpreter when building a seismostratigraphic model, aiding the interpreter in deciding where the major facies boundaries are located and how those facies relate to each other (e.g. is the boundary conformable or unconformable?). While an experienced interpreter will combine all this information into their decision-making process, it commonly does not move beyond that interpreter’s desk. Observations and example images of this complex seismostratigraphic architecture are often included in the seismic interpretation and geological ground model reports, but not in a manner that effectively consolidates all the information available into an easily communicable form that can be digested by project managers and engineers working on subsequent project phases.
As such, there are obvious and significant benefits to the wider project if this more subtle and complex information can be better communicated, ideally at a higher level.
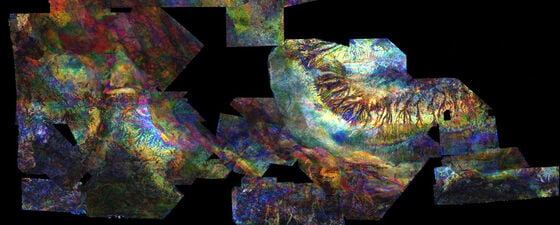
Chart of rock quality metric for a marine aggregates area, estimated using seismic attributes (warmer colors indicate greater resource potential). The rock quality data is overlain by deposit thickness contours, illustrating the complex relationship between thickness and quality of the deposit; thicker deposits do not necessarily make the best extraction targets. The combination of these data permit project managers to efficiently make well-informed, high-level decisions about the resource potential within a prospect area and whether it is financially viable.
One potential solution is to use seismic attributes that can enhance specific variations in seismic architecture, providing a clearer distinction between seismostratigraphic facies with contrasting characters (likely, therefore, to have different material properties) as well as capturing the more subtle spatial changes within facies with similar characters. A wide range of seismic attributes can be derived from both 2D and 3D seismic data, some of which are based upon the physics of the seismic wavefield (e.g. instantaneous frequency, average energy), while others are derived from image analysis techniques (e.g. edge detection, seismic texture). The correct attribute(s) to use will vary between projects, depending on the nature of the geology being imaged and the features to be highlighted.
These methods are widely used in the hydrocarbon sector to help identify and characterize potential features of interest, like gas channels, salt or fault structures, but have yet to see widespread use within the site survey sector. However, the potential is significant, particularly for the effective communication of geological complexity into the later project phases. Not only do such attributes more effectively highlight key features of interest on seismic sections, which often appear confusing to non-specialists, but many also readily lend themselves to being efficiently summarized. For example, using a combination of attributes that highlight the chaotic and high amplitude reflections from a heterogeneous, aggregate-rich substrate can be used to both better constrain the thickness of such deposits (often hard to interpret on seismic reflection sections) as well as the variability of the heterogeneity, which indicates resource potential. Both these features can be easily summarized as charts, providing a high-level communication of relatively subtle detail within the geophysical dataset that would otherwise not have been used.
Be More Quantitative?
One significant limitation of such properties, however, is that they are not truly quantitative. In the aggregate example described, it is assumed that more heterogeneous facies have a better resource potential, but the actual resource potential in terms of grain size distribution and volume fraction of viable aggregates is not derived. Such questions regarding deriving more quantitative information from site investigation geophysical data have been posed for many years, in particular related to deriving geotechnical properties that are useful for infrastructure design and installation.
A Chirp sub-bottom profiler section across a controlled carbon dioxide injection site. Seismic amplitudes are overlain with a free gas potential metric derived using seismic attributes. Warmer colors indicate a higher potential for free gas being present in the shallow subsurface, which highlights not only stratigraphic levels where free gas may have accumulated (e.g. horizon H2), but also, potentially more importantly, vertical gas migration pathways, which here can be seen to extend right to the seafloor (SF), crossing the two main subsurface stratigraphic horizons (H1 and H2). Data courtesy of University of Southampton QICS project.
Generally, extracting quantitative information regarding the nature of the subsurface from seismic reflection data is classified under the umbrella term ‘seismic inversion’, which contains a smorgasbord of different techniques/methods to derive estimates of the subsurface properties from the recorded seismic data. While the inversion of exploration-scale data for reservoir characterization has been relatively common for decades, the inversion of site survey data has been slow to catch on. In part this is because site survey geophysical data does not lend itself readily to inversion, often suffering from noise contamination (due to smaller source sizes and shallow tow depths) and recording a more limited representation of the seismic wavefield because of the smaller offset ranges and lack of low frequency content. In addition, the properties that are of most interest to site investigation applications, like grain size, gas saturation and relative density, are related to the recorded seismic reflection data in a very complex, non-linear manner that is, in the case of the more advanced geotechnical properties, site specific.
A sparker ultra-high resolution profile from an offshore wind site investigation at a geologically complex location that has suffered multiple periods of glacial loading/ reworking, along with the measured and blind predicted CPT tip resistance curves. Shaded gray region is the confidence range of the blind prediction, black line is the ‘best’ blind prediction, and orange line is the independently measured values. The dashed green lines show the tip resistance envelope predicted using a traditional geostatistical approach. The ML prediction effectively captures all the large-scale structure along with some of the higher fidelity layering, significantly outperforming the geostatistical results in such a geologically complex and challenging setting. Data courtesy Netherlands Enterprise Agency.
Together, these make the problem computationally challenging, but recent advances in computing power and algorithms mean they are not insurmountable. Casting the inversion within a stochastic framework, which searches a broader range of potential solutions, provides a more robust solution that has been reliably applied to all manner of site investigation data, from single-channel sub-bottom profiler to 3D ultrahigh-resolution multi-channel seismic volumes. While it is still not possible to cast these inversions as a one-stage prediction of geotechnical properties, optimization algorithms that mimic natural processes, such as Genetic Algorithms or Simulated Annealing, allow bulk physical properties (e.g. acoustic impedance, bulk density, porosity, Poisson’s ratio) to be derived with confidence. Combining these results with modern machine learning (ML) techniques capable of solving highly complex, non-linear problems, it is possible to make predictions of the geotechnical properties from these bulk properties. Particular success has been had when using these methods to generate synthetic CPT profiles at specific sites of interest, allowing the core geotechnical parameters (undrained shear strength and relative density) to be generated using a standard engineering workflow where they are most needed.
An immensely useful additional feature of casting the quantitative process within such a stochastic/ML framework is the ability to estimate confidence intervals. As the initial conditions of these algorithms are random (or at least pseudorandom), multiple independent runs with the same input data will provide subtly different predictions. Therefore, combining the results from multiple runs provides the interpreter with a useful tool to understand whether the inversion is stable as well as capture an estimate of the uncertainty in the final prediction. For infrastructure design and installation applications, the potential of such information cannot be understated.
The Way Forward
This article has looked at some of the ways in which the use of seismic reflection data for site investigation applications is evolving. Its role is changing from being a simple facies boundary interpretation tool, into something that effectively contributes across all phases of a project cycle, capturing and communicating information on the variability of the ground conditions, both qualitatively and quantitatively. The potential of these and similar techniques has garnered significant interest across all sectors of the offshore site investigation industry, making it an exciting time for marine near-surface geophysics.
References
S. Chopra and K.J. Marfurt, 2007. Seismic Attributes for Prospect Identification and Reservoir Characterisation, SEG.
G. Sauvin, M. Vanneste, M.E. Vardy, R.T. Klinkvort, and C.F. Forsberg, 2019. Machine learning and quantitative ground models for improving offshore wind site characterization, OTC-29351-MS.
M.E. Vardy, A.W. Hill, and K.J. Campbell, 2017. An Emerging Tool in the Site Investigation Toolbox, Sea Technology, September 2017.
M.E. Vardy, M. Vanneste, T.J. Henstock, M.A. Clare, C.F. Forsberg, and G. Provenzano, 2017. State-of-the-art remote characterisation of shallow marine sediments: the road to a fully integrated solution, Near Surface Geophysics, 15, 387-402.