“Off-white, grey, quartz-rich, some occluded quartz and kaolinite.” Simon Molyneux cites the description of a cutting sample from a composite well log, which is thought to represent an interval of around 200 m in a well. “It is these subjective descriptions that won’t take us very far when we want to have a better understanding of colour changes along the wellbore,” he says.
“Subtle colour differences can reveal a lot about changes in depositional environment or changes in sediment input. It’s one of the reasons why we have developed our Grain-e technology,” Simon adds.
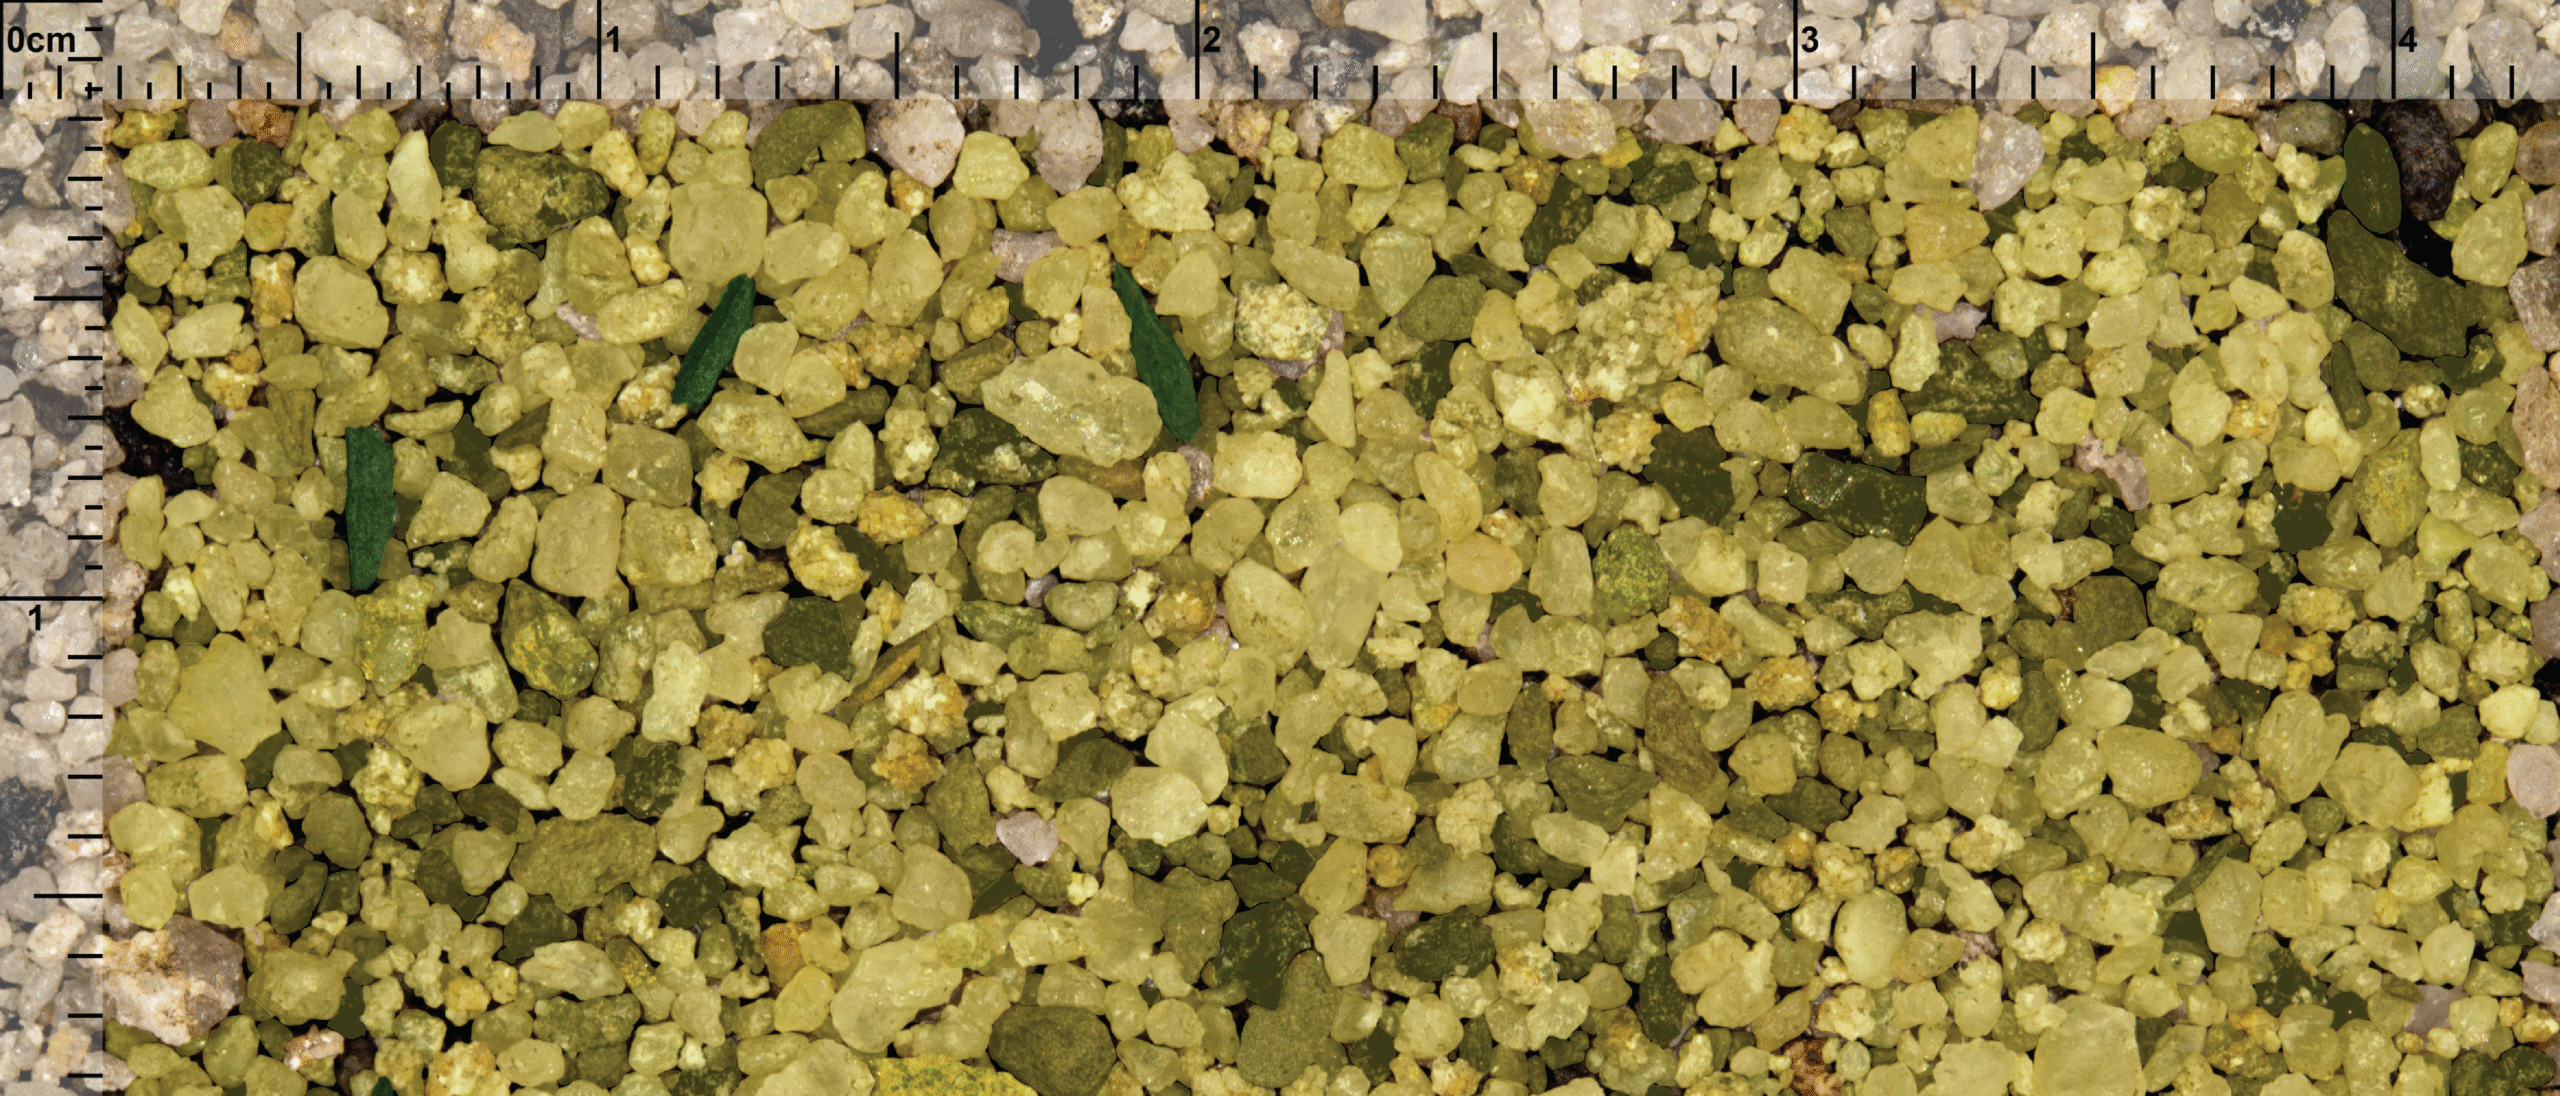
The material required to analyse all cutting samples for an entire well fits in one shoebox. Once selected, project partner RockWash do the processing and imaging in high resolution. Then, the Grain-e AI-powered scanning software comes in, which is not only capable of capturing colour, but will also analyse each particle at the same time, offering lots of additional opportunities. One of the most important ones is grain size and its derivatives, such as roundness and length.
“There are several fields where this type of information is key,” says Simon. “For instance, we already ran a project with a client to design the mesh size for their completions, based on the grain size measurements obtained through our technology. It is a good complement to particle size analysis that is usually done on cores only.”
Some people argue that there are contaminants in the cutting samples, such as lumps of rock consisting of cemented grains or cavings. “Our technology enables filtering these out, and only retains moveable grains for further analysis,” says Simon. “In this case, movable grains mean the grains that could move into the wellbore during production.”
The identification of cavings in the images is another aspect that can help reconstruct of overpressured zones. “Admittedly, this is not something we will do real-time, but what it allows us to do is to identify zones where overpressure went undetected. Also, because we assess the colour of these cavings, we can even reconstruct the depth from which they come based on colour matching,” Simon says.
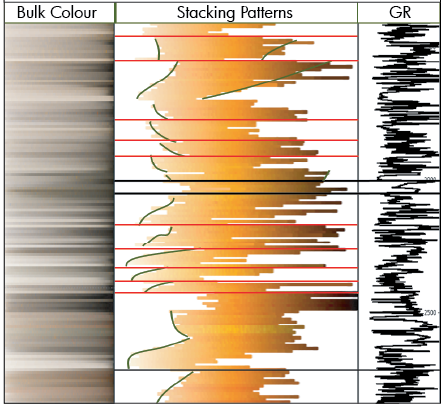
“Well log correlation and identification of sequence stratigraphic boundaries forms yet another application of the way colours can be used now,” concludes Simon. He points to a Gamma-ray log showing what looks like a fairly homogeneous succession, until the colours are plotted alongside, showing a clear trend at a certain position in the well that now turns out to be a maximum flooding surface. “It adds another useful tool to apply sequence stratigraphy and better predict facies changes away from the well.”
In other words, Grain-e enables the identification of features in the well that were previously undetected or were not quantified, helping completion design, stratigraphic analysis, and more. And that for only one shoebox of samples per well. It’s time for some more chromostratigraphy.