Increasing the chance of success
Used together, IP data and 2D broadband seismic can be very useful de-risking tools to help assess the Geological Chance of Success.
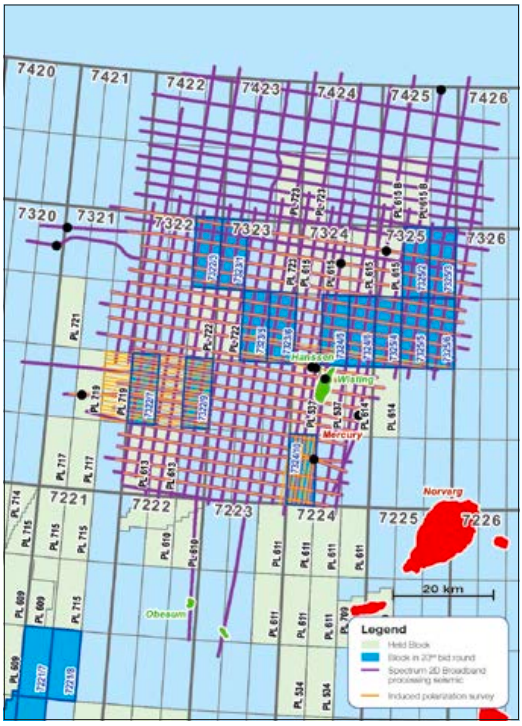
In the Hoop area of the Barents Sea, 14 blocks are included in the Norwegian 23rd licensing round, which was announced in January 2015. Induced polarisation (IP) measurements along with 2D broadband processed seismic, which has been pre-stack inverted, have been acquired tying all wells in the area, as seen on the map above (Figure 1). The data can be used for an interpretation of all recently announced blocks in the round, including the prospective Jurassic sequence with the recent Wisting discovery, the Triassic and to some extent the Permian/Carboniferous, largely de-risking any identified leads and/or prospects.
Data acquisition and processing
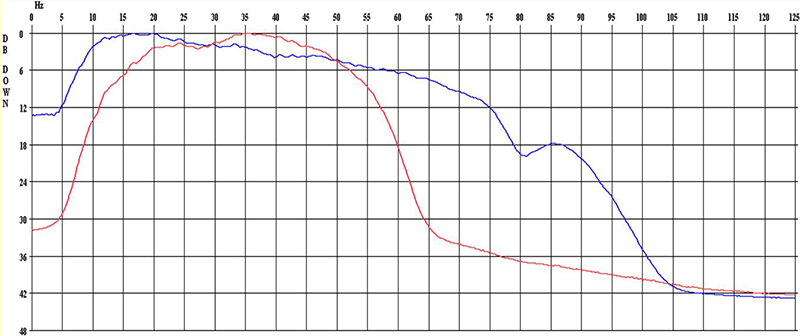
The 2D conventionally acquired seismic has been processed using broadband seismic technology through a de-ghosting and de-bubbling processing sequence, which ensures a high resolution image compared to conventional processing, adding 5 Hz to the low frequencies and 10–15 Hz to the high frequencies. This helps to facilitate a more detailed stratigraphic interpretation. A frequency comparison between conventional and broadband processing is illustrated opposite.
Acquiring the seismic with 8 km streamer makes the data suitable for pre-stack inversion which, tied to well log data, can be used to derive rock properties over key parts of the geological section for a more detailed interpretation of reservoir parameters. Coinciding with selected 2D broadband seismic sections, IP has been acquired using an electric transmitter, with the resultant induced polarised field measured using towed streamer receivers.
The main mechanism behind IP is micro-seepage from hydrocarbon reservoirs causing a chemical reaction in the rocks above the reservoir, creating a disseminated pyrite body (see Polarising Pyrite). These alteration zones display anomalous electrical polarisation properties (higher chargeability than the surroundings), which can be measured and which point to deeper lying hydrocarbon accumulations.
Geological chance of success
For prospect mapping and evaluation the Geological Chance of Success should be assessed, which consists of assigning fraction probabilities to the following parameters:
- Structure × Reservoir × Charge × Retention = Geological Chance of Success
Each geophysical method can add certainty to the four parameters and ideally independent and complementary measurements will increase (or decrease, depending on the results) the individual fraction probabilities and therefore the overall Geological Chance of Success.
Seismic data is a strong indicator of structure, especially with the enhanced bandwidth due to broadband processing. It can also be an indicator, though weaker, of charge through gas chimneys as well as of retention through flat spots, velocity pushdown, and frequency and amplitude brightening/dimming. Whereas seismic data is not a strong indicator of reservoir parameters, pre-stack inversion calibrated to well log data is a strong indicator of, and can provide, reservoir porosity and thickness information but also some indication of structure. Vp/Vs inversion results may also be an indicator of retention, as fluids can be detected in the reservoir, and of charge, in case hydrocarbons can be predicted.
By contrast, IP data is a strong indicator of structure as the anomaly in general coincides with the field outline and indirectly points to the presence of a reservoir. It is an indicator of charge, as hydrocarbons often contain sulphur, which is one of the constituents involved in the generation of pyrite. Finally, IP does not provide any information on retention, as all hydrocarbons may have leaked out and through this process produced the IP anomaly.
IP has been used for the past 13 years for hydrocarbon exploration and de-risking, with 40,000 km of data acquired both onshore and offshore and more than 200 wells tied with a prediction rate of approximately 90% (predicting a discovery or dry well correctly). On the Norwegian Continental Shelf alone, more than 4,000 km of data have been acquired, both pre- and post-drilling, in the period between 2012 and 2014. The outcome of pre-drilling IP data acquired over 13 well locations shows 11 correct predictions (both dry and discoveries). Complementing seismic data and derived products, IP measurements are proving to be very valuable, providing significant input to the estimation of Geological Chance of Success.
Hoop Area
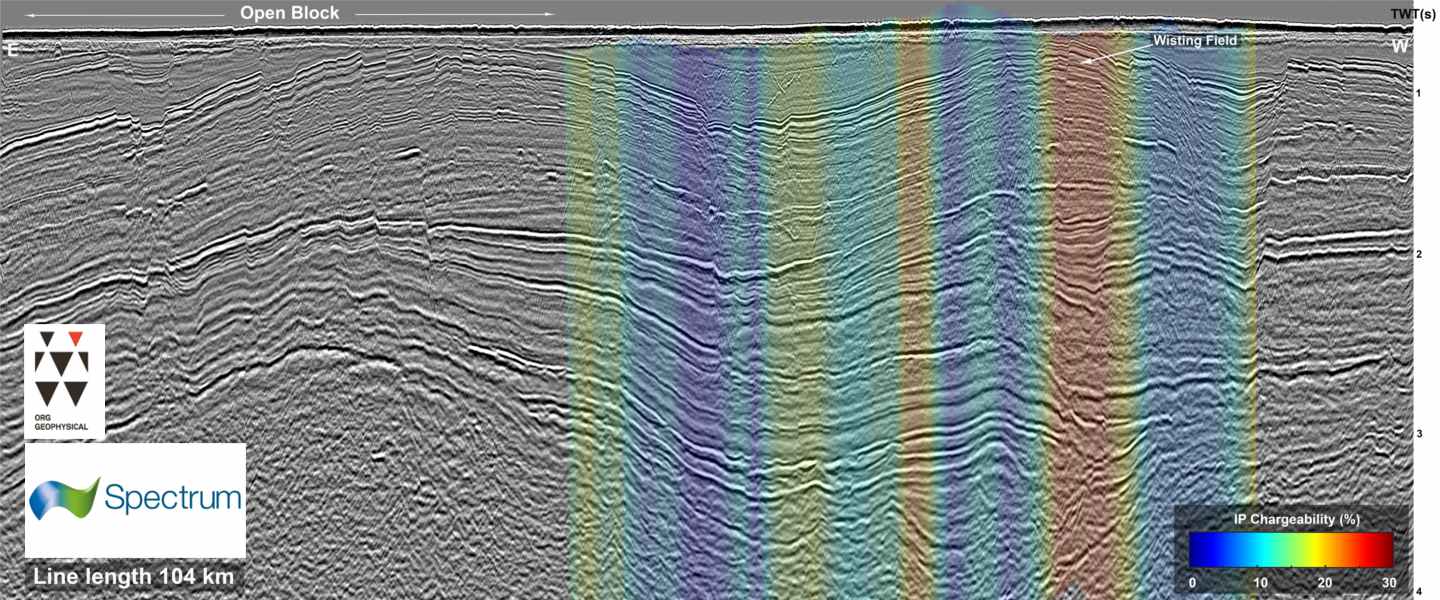
2D broadband seismic and IP data intersect the wells in the Hoop area, including recent wells such as Wisting, Apollo and Atlantis (Figure 1). This makes it possible to evaluate the acquired data and assess the reliability of IP measurements in predicting the possible presence of underlying hydrocarbon accumulations. The IP results on a selected east-west line show a chargeability anomaly which correlates well with the Wisting discovery and the general width of the field outline, as can be seen on the seismic panel above.
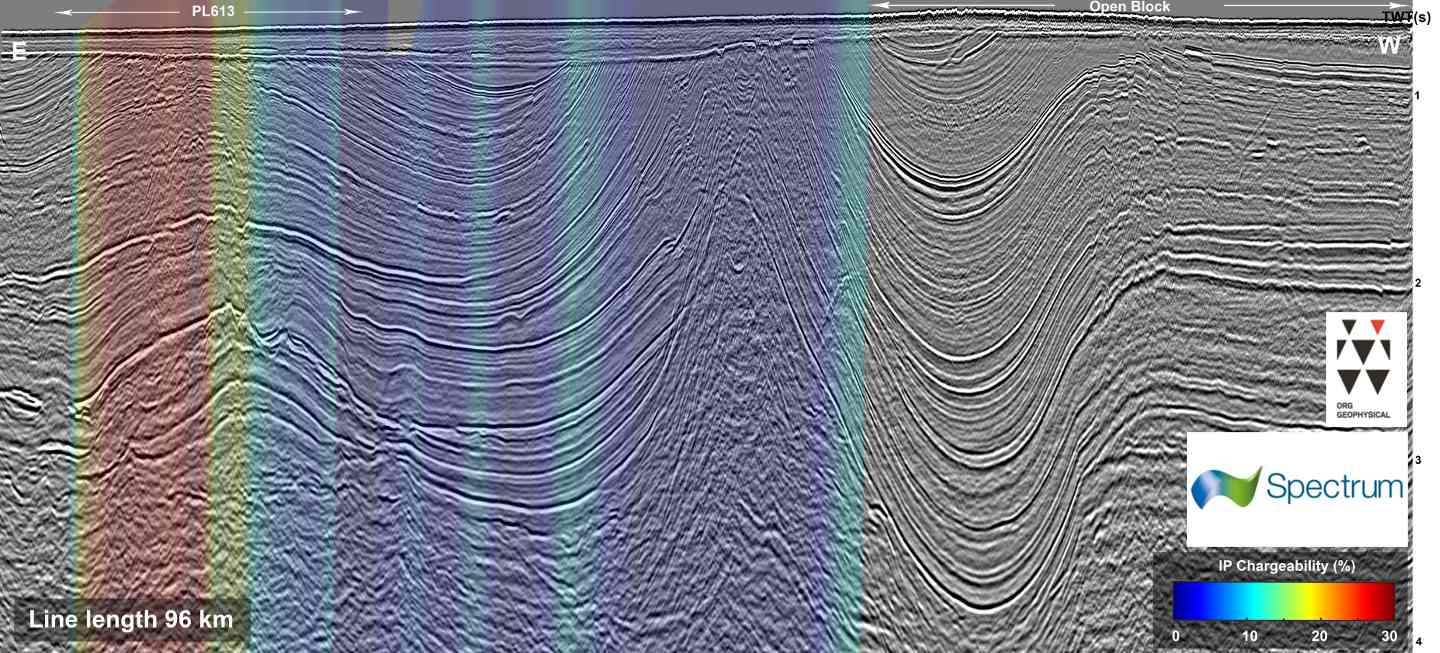
Other prospects in the Hoop area may be identified, as illustrated on the 2D broadband processed seismic and IP results, acquired as an east-west line across licence PL613, which display a very strong IP anomaly. The seismic shows an associated 4-way closure which is clearly identified and thus pointing to the outline of a possible underlying hydrocarbon accumulation (see main seismic ‘foldout’ panel, above). Weaker and more localised IP anomalies further east on the line could be associated with faulting and sub-cropping units with possible hydrocarbon migration into the overburden.
Together, IP data and 2D broadband seismic could be very useful de-risking tools used during the 23rd licensing round to either help increase the Geological Chance of Success, when an IP anomaly is present, or lower it when it is not present. In both instances the Geological Chance of Success will be more reliable, ensuring both the right ranking between prospects as well as the right CAPEX investment.