Unifying offshore Brazil: from the Abimael propagator to the Abrolhos Islands
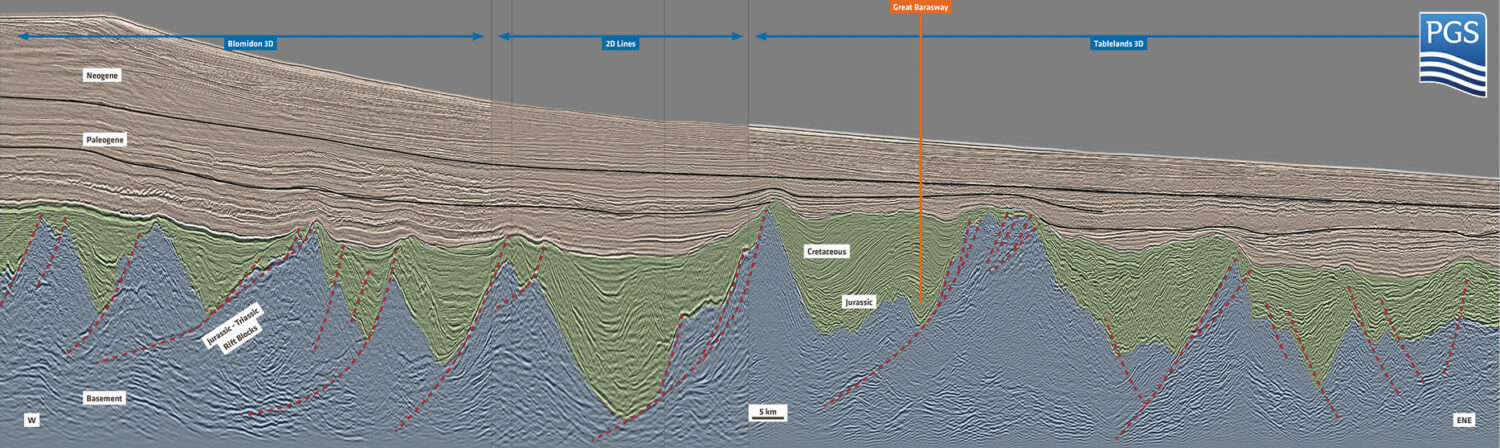
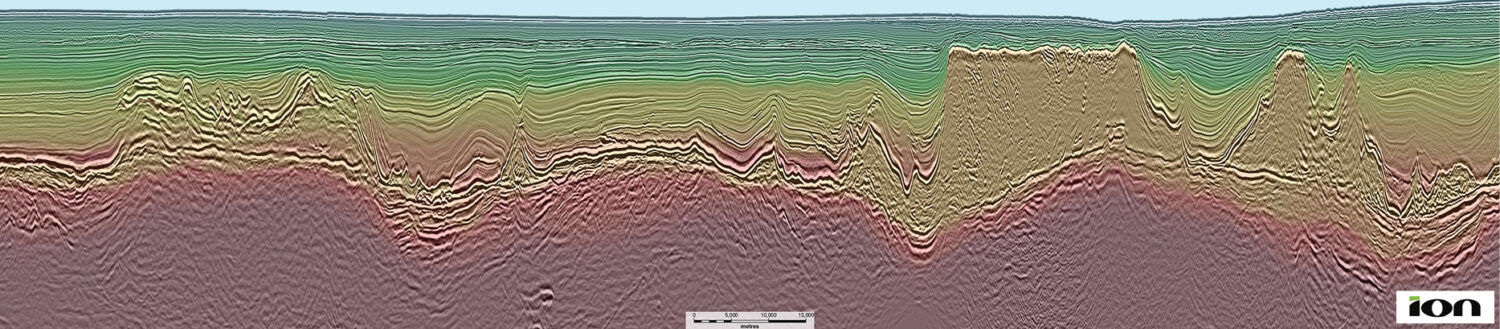
Figure 1A: Regional map with red line cross-section location. 3D processing integrates regional seismic, offshore Brazil The new Picanha 3D dataset provides the ideal foundation for an exploration and production…