Geophysics must change – but it must also remain meaningful.
“Geophysical data are a part of everything that we do,” Stephen Greenlee, president of ExxonMobil Exploration Co., told a roomful of people gathered for the opening session of the Society of Exploration Geophysicists International Annual Meeting. Whether we are picking a spot to explore, drill or bid on a block, deciding whether to continue an infill drilling programme or sanction a project, as he says: “It all relies on geophysical data.”
The amount of data collected from land and marine seismic surveys has grown considerably in recent years. A land seismic survey conducted in 2005 had 400,000 traces per km2; by 2009, that number had reached 36 million. In 2018, an ultra-dense survey, with 72 million traces per km2, was acquired onshore in Egypt. Between 2005 to 2009, the average volume of data gathered on an eight-hour shift grew from 100 gigabytes to more than 2 terabytes.
The problem that many companies are facing is that as the volume of data has increased exponentially, the timelines for delivering results has compressed.
Leveraging Artificial Intelligence for Big Data
In an industry requiring ever more rapid decision-making, six to eight months interpretation time can no longer cut it. It has become clear that it is not just a matter of running faster or working harder; the key to success is working smarter and more effectively. Today’s oil patch often demands almost instant opinions and interpretations of new data – how can geoscience feedback be provided whilst remaining an accurate and reliable answer?
Machine learning and artificial intelligence (AI) are being leveraged to tackle the big data issue successfully in many industries, including oil and gas. This new technology is now being utilised to enhance interpretation workflows, enabling rapid, unbiased and comprehensive understanding of prospectivity.
AI Driven Geophysical Software
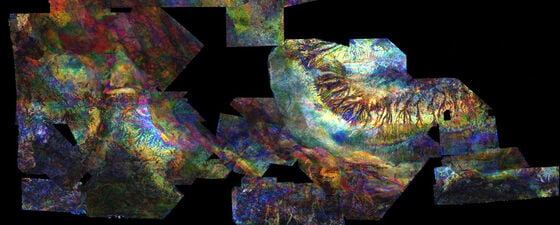
Figure 1: Selected GeoPopulationsTM generated within 24 hours from the original seismic data. © EPI.
Case studies and experience show that an interpreter may spend up to 60% of their time picking horizons and the remaining 40% actually thinking about the geological significance of the result. Seisnetics is an AI-driven software that addresses this issue by applying genetic segmentation and gene sequencing techniques, pre-interpretation, to analyse single or multiple seismic data volumes, significantly accelerating the interpretation workflow. The software selects random waveforms as seed points within the 3D volume to initiate unbiased processing, resulting in the generation of geopopulations (groupings of genetically similar waveforms) for virtually every peak and trough in the volume (Figure 1). The resulting spatial database is fully queryable and can be visualised either within the software’s specialist 3D viewer or the interpretation software of your choice.
With the mechanics of picking horizons fully automated, the interpreter has much more time to focus on the geological and geophysical significance of the horizons. This methodology empowers the interpreter throughout the E&P cycle, from rapid new ventures screening of large datasets and prospect identification, through to the optimisation of well locations and modelling of existing fields.
The power of Seisnetics for fast and accurate identification of seismic features was tested on the Depth SEAM SEG GoM project. (SEAM Phase I addressed challenges of subsalt imaging – see GEO ExPro Vol. 15, No. 4 for more information on the project.) It took 20 minutes to download the data, 11 minutes to run the software, and just a single minute to find the hidden ‘surface’ of the SEG logo below the salt.
The process facilitates strategic data mining and integration of other relevant information such as well and production data. This enables much larger volumes of geophysical and geological information to be integrated into the decision-making process, quickly creating value, as the following case study demonstrates.
Seisnetics Case Study: Eastern Niger Delta
Figure 2: Identified gas accumulations. © EPI.
The case study is located in the Rio del Rey Basin of Cameroon, a sub-basin of the Eastern Niger Delta system. The area is a mature petroleum system with over 1 billion barrels produced to date, mainly from shallow deltaic reservoirs, with exploration focused on structural traps over the crests of diapirs and toe fold structures.
The case study area was previously operated by supermajors, who made several marginal discoveries in shallow reservoirs. The area is characterised by challenging seismic data and complex structures, such as mud diapirs, multiple phases of faulting and the previously mentioned toe folds, as well as complicated stratigraphy, including shallow water deltaic reservoirs, incised valley fill and deeper water turbidites.
The current operator is planning to drill a new exploration well in 2019. The aim of this study was to leverage the power of Seisnetics to rapidly identify potential follow-on targets for subsequent drilling programmes.
The initial pre-interpretation processing of about 200 km2 of 3D seismic was completed in less than 24 hours. The first data QC highlighted a number of stratigraphic features (channels and fans) which represent reservoir targets and possible structural and stratigraphic trapping configurations, as well as multiple potential gas accumulations.
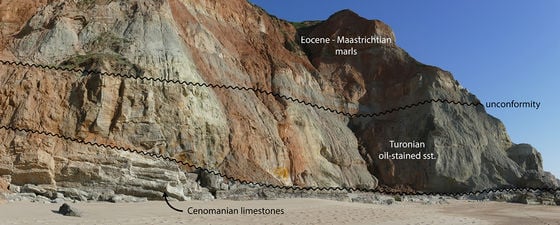
Figure 3: Potential satellite targets identified by the case study. © EPI.
The software enabled rapid identification and visualisation of potential satellite drilling targets around the flanks of an existing discovery. Figure 3 shows a 3D view of a regionally extensive erosional surface overlain by a seismic amplitude extraction highlighting the presence of sands.
This type of erosional feature, related to gravity-driven collapse and subsequent fill, is common throughout the Eastern Niger Delta and often controls the distribution of high quality reservoirs (e.g. Qua Iboe). The seismic attributes indicate the presence of sandy slumps/debris flows and channel features feeding fans near the base of slope, suggesting that the software has enabled the identification of a play in the study area which is similar to fields like Edop in Nigeria.
Identifying New Exploration Plays
Deeper turbidites are prolific reservoirs in Nigeria and Equatorial Guinea (e.g. Alba), as well as in other basins around the world like the Gulf of Mexico, but are largely untested in Cameroon. Interrogation of the database in the Seisnetics 3D viewer enabled the easy identification of higher amplitude features which resemble stacked and ponded turbidite fans.
Figure 4: Ponded turbidite distribution identified by AI-driven software during a case study in Cameroon. © EPI.
Figure 4 shows these features, which pinch-out towards the adjacent diapir and toe fold highs. The case study highlights that the distribution of turbidite reservoirs becomes progressively more restricted within the younger stratigraphy. Deeper turbidites are more extensive, locally pinching-out onto developing highs, while younger turbidites are more restricted, deposited in ‘mini-basins’ between emerging toe fold and diapiric highs. The AI-driven interpretation has therefore highlighted the presence of stacked targets.
The integration of existing well data into the workflow helped delineate the geometries and extent of known gas accumulations, extrapolation of which identified a number of undrilled gas prospects and enabled the evaluation of potential oil rims.
Adding Value with Artificial Intelligence and Machine Learning
Leveraging the power of AI-driven software like Seisnetics allows the rapid evaluation and visualisation of new prospectivity in an area of complex geology. In particular, it has enabled the interpreters to focus on adding value rather than ‘wiggle picking’.
Acknowledgement
The authors would like to thank Tower Resources for providing the data for the case study and also GeoIntel, their partners in Seisnetics.
References:
Hart Energy ExxonMobil VP Stresses Value Of Geophysical Data. Velda Addison, Hart Energy 09/28/2017
Big Data Growth Continues in Seismic Surveys Karen Boman, Rigzone Staff, September 02, 2015
SEAM Phase I addressed challenges of subsalt imaging in tertiary basins, with emphasis on deepwater Gulf of Mexico. Using the SEAM Phase I Model the Interpretation Challenge offers an excellent opportunity evaluate interpretation software on a small well known dataset and also identifying the uncertainty in determining important steps in risking a well being drilled.
https://www.geoexpro.com/articles/2018/10/advancing-geophysical-science