Central part of the Groningen field where most induced seismic events have taken place. The faults at the top of the Rotliegend reservoir are shown by the coloured lines. Colours represent variations in fault dip angle along strike. The blue and red dots show the epicentres of earthquakes 1.5 ≤ ML < 3 and ML ≥ 3 until May 2022, respectively. The smaller blue ones show the ML < 2.0 earthquakes. Source: Wentinck and Kortekaas (2023).
Not as straight as we sometimes think
In schematic diagrams, faults are often drawn as nice straight lines, but a new study on the Groningen field in the Netherlands suggests that this is too simplistic. Faults are more likely to be irregular, which has an important and positive implication in the Groningen case.
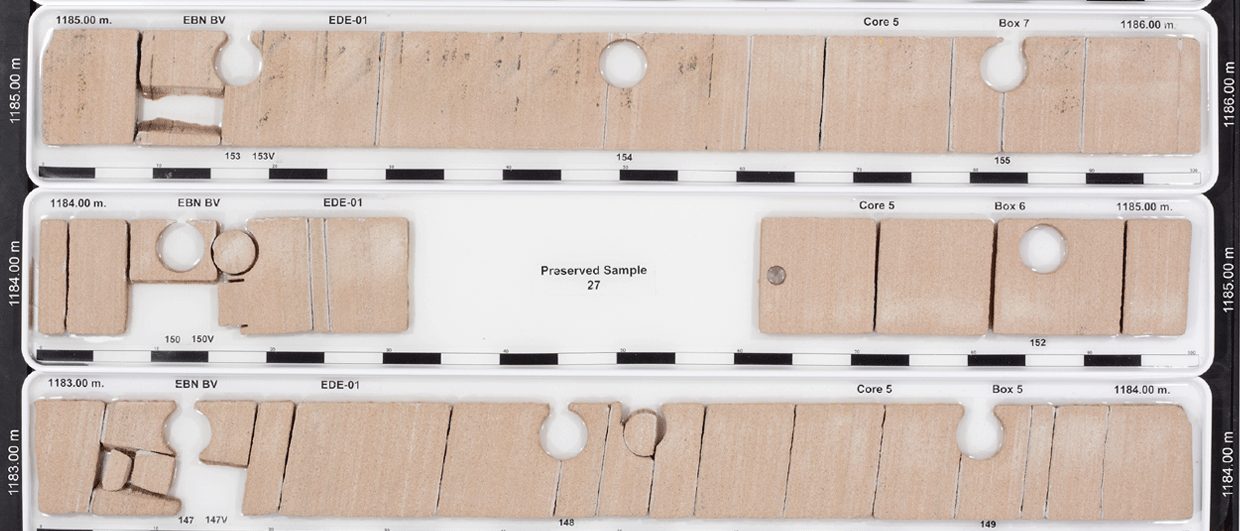
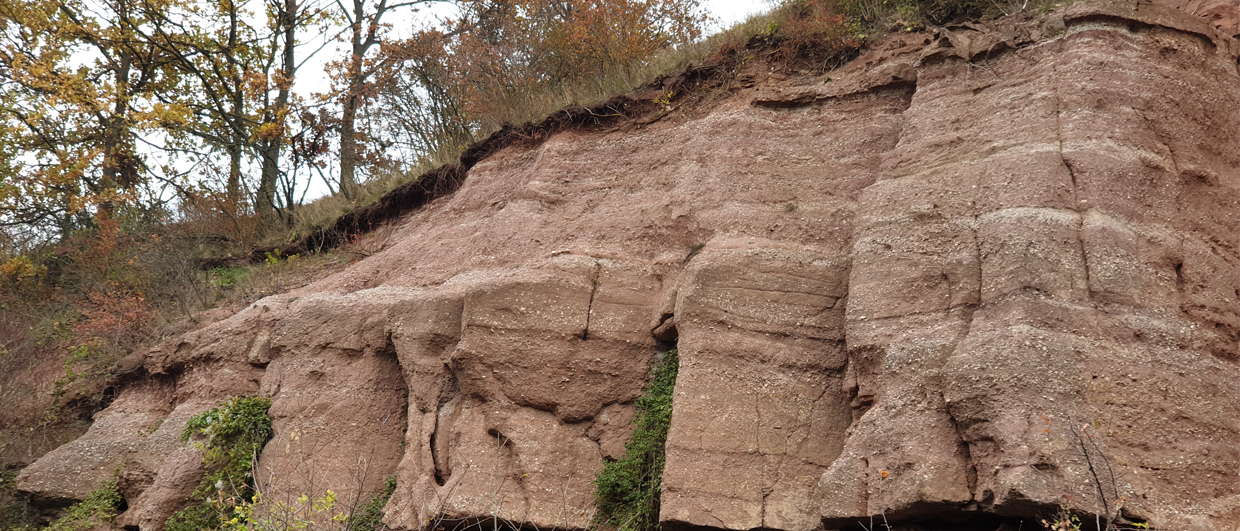
Of course, field observations have long shown that faults are not the perfectly straight lines we often see in schematic cross-sections. However, subsurface data do not always allow the detailed interpretation of faults, especially at the depths where oil and gas reservoirs are often found. A small step or jog in a fault can easily be beyond the resolution of the seismic data, and especially land seismic is often not capable of resolving this matter of detail.
Rick Wentinck and Marloes Kortekaas published a paper in the Netherlands Journal of Geosciences recently in which they investigated fault irregularities in the Groningen field, the largest gas field in NW Europe that has recently seized production because of induced seismic events.
Upon close inspection, the 3D seismic data revealed the presence of kinks, jogs and steps. However, these observations were made close to the seismic resolution and ideally would need more evidence to indicate their presence. Modelling work that was subsequently carried out did exactly that.
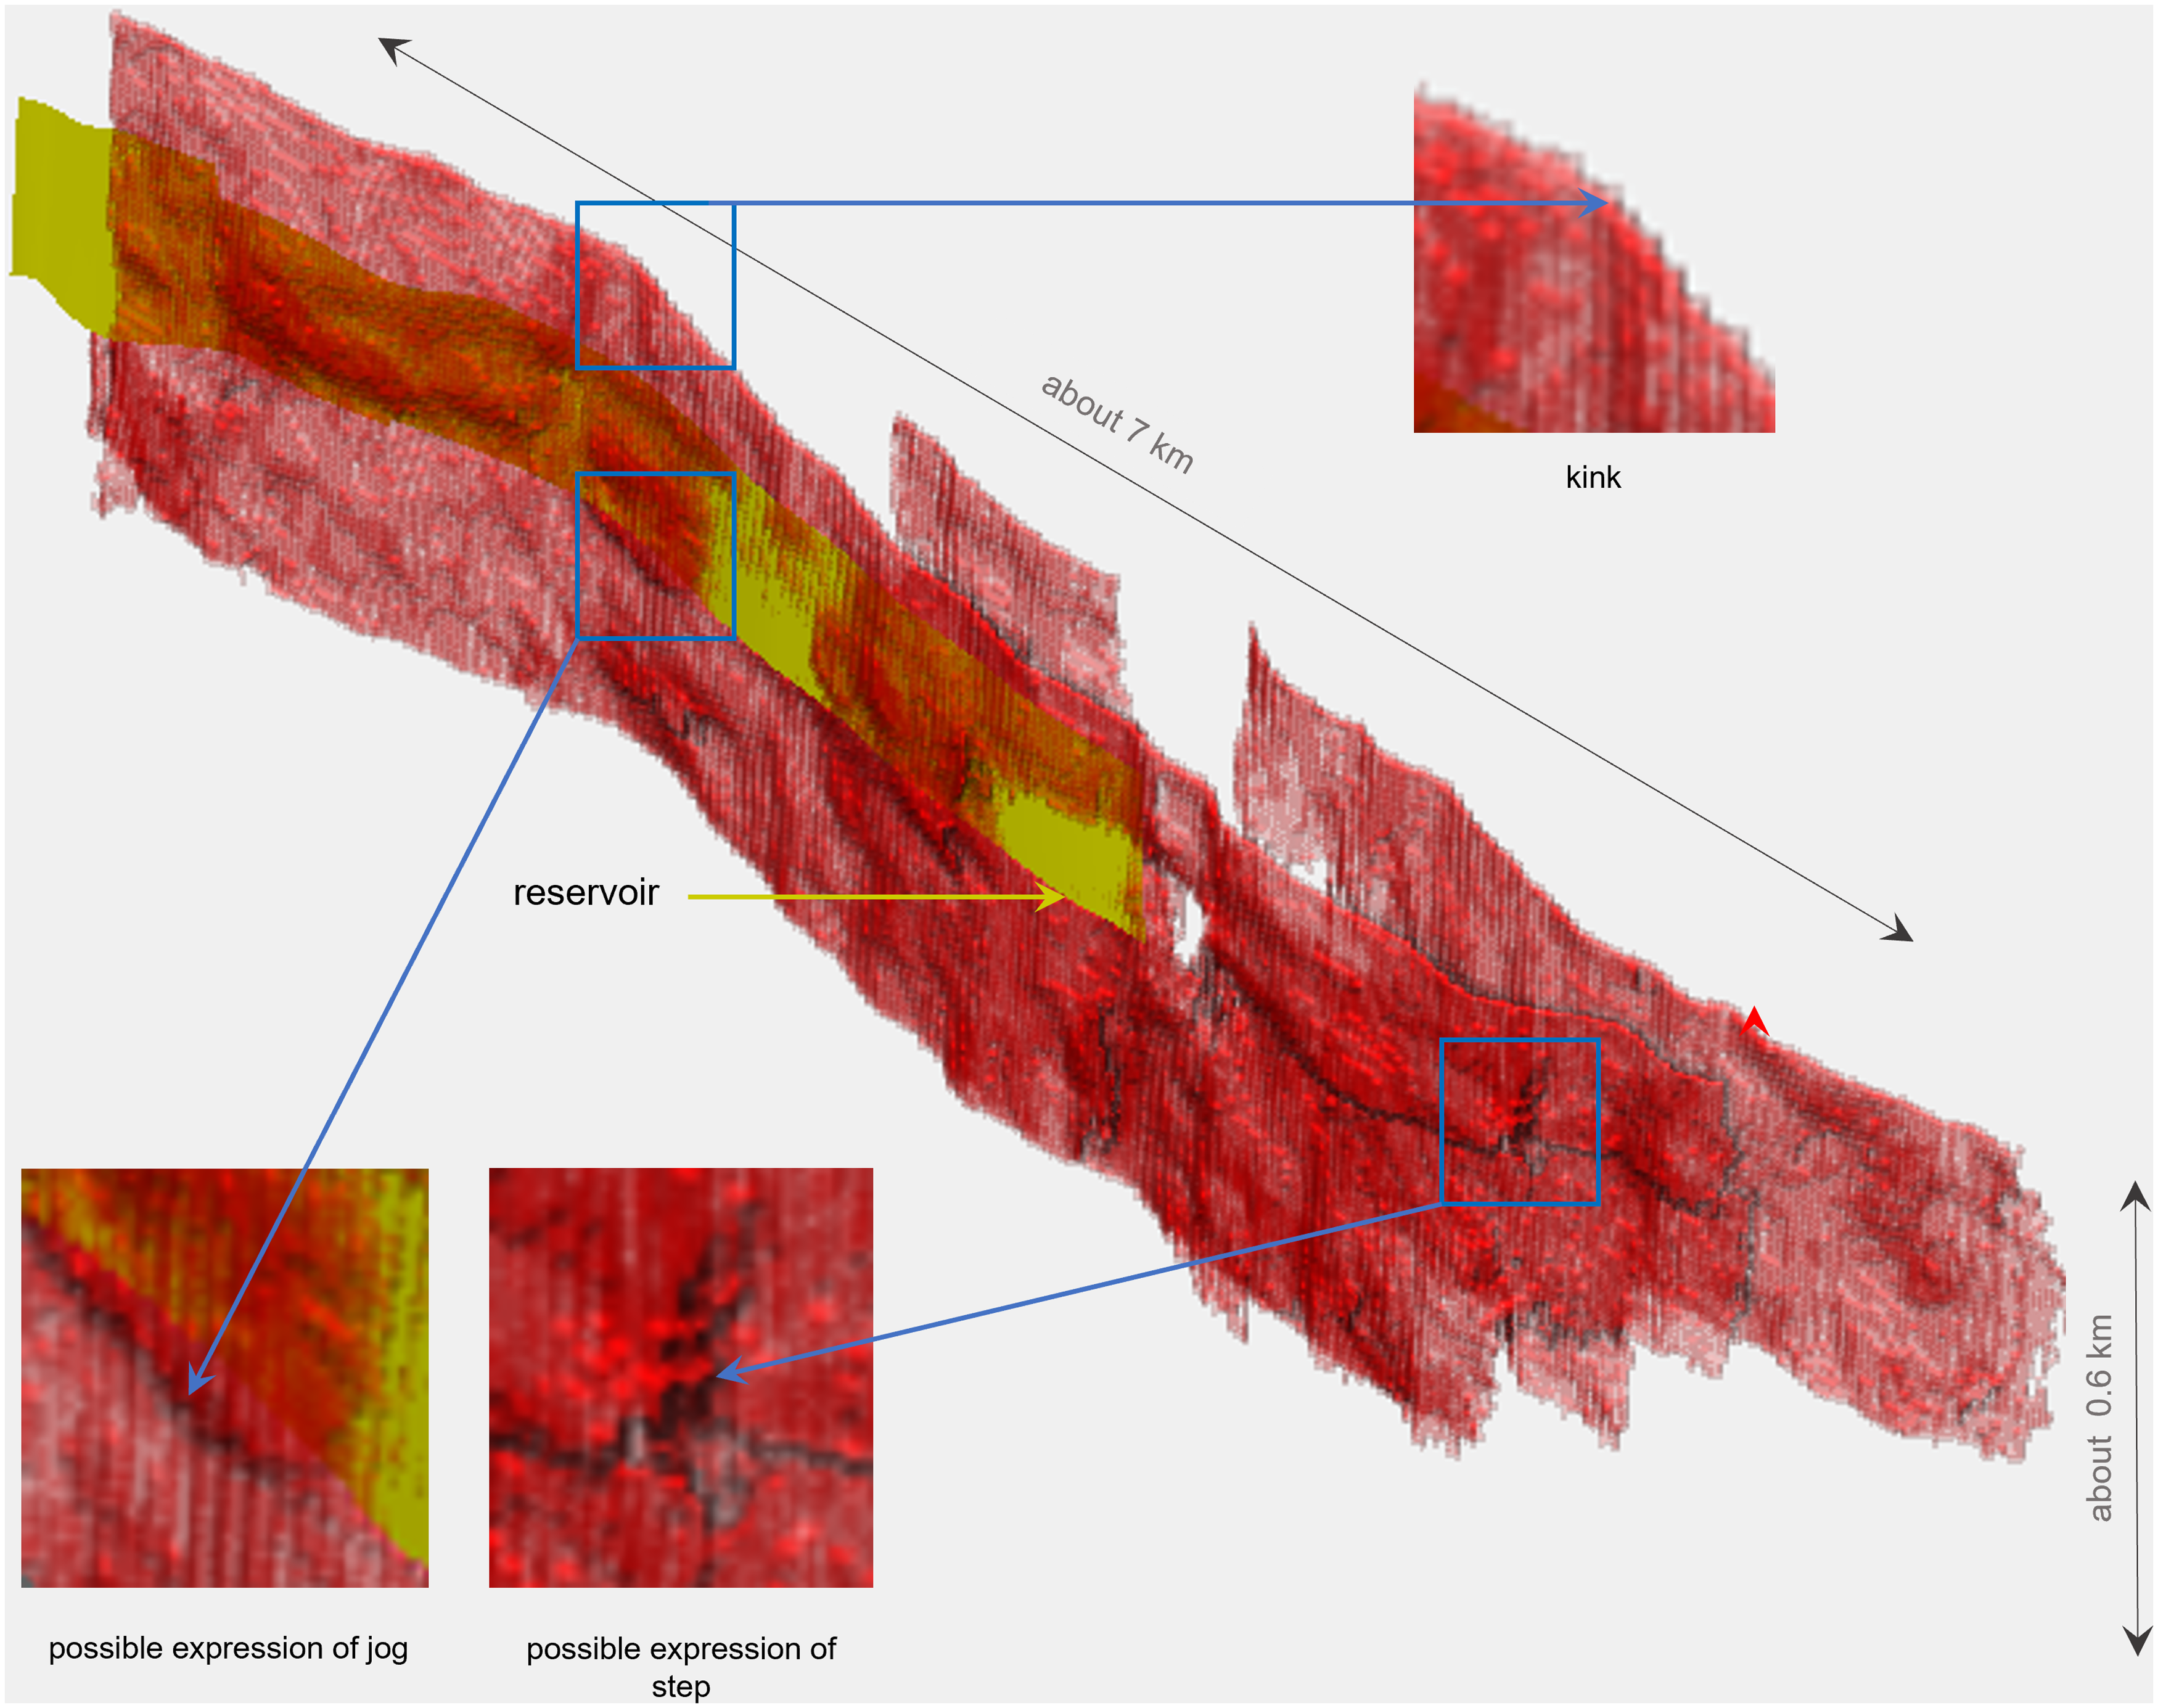
One important observation from the analysis of induced seismic events in the Groningen field is that ruptures have so far been limited to the Upper Permian reservoir. In other words, no propagation into the Carboniferous succession directly below the reservoir has taken place. The modelling work performed by the authors now suggests that it is fault irregularities that could be responsible for preventing ruptures to propagate further down, thus providing another hint of their presence.
The fact that ruptures have not propagated further into the underlying Carboniferous is a good thing. The authors write that if this had happened, it may have led to much stronger earthquakes in the Groningen field than what has been observed already.
Is the modelling work now full proof of the presence of fault irregularities? No, other mechanisms can equally explain why ruptures did not propagate into the Carboniferous. For instance, fault zones in the Carboniferous might have sufficient cohesion strength or they are experiencing a greater horizontal stress than was previously assumed.
But, reflecting on what field observations have already shown, it does make sense to assume that faults in a reservoir buried at 3 km depth show similar characteristics. If modelling subsequently includes these observations to arrive at an explanation of observed phenomena, it is tempting to think that the research is looking in the right direction.
Want to hear more about this, please listen to this podcast Henk Kombrink recorded with one of the authors of the paper, Rick Wentinck.