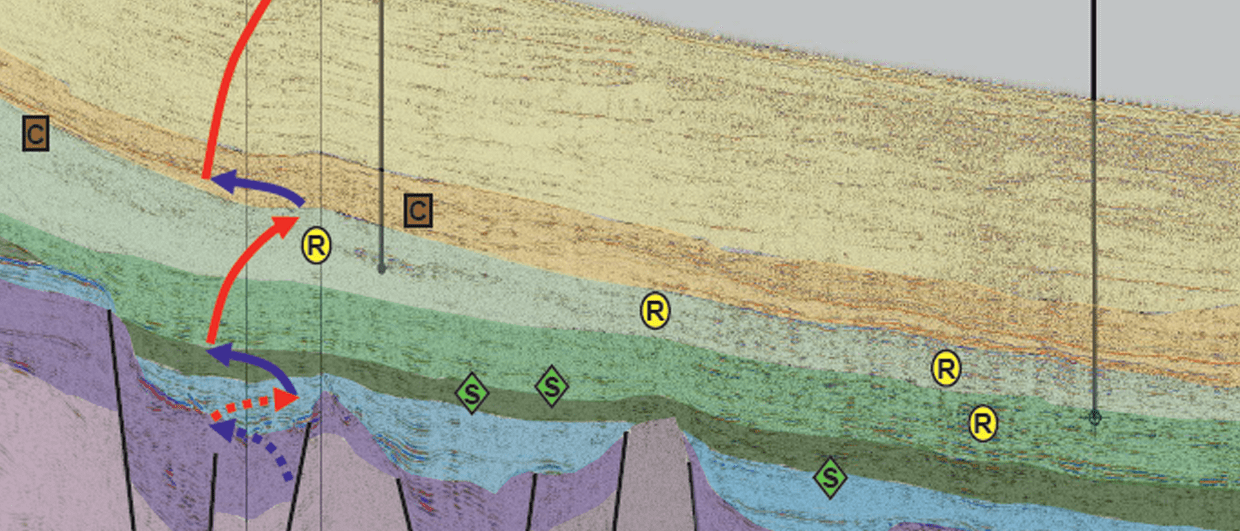
Detail from image below.
Guyana-Suriname Basin: predicting facies in undrilled successions using new sea-level curve
Two weeks ago, we published details on a newly established global sea-level curve. Here, the authors apply it to the prospective Guyana-Suriname Basin.
The Guyana Basin formed during the Jurassic opening of the North Atlantic. Plate reconstructions suggest rifting and early seafloor spreading began with NNW/SSE extension (c. 190–160 Ma). Since the Liza discovery in 2015, 11 Bboe of recoverable hydrocarbons has been discovered in dominantly deep-water stratigraphic traps in the Upper Cretaceous.
See also: A new global sea-level curve – GEO ExPro online
Within the limits of stratigraphic dating uncertainties, the highs and lows in our newly established Tectono-Glacio-Eustatic (TGE) curve correlate well with first-order maximum flooding surfaces and sequence boundaries as seen on seismic and penetrated by wells. The key play is created between the late Albian-Ceno-Turonian marine source rocks (MFT2) and the regional top seal of Paleo-Eocene shales and deep-water carbonates (MFT3). In between these maximum flooding times, the TGE curve illustrates a period of falling sea-level corresponding with the deposition of the Santonian to Maastrichtian deep-water turbidite channel complexes and basin floor fans.
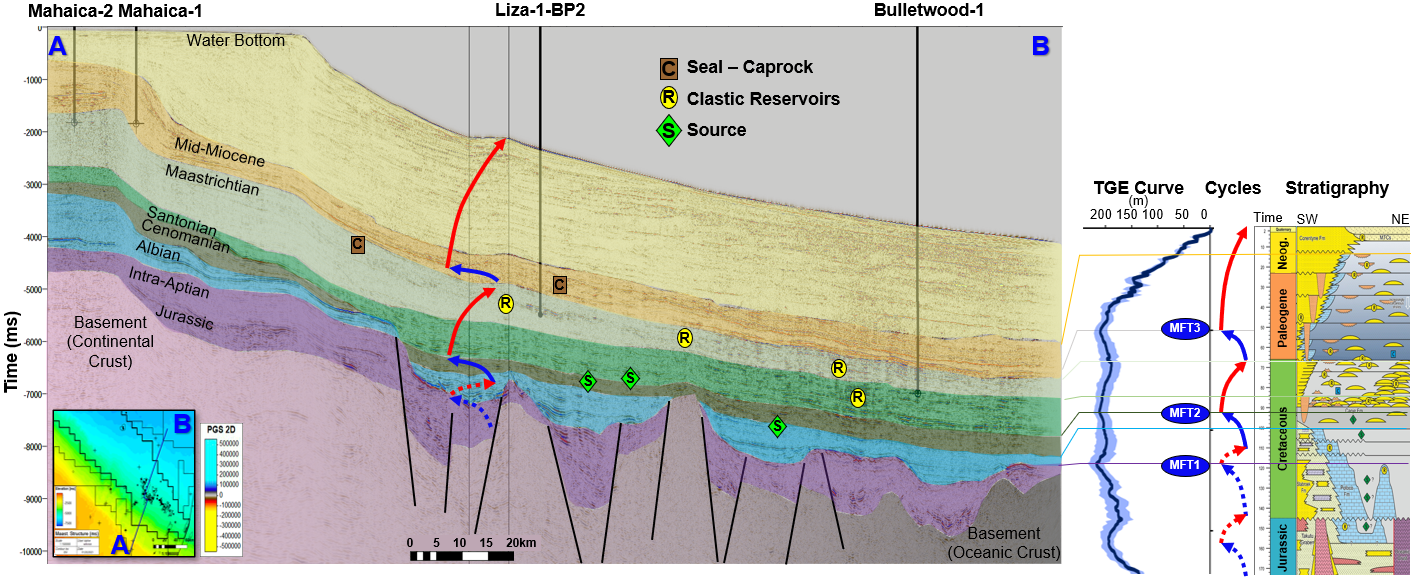
In contrast, during this Late Cretaceous period, the Haq curve (see here for more detail) suggests a rising sea-level, which would not fit the Guyana-Suriname basin stratigraphy very well. Interestingly, MFT1 corresponds to an intra-Aptian maximum flooding in the TGE curve, but a sea-level low in the Haq curve.
This part of the Guyana-Suriname basin stratigraphy has not yet been penetrated by deep water wells and hence it remains to be seen which curve would fit the basin stratigraphy best. The sea-level curves provide food for thought for the interpretation of deeper stratigraphy imaged in seismic, which is yet to be tested by the drill bit. It may also have implications for potential pre-Albian source rocks, which have been postulated but are yet to be proven.
An innovative tool
In summary, the published Tectono-Glacio-Eustatic curve provides an innovative tool for understanding and interpreting global Phanerozoic stratigraphy. At least since the Late Cretaceous, a good correlation has been observed with mega-sequence stratigraphy of Guyana-Suriname basin, where second-order features of the TGE curve are in agreement with the timing of deposition of the main petroleum system play elements. The model can even be used to infer depositional facies in undrilled successions below the proven petroleum fairway.