California Dreaming: Revisiting the Oil-Rich San Joaquin Basin, California
New potential unveiled in the San Joaquin Basin, California (CA) where reprocessed 3D seismic surveys and structural geology provide new oil opportunities in an exploration-mature and prolific oil basin.
West-Side Fold Belt (WSFB)
Images from reprocessed 3D seismic surveys integrated with structural models of convergence yield untested conventional oil prospects and explain dry holes. Exploration risk is generally lower in basins with giant oil fields while complex geology can increase risk and the San Joaquin Basin (SJB, Figure 1) has both. Explored and produced for over 140 years, the SJB has yielded ~17 billion barrels of oil equivalent (Bboe) with at least 5 Bboe yet to be produced (Neher, 2018).

Figure 1: Oil field map of the San Joaquin Basin showing cumulative oil production for the largest oil fields in the West-Side Fold Belt (WSFB). Trapping mechanisms for the largest fields are anticlinal at this scale but at a more detailed look are multi-pool structural and stratigraphic traps along the anticlinal crests and occasionally along the anticlinal limbs. Credit: Thomas L. Davis and Geoff Gallant, Unpublished.
Here, we focus on new exploration opportunities, in the tens of millions barrel range, along the WSFB using a recently reprocessed 3D seismic survey (TRICON 5, 2022) and structural geology-based mapping. Most oil discoveries of the last five decades in the SJB have occurred in the WSFB. The WSFB developed along and contemporaneously with the San Andreas fault (SAF) plate-boundary and its true structural style, a fold and thrust belt (F&TB), has been recognised only during the last four decades (Namson and Davis, 1988; Davis and Namson, 2017). Use of the F&TB structural style in seismic mapping reveals untested prospects and explains many dry holes. However, the F&TB concept arrived late in the basin’s long exploration history and remains underutilised. Within the WSFB are several giant oil fields and numerous large to medium-sized oil fields with a wide array of anticlinal, fault, and stratigraphic-trapping mechanisms (Figure 2) that have resulted from nearly non-stop deformation and deposition during the Neogene.
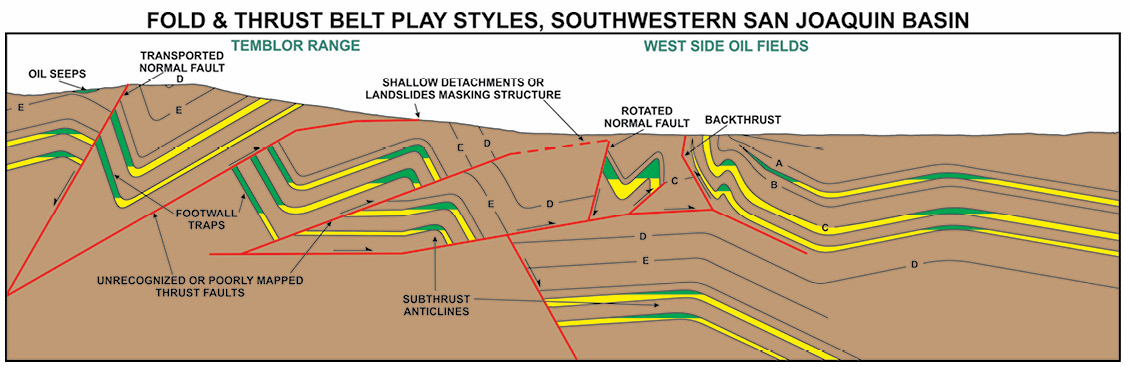
Figure 2: Diagrammatic cross-section showing the various oil trapping mechanisms encountered in the WSFB of the SJB. Most of these traps are associated with development of the fold and thrust belt (F&TB). Underexplored and previously poorly imaged synclinal areas with sub-thrust and sub-detachment anticlinal traps are of primary interest. These areas are more extensive than previously thought and have concealed oil traps and sub-basins with known oil source and reservoir rocks (Davis et al., 1988; Davis, 2015; Davis and Namson, 2017). After Moustafa, A.R. and Khalil, S.M. 2016.
Geologic complexity is both an exploration challenge and an opportunity where smaller traps can be poorly imaged, overlooked, and difficult to pinpoint. Improved seismic imaging and structural mapping are key to future success. In the WSFB there are numerous oil fields with 1–50 MMbo recoverable with only 10s to 100s of acres of extent, yet these small areas yield large volumes due to multiple, stacked reservoirs and seals (Figure 3).
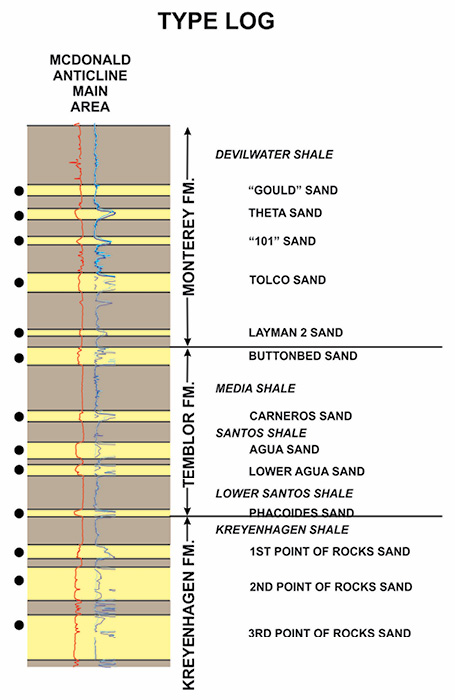
Figure 3: Type log for the Main Area Pool (aka Layman) of the ~22 MMbo McDonald Anticline oil field that is near the seismic displays in Figures 4–6. Discovered in 1945, the field reached peak annual oil production of 750,000 barrels in 1969*. The field has a very long production history that is common to many SJB oil fields. The field is now producing from 2,000–4,000 barrels/month. The black dots show the 13 oil-producing reservoirs that are sandstone dominant. Initial yields for the various reservoirs range from 500–2,000 STB/ ac-ft and the reservoirs are separated by claystone and siltstone dominated seals. Stacked reservoirs and seals are common in the WSFB oil fields and cumulative yields over a small area can be very high. * https://thomasldavisgeologist.com/oil-field-production-injection- data/. After Moustafa, A.R. and Khalil, S.M. 2016.
San Joaquin Super Basin
The American Association of Petroleum Geologists (AAPG) classify the SJB as a Super Basin i.e., >5 Bboe (Neher, 2018). A USGS, 2003, assessment of undiscovered, recoverable, conventional hydrocarbons in the SJB has an estimated mean of 1.8 trillion cubic feet of gas, 393 million barrels of oil, and 86 million barrels of natural gas liquids. The SJB has several organic-rich and thermally mature source rock intervals that include the Monterey Formation, a world-class oil source rock that provides 86% of the estimated ultimate oil recovery in the basin (Neher, 2018; Isaacs and Rullkoetter, 2001). Numerous, highly productive clastic and fractured shale reservoirs span the geologic column from Cretaceous to the Quaternary. Within the WSFB are six of the nation’s top 100 producing oil fields: Coalinga, Lost Hills, South Belridge, Cymric, Midway-Sunset, Elk Hills, plus numerous lesser oil fields.
Structural Models, a Key Interpretation Tool
Fault-related fold models that illustrate the development of petroleum traps and structures are frequently used to assist seismic and cross-section mapping and interpretations in structurally complex F&TBs (Namson and Davis, 1988). Worldwide, numerous petroleum-rich provinces are situated in convergent strike-slip belts with giant petroleum traps such as the WSFB (Davis and Namson, 2017).Before the 1980s the WSFB’s structural style was attributed to wrench faulting that produced steepening-with-depth fault patterns in cross-section with limited sub-fault exploration areas. Subsequent efforts by the Atlantic-Richfield Company (ARCO) in the Cuyama Basin, CA (Davis et al., 1988), the 1983 Coalinga earthquake (Namson and Davis, 1988), and the discovery of strain-partitioning adjacent to the SAF plate-boundary (Mount and Suppe, 1987; Zoback et al., 1987) show the WSFB and other CA oil basins have a F&TB structural style. Thus, the WSFB and other CA oil basins have extensive under-explored areas, with known oil source and reservoir rocks, where detachments and thrust sheets conceal footwalls with untested traps (Figure 2, below; Davis, 2015) and in Cuyama, a previously unknown oil and gas sub-basin proven by deep drilling (Davis et al., 1988). Here, we show a 2D seismic line with dry holes (Figure 4) and contrast its trap image with the TRICON 5’s 3D images that are integrated with the F&TB structural-style mapping (Figures 5 & 6, below). This approach accounts for previous exploration failures and identifies an untested prospect. The significant improvement in the reprocessed data quality is a result of a new term noise attenuation workflow where the data are sorted in five different domains with noise attenuation applied in each domain.
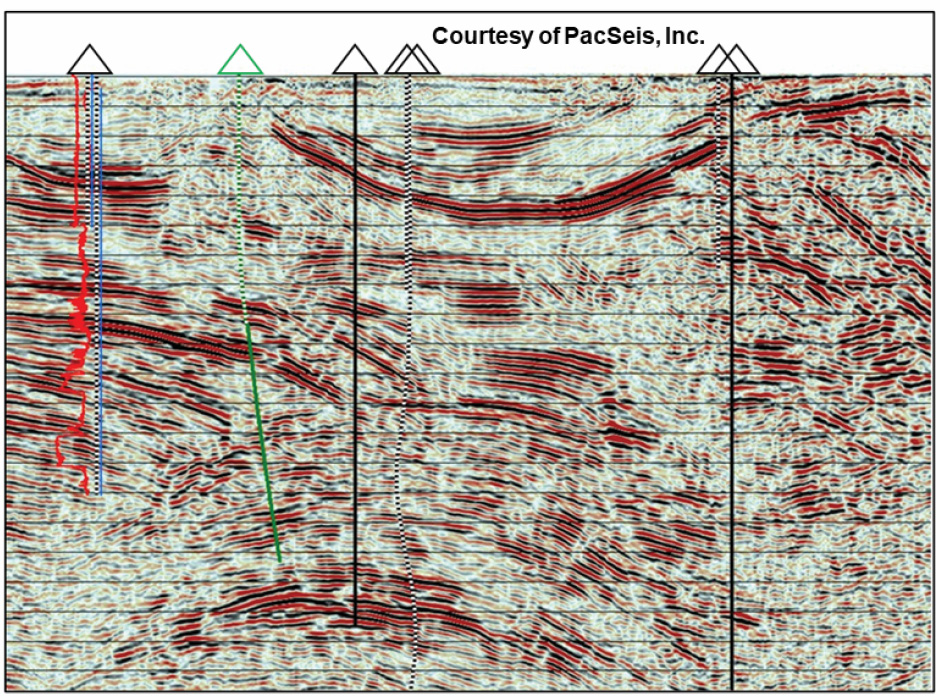
Figure 4: A migrated 2D seismic line within and pre-dating a 3D seismic survey that was recently reprocessed. The 2D line lies along the 3D survey profile shown in Figure 5 and comparison of the images is instructive. Black triangles show noncommercial exploration wells (dry holes) adjacent to the line. The large roll-over imaged in the centre of the 2D line was tested by two wells that had oil shows but were noncommercial. The green triangle shows a proposed test well. PacSeis, Inc. and Tricon Geophysics, Inc.
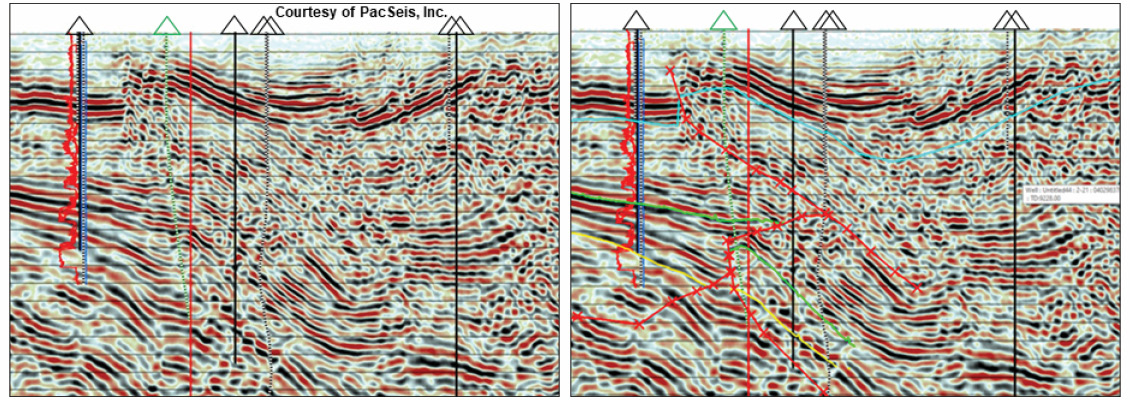
Figure 5: Upper image – uninterpreted 3D seismic profile (crossline) along the 2D line shown in Figure 4. Lower image is a geologic interpretation of the upper image that shows an untested shallow anticlinal trap (fault-propagation fold) and an untested deeper, faulted-anticlinal trap above a triangle zone. Red curved lines with Xs are faults, shallow light-blue curved line is the top of the Monterey Formation, green curved line is top of the Buttonbed sandstone, and yellow curved line is top of Agua sandstone (see Figure 3 for more stratigraphic and reservoir detail). Black triangles show the noncommercial exploration wells (dry holes) adjacent to the profile and the green triangle shows a proposed test well. Red vertical line is intersection of the inline shown in Figure 6. The seismic profiles in Figures 5 and 6 are from a reprocessed 3D survey and the improved image quality is due to the TRICON 5 (2022) workflow. PacSeis, Inc. and Tricon Geophysics, Inc.

Figure 6: Upper image – uninterpreted 3D seismic profile (inline). Lower image – geologic interpretation of the upper image that shows the untested shallow anticlinal trap and the untested deeper, faulted-anticlinal trap. Red and light-blue curved lines with Xs are faults, shallow light-blue curved line is the top of the Monterey Formation, green curved line is the top of the Buttonbed sandstone, and the yellow curved line is the top of the Agua sandstone (see Figure 3 for more stratigraphic and reservoir detail). Black triangles show the noncommercial exploration wells (dry holes) adjacent to the profile. The inline profile is perpendicular to the crossline shown in Figure 5 and the 2D line shown in Figure 4 (intersections are vertical red lines). PacSeis, Inc. and Tricon Geophysics, Inc.
Future of Oil in California and CO2 Emissions
California oil demand has remained constant over nearly four decades (Figure 7), it is the second-largest consumer of petroleum products in the nation, and the largest consumer of gasoline and jet fuel (EIA, 2021). The SJB and CA’s other oil-rich basins remain an important crude oil source to CA’s refineries despite declining in-state production. For at least the next several decades CA will remain a sizeable oil market and the SJB will be its most important domestic source despite concerns and policies to address climate change.
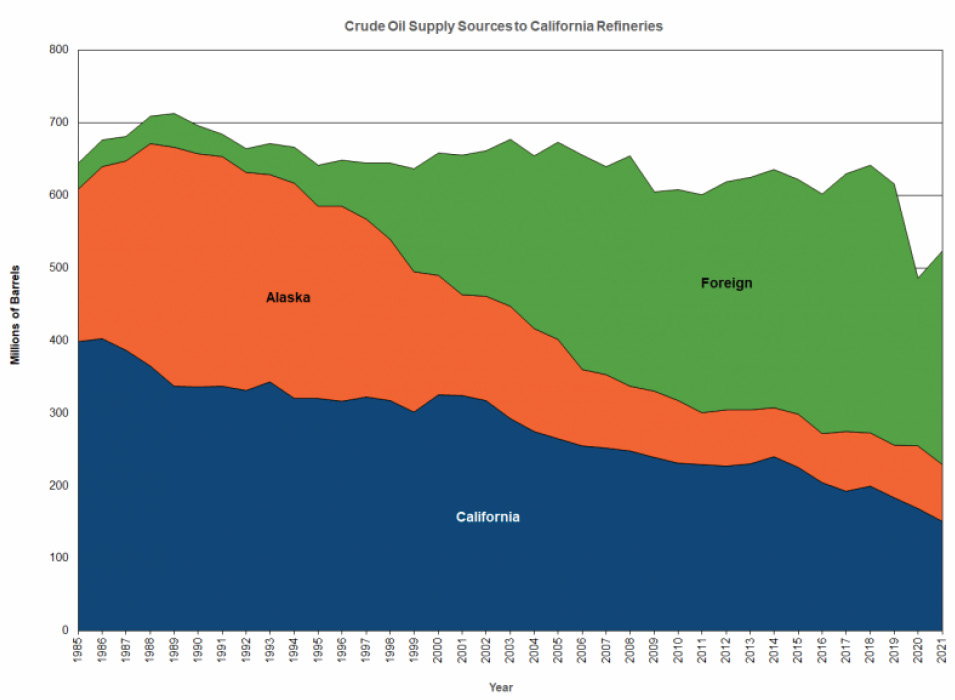
Figure 7: California (CA) has a sizeable crude oil market. Graph shows CA’s imports of crude oil from foreign sources have increased from 6% in 1985 to 56% in 2021. In 1985 CA produced ~60% of its consumption from in-state sources and by 2021 this had decreased to ~29% (CAEC, 2021). CA oil demand has been roughly constant over nearly four decades: 600–700 MMbo/yr, mostly, because of improved energy efficiency as the population of CA has increased significantly since 1985. During this period CA has increased its per oil barrel emissions of CO2 by over-reliance on maritime transport of oil from foreign sources. Olmer et al., 2017.
This market has an indispensable role in CA’s energy mix and has decades of high demand that show no sign of decreasing (Figure 7). Counter-intuitively, CA’s present anti-fossil fuel politics and policies have increased its per-barrel CO2 emissions by reliance on an ever-increasing supply of maritime-transported oil (Figure 7, Olmer et al., 2017), plus raising the risk of oil spills at sea and onshore oil leakage at foreign sources with questionable environmental records. It is politically unlikely that CA’s public and businesses, while concerned about climate change, will support a dramatic oil supply reduction with its negative economic impact and life-style restrictions while also becoming a national security risk (Rapier, 2019). CA will need to adjust its counter-productive policies by allowing more in-state oil production and exploration that will support a smoother, more practical energy transition over the next four or five decades.
References
- CAEC, 2021, California Energy Commission, https://www.energy.ca.gov/data-reports/energy-almanac/californias-petroleum-market/oil-supply-sources-california-refineries
- EIA, 2021, California State Energy Profile, US Energy Information Administration, https://www.eia.gov/state/print.php?sid=CA
- Davis, T. L., M. B. Lagoe, W. J. M. Bazeley, S. Gordon, K. McIntosh, and J. S. Namson, 1988, Structure of the Cuyama Valley, Caliente Range, and Carrizo Plain and its significance to the structural style of the southern Coast Ranges and western Transverse Ranges, in W. J.M. Bazeley ed., Tertiary tectonics and sedimentation in the Cuyama basin, San Luis Obispo, Santa Barbara, and Ventura Counties, California, Pacific Section SEPM, v. 59, p. 141–158.
- Davis, T. L., 2015, Study shows evidence for untested large traps, San Joaquin basin, California: Oil & Gas Journal, v. 113, no. 10, p. 42–50.
- Davis, T.L., and J.S. Namson, 2017, Field excursion: Petroleum traps and structures along the San Andreas convergent strike-slip plate boundary, California: AAPG Bulletin, v. 101, No.4, p. 607-615.
- Isaacs, C. M., and Rullkoetter, J., eds., 2001, The Monterey Formation: From rocks to molecules: Columbia University Press, New York, NY, United States: 553 pp
- Mount, V. S., and J. Suppe, 1987, State of stress near the San Andreas fault: Implications for wrench tectonics: Geology, v. 15, p. 1143–1146, doi:10.1130/0091-7613(1987) 15<1143:SOSNTS>2.0.CO;2
- Namson, J. S., and T. L. Davis, 1988, Seismically active fold and thrust belt in the San Joaquin Valley, central California: Geological Society of America Bulletin, v. 100, p. 257–273, doi:10.1130/0016-7606(1988)100<0257:SAFATB> 2.3.CO;2.
- Neher, K. 2018, San Joaquin Basin, California, Super Basin: Past, Present and Future San Joaquin Geological Society December 2018, SJGS Meeting & Presentation: https://www.searchanddiscovery.com/abstracts/html/2019/longbeach-90339/abstracts/2019.PS.15.html
- Olmer, N., Comer, B., Roy, B., Mao, X., Rutherford, D., 2017, Greenhouse Gas Emissions from Global Shipping, 2013-2015, International Council on Clean Transportation (ICCT), https://theicct.org/sites/default/files/publications/Global-shipping-GHG-emissions-2013-2015_ICCT-Report_17102017_vF.pdf
- Rapier, R., 2019, California’s Oil Hypocrisy Presents A National Security Risk https://www.forbes.com/sites/rrapier/2019/06/21/californias-oil-hypocrisy-presents-a-national-security-risk/?sh=2d9c2839252a
- TRICON 5, 2022, Tricon Geophysics, Inc., http://tricongeophysics.com/products-and-services/time-processing/
- United States Geological Survey (USGS), 2003, Petroleum Systems and Geologic Assessment of Oil and Gas in the San Joaquin Basin Province, California, Professional Paper 1713, https://pubs.usgs.gov/pp/pp1713/01/pp1713_ch01.pdf
- Zoback, M. D., M. L. Zoback, V. S. Mount, J. Suppe, J. P. Eaton, J. H. Healy, D. Oppenheimer, et al., 1987, New evidence on the state of stress of the San Andreas fault system: Science, v. 238, p. 1105–1111, doi:10.1126/science.238.4830.1105.