A clearer vision with seismic inversion
Defining a new Upper Cretaceous play in the West of Shetland using seismic inversion.
It takes a lot of people to drill a well and many different disciplines working together, like the moving parts of a complex machine. It has been said that oil is a boring (but necessary) product, but that this lack-lustre commodity is obtained and supplied by some of the most interesting and complex technological and commercial processes known to man. Part of the role of geoscientists and engineers is to explain the insights and results from their own disciplines in ways that can be understood across multidisciplinary teams including non-technical stakeholders such as project investors.
It is probably fair to say that engineers’ eyes often appear to glaze over somewhat when they are presented with a seismic line. It is probably easy to understand why – all those red and blue, or black and white stripes. A good seismic inversion can take that information and integrate it with other subsurface data, such as well logs, combined with more general information on the geology at hand, to generate a more meaningful display of the layers which will be encountered by the drill bit. Another really clever trick is that inversion reduces the imprint of the band-limited seismic vibration, or wavelet, thereby increasing the sharpness of the geological images compared to the input seismic. Inversion turns hard-to-interpret seismic amplitude values into rock and fluid property values, such as porosity and fluid saturation, and sharpens up the tops and bases of reservoir targets in the process.

Despite being a deeply technical process, ultimately a successful inversion project is driven by the people doing the work and a successful outcome depends on a good understanding across the team of the various components feeding the inversion. Several generic pitfalls can be avoided by careful project planning and project management. In addition to careful technical quality control of inputs, it is important to build an understanding across client, contractor and partner stakeholders of what each party can contribute to the project and optimally to get an up-front commitment to regular (e.g., weekly) communication of how the project is progressing, what decisions are being made, and what options there are for doing things differently.
The initial stages of an inversion project are very time consuming. This is the stage at which seismic and log data is quality controlled and high-level geological concepts which will feed into the process are explored. One of the challenges at the early stages can be to balance forward momentum with the necessity from time to time to recycle. Shear velocity log quality is a common source of uncertainty and error, and existing pre-stack seismic data needs to be evaluated and if necessary optimised by applying further seismic processing. Wavelet definition is equivalent to finding the acoustic fingerprint within the seismic data and requires an equivalent forensic search since it will constrain every subsequent output. Once again, it can be time consuming.
A seismic inversion is, rather obviously, only as good as the seismic data which underpins it. Put differently, if a phenomenon such as a subtle amplitude variation with offset (AVO) response (for direct hydrocarbon indication for example) is not already captured and hidden within the wiggles, the inversion process will not magically generate it and reveal it. A conventional full-stack seismic display encodes numerous hidden dimensions (compressibilities, densities etc.) which are themselves encoded within offset amplitudes (AVO) and normal incidence amplitudes. Pre-inversion analysis of seismic data can include cross-plotting seismic data in AVO / normal incidence space to establish if and where the data show the tell-tale signs that an inversion will be worthwhile. At this stage of the analysis, it will more than likely already be clear to a seismic interpreter where reservoir sands are most likely to emerge from the inversion image, and what the geological probability of success may be on mapped prospects. As the inversion project progresses it will test these pre-existing ideas.
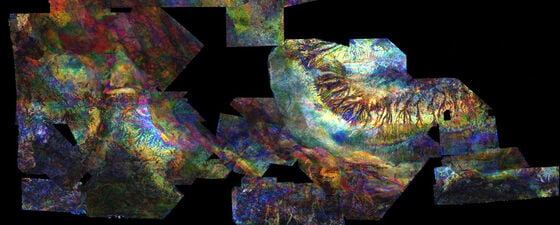
The colour of sound – Images of hydrocarbons
The West of Shetland (WOS) is one of the frontier provinces of the UKCS, although it is still commonly referred to as part of the North Sea in the popular press. Numerous fields within the basin are currently on production, such as Schiehallion, Clair and Laggan-Tormore, a number of material discoveries have still to be developed such as Cambo, Rosebank and Tornado, and a number of companies hold extensive exploration portfolios.
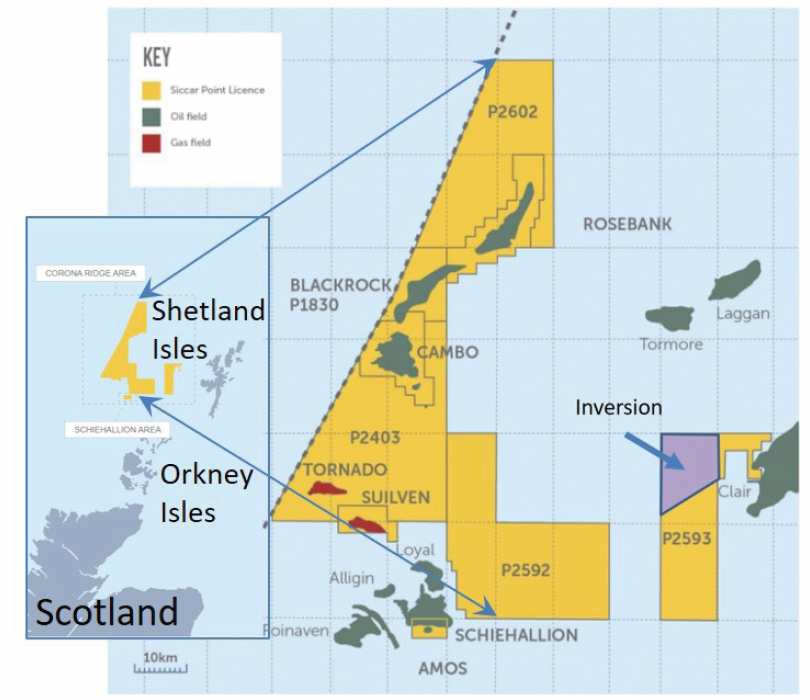
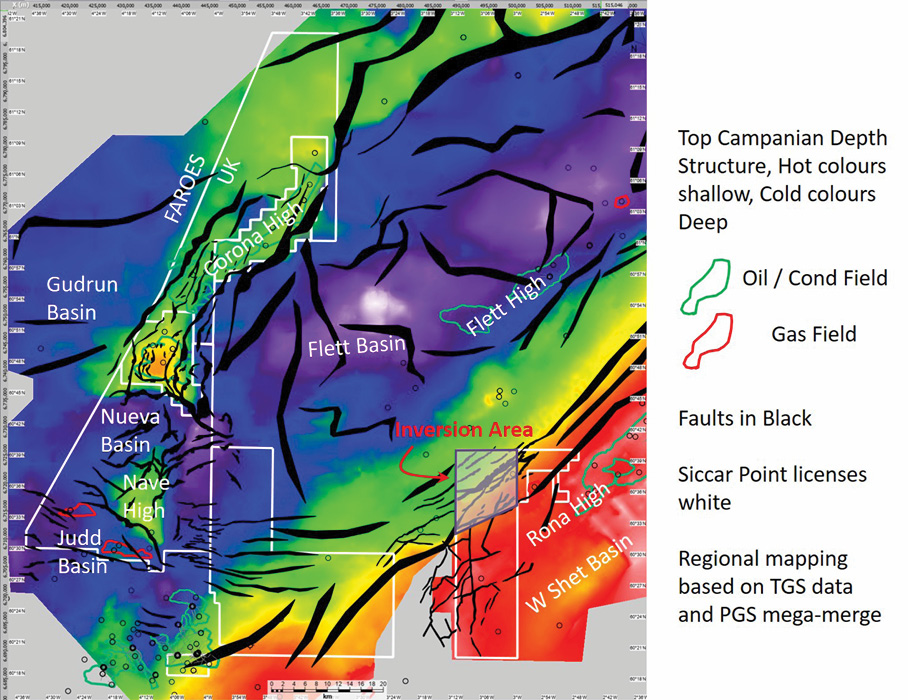
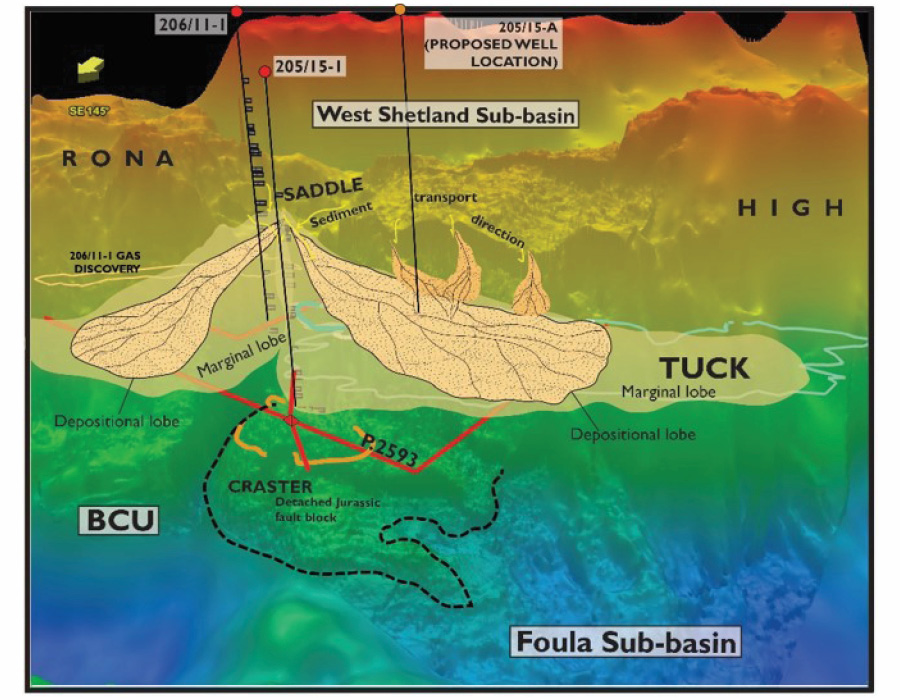
Siccar Point has partnered with several inversion companies within development and exploration work programmes in the WOS including a successful recent inversion project on the Rona Ridge, west of the Clair field, which sheds light on the likely distribution of a gas sand which has already been tagged in a nearby well. The tagged gas is within our Tuck prospect, hosted in the MacBeth Sandstone. Inversion analysis by Qeye in Denmark of data shot by PGS and TGS, and supported by Siccar Point’s partner Spark Exploration, has added value to the partnership not only by generating a best-in-class inversion product, but also by acting as a platform across which the joint venture partners have communicated regularly to achieve these results.
A stepwise project roadmap was followed from early data handling and evaluation, through initial outputs, to a final set of probabilistic and deterministic deliverables with a project duration of three to four months. One of the most important steps of the workflow involves infusing pre-existing geological knowledge into the algorithm and is akin to allowing the geophysical data to shine through a shadowy existing image of the geology. This entails a balancing act determined by how good we believe the preconceived geological knowledge or ‘prior model’ to be, versus how good we think the geophysical uplift will be. If we get it wrong, we over-saturate the output with our erroneous misconceptions and learn little from the process.
There are various ways of supplying a prior model and the algorithm used for the Rona Ridge rests on the notion that geological events facies sequences are ordered, and that if we know the general stratigraphy of a region, we can use the knowledge of where we are in the sequence to predict, to a greater or lesser extent of likelihood, what the underlying and overlying layers will be even in the absence of geophysics. We can also add such general information as the fact that gas will most likely occur above oil, and that they will both occur above brine, within the porous reservoir sequences. This type of prior model is described as a Markov Chain, with each link of the chain representing a likelihood of what will happen next as we travel downwards through the rock layers. There are several other ways of supplying prior models used by different inversion products in the marketplace, all of which have their own strengths.
The inversion engine generates ordered wavelet scale sequences of facies consistent with the geological prior understanding. Rock physics and statistical relationships based on well data, between the compressibilities and densities of rocks and fluids as well as seismic wavelets and seismic noise models, produce a likelihood of seismic data depending on geology via facies sequences. The seismic data are then interrogated to produce a spatially varying distribution of facies sequences, consistent with the seismic data (within noise level) and the prior understanding of layered rock and fluid fill.
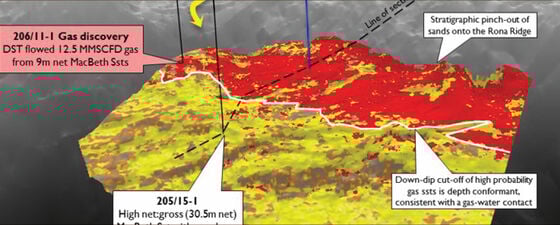
From acoustic image to gas sand map
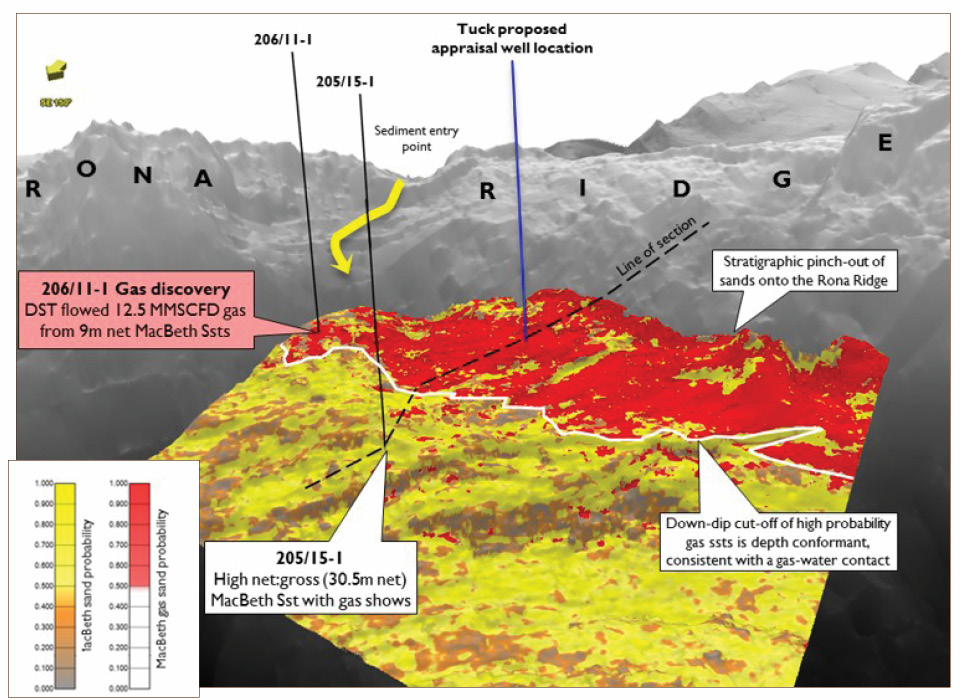
Numerous plays are present along the Rona Ridge, but our current inversion has primarily targeted just one of these. This is the known Upper Cretaceous play, which has already been intersected within the licence by a well that found over-pressured gas-bearing sands onlapping the basement, very much analogous to that found in TotalEnergies’ Glendronach field, 60 km to the NE. The geological challenge is to find better quality sand than that encountered in the existing well. The geophysical challenge is to determine whether the carbonates overlying parts of the sand were masking the true seismic response of the target within a side lobe to the main seismic loop.
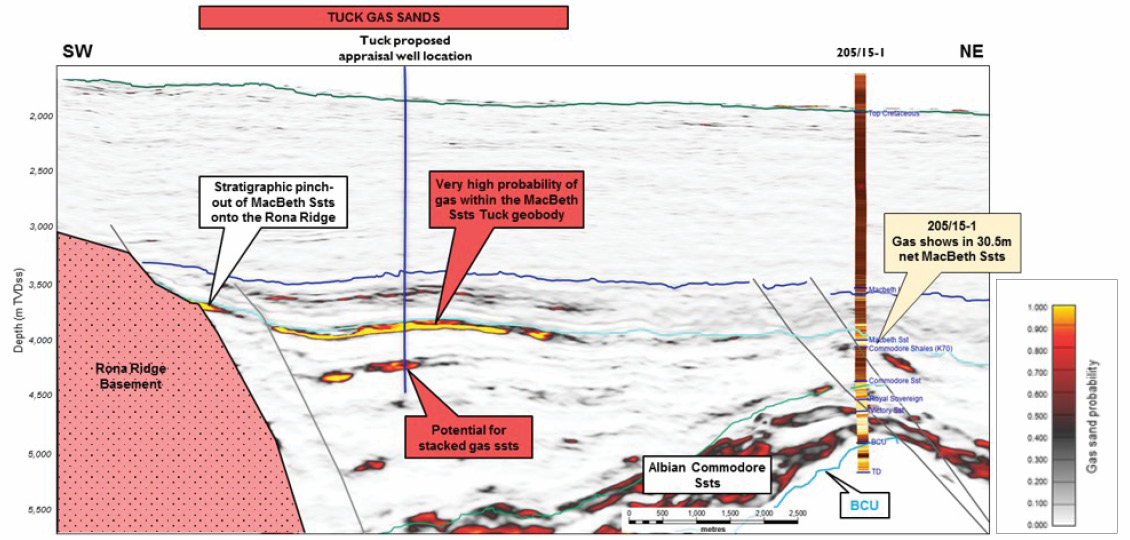
In fact, the mapped distribution of the carbonate layer is different from that of the seismically bright underlying gas sand loop, and the inversion has corroborated this conclusion, demonstrating a down-dip cut-off parallel to structure consistent with a gas/water contact. The mappable sand lobe sweeps from the basin back up towards the depositional entry point, with the inversion demonstrating that seismic amplitude changes which we observe are most likely related to changes in porosity between the axis of the sand depositional system and its margins. The inversion has also highlighted several secondary sand input points to the system and shows that the lateral seal for the Tuck prospect most likely occurs because of facies change.
Known lateral stratigraphic traps in the West of Shetland are numerous, not only in this play but also within the Palaeocene. When exploration of the WOS first began, geologists were concerned that it would be difficult to find good sand reservoirs this far out into the Atlantic margin. That fear has proved unfounded, but the common occurrence of lateral traps by facies change may reflect the fact that we are prospecting in deepwater systems a long way from the primary source of the sediment. The stepped over-pressure profiles in the upper Cretaceous stacked sands seen in the Tuck and the along strike Glendronach, also support lateral pinch-out as the lateral seal mechanism.
Measurements of success
The best indication that an inversion project has been successful is perhaps that output volumes are accepted by the subsurface team as providing useful constraint to models and that they are actually used. A set of inversion volume outputs languishing somewhere on an IT system is surely the most dispiriting indication that the project has not delivered what it set out to do and has not managed to achieve a useful data synthesis. In this article we have tried to set out the ways in which the project owner is most likely to help build a successful result. This will include lots of discussion up front about what stakeholders think the project is likely to achieve and lots of short duration validation tests of ideas during project implementation. A successful inversion project will have a legacy beyond the initial project aims and will hopefully become a set of seismic volumes which future project teams will come back to again and again. When the project helps bring stakeholder companies together and enhances the working relationship, it is most likely to deliver the more tangible results of drillable anomalies.
Acknowledgements: PGS and TGS are gratefully acknowledged for the use of seismic data in regional mapping and inversion.