Shaping the Future of Seismic Interpretation
A quicker way from seismic data to geomodel – or how seismic interpreters have finally come to the centre of the exploration workflow
From the advent of the first computer-aided interpretation methods in the 1980s, technological advances both in hardware and in algorithms have radically changed the work and the role of seismic interpreters. The downturn in the oil and gas industry has recently given another push for optimisation: workflows are being revisited and new technologies are being tested. In addition, over the last two decades 3D geological models, which represent a simplified version of the earth, have progressively become one of the major tools for exploration and production. These models, based on geo-cellular grids, where rock properties from well data are estimated for each cell, are used for reservoir simulation. To build these watertight geological models, geo-modellers generally use only a few horizons and faults provided by the seismic interpreters, but a new technique now allows us to compute watertight geological models directly from seismic data, using a dense horizon patch grid. Any change made on the stratigraphic or structural interpretation can then be directly applied to the watertight models. The role of seismic interpreters has hence become critical for keeping geo-modellers connected to the reality of the seismic data and allowing them to quickly create more accurate models.
From seismic interpretation to reservoir modelling: (a) a high number of horizons are generated using a horizon patch grid; (b) relative geological time (RGT) model obtained by conversion of seismic voxels into relative geological times; (c) watertight model and cellular grid computed after converting RGT model pixels into vectors. (Source: Eliis)
Latest Innovations in Seismic Interpretation
Over the last 15 years, new seismic interpretation techniques have been introduced that allow geoscientists to interpret seismic data faster and more accurately. Seismic interpretation is traditionally an intensive and time-consuming process based on manual picking or auto-tracking of single horizons within a seismic volume. The method where seeds are autotracked by correlation of wavelet amplitudes is often limited to regions showing clear seismic reflections and a relatively simple geology, compelling interpreters to make many assumptions. New approaches have been proposed that harness the three-dimensionality of the data and simultaneously track every surface throughout the volume. Some of these methods are based on the classification of reflectors extrema (Borgos et al., 2003), on phase unwrapping (Stark et al., 2004), on seismic flattening (Lomask, 2006), on horizon cubes (de Groot et al., 2010), on seismic DNA (Bakke et al., 2011), on chronostratigraphic models (Labrunye, 2013) and on horizon volumes with constraints (Wu and Hale, 2014).
In 2009 Pauget et al. proposed a comprehensive approach to building a geological model while interpreting seismic data. The first step consists of computing a 3D grid of horizon patches from a seismic volume using the same methodology used to obtain a relative geological time (RGT) volume. Spatial resolution of the grid depends on the patch size, while the vertical resolution relies on the seismic trace extrema (peaks, troughs and zero crossings). The vertical links define the stratigraphic ordering whereas spatial links are built between patches based on their correlation and their distance. The same geological age is assigned to patches connected laterally, so horizons are thus chrono-stratigraphically sorted and never cross each other due to the uniqueness of the links.
Horizon patch grid. (a) Patches are computed on each polarity extrema (peak and trough), spatial distribution depends on the size of the patch. (b) 3D representation of the patch grid. (c) Stratigraphic ordering of the patches with relative geological times. (Source: Eliis)
Stratigraphic Analysis and Fault Imaging
Fault attributes derived from the RGT model: (a) seismic, (b) RGT model, (c) spatial gradient gradient model. (Source: Eliis)
An unlimited number of horizons representing iso-geological ages are derived from the RGT model to interpret thin stratigraphic events at sub-seismic scale. Continuous surfaces can be computed anywhere inside a stratigraphic interval without being limited by seismic polarity changes, whereas other techniques are limited to 2D analysis and/or to a limited number of horizons. This method, combined with spectral decomposition and colour-blending imaging, has been successfully used for reservoir detection in thin beds, for fault and fracture imaging and for reservoir characterisation.
Understanding the complexity of the structural network is usually a delicate task for seismic interpreters. Seismic attributes have been used extensively to image faults: dip-steered coherence analysis, such as variance, provides a significant image of the structural discontinuities but still depends on the seismic signal heterogeneities in the vicinity of the fault. Another technique consists of taking into account the RGT model as input for fault imaging complementary to seismic attributes: spatial derivatives of the relative ages show clearly the occurrence of faults and fractures even in areas of poor seismic signal quality. This technique provides a high-resolution fault image based on the geology.
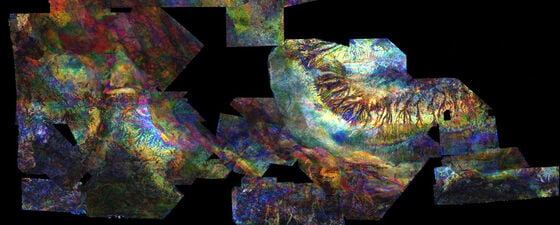
Horizon from the Exmouth sub-basin (North West Australia) showing (a) the envelope attribute and (b) the spectral decomposition of the signal mapped on it. Both are highlighting a channel spreading westwards in the Jurassic. The spectral decomposition shows a high-resolution image that helps understand better the internal structure. (Source: Eliis)
From Seismic Data to Cellular Grid Geomodel
Fault planes are considered to be discontinuity constraints, as they remove links between patches of the original 3D grid without changing the chronological order. Therefore, a horizon will never cross a fault. By using that grid as proposed by Pauget et al. in 2016, watertight geological models are first computed in 2D on every in-line and cross line and then computed in 3D by synchronisation of the relative geological times. Whereas traditional techniques are limited to a couple of faults and horizons, this technique allows the creation of watertight geological models with higher level of information coming directly from the seismic data. Stratigraphic intervals can be defined at various scales without limitation. A triangular mesh of the model allows interpreters to generate watertight horizons and extract fault polygons. A geo-cellular grid could similarly be computed and populated with rock properties for reservoir simulation applications.
Interpreters are now equipped with unique software that has automated the formerly manual process of picking lines in seismic data. This has made seismic interpretation drastically more efficient, delivering to the geo-modellers in days rather than weeks not only high quality and high resolution horizons and faults but also a preliminary fully seismically consistent geomodel. The new workflows being developed around the software are accelerating the entire exploration cycle, thus shaping the seismic interpretation of the future.
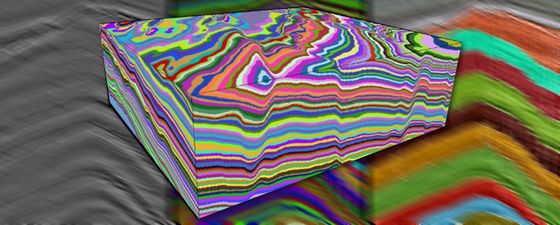
Application of the watertight geological modelling to a North Sea dataset: (a) seismic section, (b) RGT model using the horizon patch grid, (c) conversion of the RGT model in a watertight model, (d) 3D meshing of the watertight model. (Source: Eliis)
Application of the watertight geological modelling to a North Sea dataset: (a) seismic section, (b) RGT model using the horizon patch grid, (c) conversion of the RGT model in a watertight model, (d) 3D meshing of the watertight model. (Source: Eliis)
Application of the watertight geological modelling to a North Sea dataset: (a) seismic section, (b) RGT model using the horizon patch grid, (c) conversion of the RGT model in a watertight model, (d) 3D meshing of the watertight model. (Source: Eliis)
Application of the watertight geological modelling to a North Sea dataset: (a) seismic section, (b) RGT model using the horizon patch grid, (c) conversion of the RGT model in a watertight model, (d) 3D meshing of the watertight model. (Source: Eliis)
Acknowledgements
The examples presented in this article were obtained using PaleoScan™, software developed by Eliis. The author would like to thank Geoscience Australia for their permission to publish the data from block HCA2000A (Exmouth), as well as TNO and the Dutch government for the authorisation to publish data from block F3.
References
Bakke J, Gramstad O. and Sonneland L., Seismic DNA – A novel method using non-local search and multi attributes data sets, 74th Conference and Exhibition, EAGE, Extended Abstracts
Borgos, H. G., T. Skov, T. Randen, and L. Sønneland, 2003, Automated geometry extraction from 3D seismic data: 73rd Annual International Meeting, SEG, Expanded Abstracts, 1541–1544.
de Groot, P., Huck, A., de Bruin, G., Hemstra, N., and Bedford, J. The horizon cube: A step change in seismic interpretation! The Leading Edge 29, 1048-1055, September 2010.
Labrunye E., and Jayr S., Merging chronostratigraphic modeling and global interpretation, 83rd Annual International Meeting, SEG, Expanded Abstracts
Lomask, J., A. Guitton, S. Fomel, J. Claerbout, and A. A. Valenciano, 2006, Flattening without picking: Geophysics, 71, 13–20
Wu, X. and D. Hale, 2014, Horizon volumes with interpreted constraints. 84th Annual Meeting of the Society of Exploration Geophysics, Expanded Abstracts