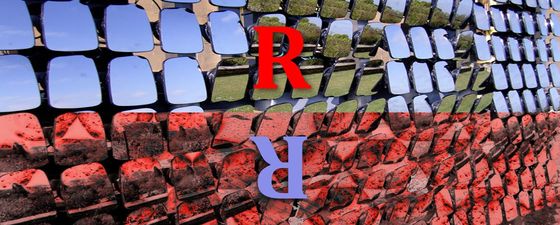
Reflection or Refraction?
Taking advantage of joint acquisition and processing techniques: a case study in the Barents Sea Bjørnøya Basin.
The Norwegian Sector of the Barents Sea is located in between the Norwegian mainland and Svalbard. As it developed it was affected by several tectonic events and now consists of a complex mosaic of platform areas and basins. It has significant commercial potential, making it a target for hydrocarbon exploration.
Although exploration activities in the Barents Sea have been ongoing for over 40 years, knowledge of the subsurface geology of the area is still limited, mainly due to its complex geological framework and the physical limits of contemporary methods of geophysical investigation.
Why Refractions?
Survey lines in the Barents Sea. (Source: Geology Without Limits)
Vast fault complexes, lithological heterogeneities, salt diapirism, steep dips and irregular bedding are all typical ‘scenery’ for a geological section of the Barents Sea area. These complexities mean that reliable data are hard to obtain using the most common survey technique – towed streamer reflection wave CDP seismic. Factors such as ray bending, scattering, diffractions, interference by adjacent reflections in high velocity formations are typical for reflected wave CDP surveys and these prevent geoscientists from acquiring reliable velocity models and final results in complex areas like the Barents Sea.
Refracted waves are an alternative way to gain knowledge about velocity distribution in rocks They penetrate areas inaccessible to reflected waves as their different method of propagation means they are not influenced by diffractions at first break events and are also insensitive to absolute values of velocities and depth of transmission. Thus a refracted wavebased velocity model can be a better, more stable and reliable alternative for signal enhancement data processing, migration procedures and time to depth conversions.
Recording Refractions
FloatSeis™ is a new marine seismic technology that enhances 2D/3D CDP reflection data with a velocity model derived from recorded ultra-long-offset refracted wave data. The main idea behind the technology is to make long-offset surveys much more affordable, especially important in a low oil price environment.
Several main factors in this method considerably reduce the total price of long-offset refracted wave seismic surveys. Firstly, 2D long-offset refracted seismic surveys can be conducted simultaneously with towed streamer CDP seismic data acquisition, so no additional seismic vessel with a high day rate is required (Figure 1). Moreover, the recording equipment can be deployed from the seismic vessel itself or from a boat associated with the seismic vessel, making long-offset refracted wave seismic surveys even more affordable.
Recording ultra-long-offset data is undertaken with the help of free-floating autonomous recording seismic units with a built-in online tracking system, which allows online monitoring of the position of all recording units at any place and at any time. In addition, it enables tracking of the status of the data recording process, the battery charge level and the readings of internal auxiliary sensors such as temperature, humidity and accelerometer. As a result equipment reliability, survey accuracy and marine operational safety are increased and considered equivalent to the highest industry standards.
Figure 1: The newly-developed acquisition technique. Recording long-offset refraction data enables the creation of accurate velocity models, free of low-quality definition areas. (Source: Geology Without Limits)
Bjørnøya Basin Survey
The Bjørnøya Basin’s challenging geological framework appears to be a perfect environment for the application of FloatSeis technology, so a survey was undertaken in the basin in October 2016. The target depth of the survey was 5 km, the bottom of the Jurassic section containing a number of possible reservoir plays. Over 100 line-km of 2D long-offset refraction data was obtained during the survey. Recording units were deployed 3.5 km apart and shot point spacing was 37.5m, using a 6,100 cu. inch seismic source, and the 12 km-long towed seismic streamer simultaneously recorded 960 channels. Free-floating units recorded refracted waves on the offsets up to 30 km, which enabled the building of a reliable refracted wave velocity model up to 5.5 km depth.
Data processing was undertaken with two parallel routines. Before migration, streamer reflection data was processed in the standard manner used for marine surveys, the main procedures in the processing sequence being multiple suppression by wave-field modelling, linear events suppression by slant-stacking, ghost notch correction for shot and receiver and parabolic radon filtering. In addition, a grid depth-velocity model was built based on seismic reflection velocity analysis followed by iterative velocity update.
Processing FloatSeis refraction data involved picking first arrivals followed by tomography inversion of the picked traveltimes using an algorithm for maximum smoothness, which is most applicable for surface observations. The result of the tomography processing of the refraction data was an independent depth velocity model.
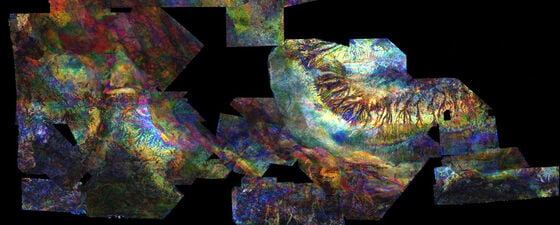
Finally, after undertaking pre-stack migration (Kirchhoff PSDM) with both velocity models it was possible to obtain two alternative versions of depth sections, shown in Figure 2, with the reflection and refraction velocity models overlaying the corresponding depth section. As can be seen, the refraction velocity section demonstrates better geological consistency and smoothness when compared to the reflection velocity section, which in its turn is less smooth and is muddied by distinctive anomalies that are not correlatable with geology.
Figure 2: Reflection (a) depth velocity section versus refraction (b) (tomography) velocity section with overlaying corresponding PSDM sections.
Figure 2: Reflection (a) depth velocity section versus refraction (b) (tomography) velocity section with overlaying corresponding PSDM sections.
A quality comparison of the depth migrated sections with the different velocity models derived from reflection and refraction seismic shows that refraction tomography velocity clearly improved both the focusing and positioning of the seismic images especially in the deeper part. Figure 3 displays the main zones where refraction velocities have allowed enhanced depth imaging results when compared to reflection velocities.
Figure 3: Reflection PSDM section (a) versus refraction PSDM section (b) with enhanced areas highlighted.
Figure 3: Reflection PSDM section (a) versus refraction PSDM section (b) with enhanced areas highlighted.
Quantitative Evaluation
To analyse the available seismic data, PSDM tomography-based and CDP-based seismic sections were converted to the time domain. The line crosses three wells – 7, 8 and 9 – and synthetic models for wells 8 and 9 are presented in Figures 4 and 5. Well 9 has sonic and density logs and check shot data, while well 8 has sonic and density logs. For seismic to well ties in both wells a check shot from well 9 was used. Both wells use a similar wavelet – Ormsby.
Figure 4: Seismic to well tie for well 9. (Source: Geology Without Limits)
Figure 4: Seismic to well tie for well 9. (Source: Geology Without Limits)
A comparison of the synthetic models (Figures 4, 5) demonstrates a higher correlation between the refraction tomography-based seismic and the synthetic model than CDP-based seismic and the model. Due to similar time processing flow parameters, the only difference that exists is in the velocity model, which can be explained by the refraction velocity model better fitting the real subsurface conditions than the CDP velocity model.
Figure 5: Seismic to well tie for well 8. (Source: Geology Without Limits)
Figure 5: Seismic to well tie for well 8. (Source: Geology Without Limits)
The models were not stretched or squeezed and are shown ‘as found’. As can be seen, the correlation coefficient of PSTM tomography is higher than the PSTM CDP, evidence of the better fit of the tomography velocity model to the real velocity model.
Revealing the Advantages
The Barents Sea Bjørnøya Basin case study shows that joint processing of refracted and reflected wave data helped to create an accurate velocity model free of low-quality definition areas. The final data reduces uncertainties in the velocity models, increases the level of confidence in the interpretation stage and helps build a detailed geological section with better well ties of the area under study.
Moreover, in areas with a complex geological environment where reflections could result in controversial velocity models, the refraction tomography model can accommodate features such as lateral velocity changes, steep dips, high velocity formations and screening layers.
The maximum depth of refraction wave penetration can be roughly defined as 15–20% of the longest offset, meaning that a towed 12 km seismic streamer can only illuminate a 2.0-2.5 km depth range. FloatSeis technology extends the active marine spread, enabling a real depth of investigation of up to 7-8 km, as this case study has shown.