Vietnam – Improved Images of Fractured Basement
Detecting basement reservoir fractures on Vietnam’s first ocean bottom seismic survey in the Cuu Long Basin
It is estimated that two billion barrels of oil will be produced from fractured basements in Cuu Long Basin. Can we detect these fractures on seismic data? Can we distinguish good reservoirs from bad? Can we extend the life of producing fields? Results from Vietnam’s first ocean bottom seismic (OBS) survey demonstrate the benefits of higher density full azimuth seabed data to enhance our understanding of fractured basement reservoirs.
Fractured Granite Reservoirs
The ‘buried hill’ basement play in the Cuu Long Basin is unusual in the fact that the shale source rocks are younger than the fractured reservoir. The concept is described by Cuong & Warren (2009), as illustrated in Figure 1 (below).
In some fields, these fractured reservoirs can be extremely productive, whilst others struggle to be economic. PetroVietnam’s prolific Bach Ho oil field has exceptional reservoir characteristics, whilst the Dai Hung Field with similar structure and fractured basement failed to produce economically. Since fracturing varies enormously both between and within basement structures, it is essential to understand fracture development in order to identify the most productive areas and implement successful appraisal and development programs.
Figure 1: Cuu Long fractured basement play. (Source: Cuong & Warren, 2009, courtesy Journal of Petroleum Geology)
Can Seismic Detect Fractures?
Large scale faulting and fracturing can be seen and mapped on conventional towed streamer 3D data, but the quality of the fracture image has always left uncertainty in the interpretation (Figure 2a). Furthermore, small scale fractures are below seismic resolution and cannot be seen directly on the 3D seismic image.
Figure 2: (a) 3D towed streamer data 2009 Kirchhoff PSDM; (b) 3D full azimuth OBS data 2016 Kirchhoff PSDM. Large scale fracturing and faulting can be seen on both single azimuth towed streamer and full azimuth OBS data, but fractures are much clearer on the OBS data.
Figure 2: (a) 3D towed streamer data 2009 Kirchhoff PSDM; (b) 3D full azimuth OBS data 2016 Kirchhoff PSDM. Large scale fracturing and faulting can be seen on both single azimuth towed streamer and full azimuth OBS data, but fractures are much clearer on the OBS data.
Figure 3: Diagram showing fast and slow directions caused by fracturing.
Prevailing theory, modeling and industry experience all suggest that both small and large scale fractures can be detected by comparing seismic data that has been acquired in different directions – a phenomenon called azimuthal anisotropy. The concept is illustrated in Figure 3, which shows sound waves traveling faster in the direction parallel to the fracture orientation and slower when travelling orthogonal to the fractures. The difference between the fast and slow velocities indicates the magnitude of the fracturing, and the direction of the fastest velocities indicates the orientation of the faulting. Azimuthal anisotropy occurs on both compressional wave seismic (PP) and on shear wave converted wave seismic (PS), the effect being considerably larger on the PS data. In both PP and PS, the effect is greatest at higher incidence angles and longer offsets.
There are several measurements that can be made that will help describe the scale and direction of the anisotropy. Direct measurement of velocity can be made from seismic travel times on both PP and PS data. However, since reflectivity depends on seismic velocity, variations in amplitude at far offsets is also a measure of azimuthal anisotropy and fracturing. Modeling studies using well data from a Cuu Long producing field predict azimuthal amplitude variations at the top basement reflection of 14% for PP data and 28% for PS data. These predictions are for 30 degree incidence angles.
What Kinds of Seismic Data are Needed?
In order to compare seismic attributes from different azimuths, it is undoubtedly essential to acquire seismic data that sample the full azimuth and offset range. The dilemma is that until recently, all 3D images consisted of single azimuth towed streamer data that produce measurements in one direction only; furthermore, these data measure the PP wave field, not the PS wave field where the azimuthal effects are likely to be the greatest. It is optimal to acquire both PP and PS data that fully sample all azimuths and all offsets – i.e. full azimuth seismic – to enhance our understanding of fractured basement reservoirs.
Although it is possible to acquire full azimuth data using the 3D towed streamer method, there are several reasons why ocean bottom seismic should provide the highest quality dataset. Since seismic receivers and sources are independent of each other, there is more flexibility in how to sample azimuth and offset. High fold, well sampled data yield a better direct image of the faults and fractures through improved illumination and noise attenuation. In addition, towed streamer data contain only PP data recorded in the water column. Ocean bottom receivers geophones in addition to a hydrophone, generate PS data recorded on the horizontal component geophones. Finally, the combination of the hydrophone signal with the vertical component geophone signal gives us a broadband, high resolution image that is rich in low frequencies.
Bach Ho Ocean Bottom Seismic Survey
Vietnam’s first OBS survey was acquired over VietsovPetro’s Bach Ho Field by Seabed Geosolutions in 2015. The survey was designed to record data from all azimuths and offsets out to 6 km and beyond.
The 850 km2 survey, which was large enough to image the entire basement structure, was completed in five months. Seabed Geosolutions used the Sercel Searay Ocean Bottom Cable (OBC) system with an orthogonal shooting geometry that allowed the recording of full azimuth data. Trace density was significantly higher than the legacy towed streamer 3D, with 576 fold in the 0–5 km range compared to the vintage 2009 data which was single azimuth, 50 fold with a 5 km streamer.
Figure 4: PP ‘snail gather’ clearly shows how travel times vary with azimuth.
Processing was performed by CGG in Singapore using a state of the art pre-stack depth migration sequence outputting azimuth sectored PP and PS stacks for analysis.
The improvement in data quality due to both OBS acquisition and advanced processing resulted in a much clearer picture of the basement faulting on the PP stack, where large faults in the granite can be picked with much more confidence, as illustrated in Figure 2b. In addition to the improved basement image, the combination of OBC hydrophone and geophone data has improved the resolution of the shallower section.
As well as improved full azimuth stacks, we can clearly see azimuthally varying velocities on both the PP and PS data. The PP ‘snail gathers’ shown in Figure 4 illustrate how far-offset travel times vary with azimuth. Comparisons of fast and slow shear wave travel times can be displayed in map form to show how anisotropy and fracturing varies along a particular seismic event. As can be seen, both PP and PS azimuthal anisotropy occurs at all levels, not just at the top basement.
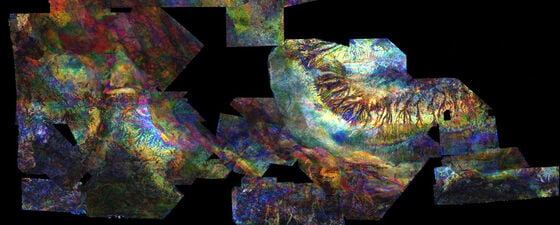
Figure 5 shows the difference in travel time between the fast and slow shear wave data for a shallower horizon at a depth of around 2 km. The variation in anisotropy is clear and makes geological sense, with the highest anisotropy being seen around the location of known faults.
Figure 5: Shear wave splitting analysis shows clear time delays between fast and slow directions on the full azimuth OBS data.
Unfortunately, a similar analysis of the top basement is less clear since deeper travel times are affected by what occurs in the shallower section, and further efforts need to be implemented to unravel the overburden effects in order to reveal a reliable picture of fracturing in the basement. Recent advances in this field look encouraging for application in this dataset (e.g Boiero and Bagaini, 2016).
So far, only the effects of anisotropy have been considered on PP and PS travel times. What about seismic amplitudes? Can reliable anisotropy measurements be obtained at the deep top basement reflection from PP and PS amplitudes?
Ideally, it is best to measure and compare the amplitudes of the far-offset azimuth sector stacks where the expected azimuthal amplitude effects should be the largest, but these data are not always available. In this case, the amplitudes from full offset stacks of both PP and PS data were compared as shown in Figure 6 (below).
For the shallower horizon, it is comforting to see that the anisotropy maps for both PP and PS amplitudes look very similar in form to the maps produced from the shear wave travel time measurements, with areas of greatest anisotropy located around the position of known faulting. For the deeper event at the top basement, we also see azimuthal effects that relate to the structure, but there remains uncertainty as to whether these azimuthal effects are due to fracturing, or due to variations in illumination or noise.
Figure 6: Magnitude of PP (a) and PS (b) azimuthal amplitude anisotropy. Difference in amplitude between the hottest and coolest azimuths in both cases.
Figure 6: Magnitude of PP (a) and PS (b) azimuthal amplitude anisotropy. Difference in amplitude between the hottest and coolest azimuths in both cases.
Enhanced Understanding
The higher density, wide azimuth ocean bottom cable data deliver improved images of basement fracturing and faulting, which enhance our understanding of the distribution of high quality basement reservoir.
Azimuthal anisotropy can clearly be seen on travel times and amplitudes of both PP and PS data. On the shallower horizons, the azimuthal effects occur around areas of known faulting, so the correlation beween anisotropy and faulting is convincing. On the deeper basement events, azimuthal effects can also be seen, but other factors such as azimuthal variation in illumination are limiting our ability to reliably map the basement fractures using anisotropy measurements. Further work to compensate for the overburden should result in better basement fracture maps in the future. Correlation of oilfield production data with these fracture maps will help confirm our predictions.
Acknowledgement
Thanks to VietsovPetro and PetroVietnam for permission to publish this article.
References
Schmidt, W. J., Nguyen, V. Q., and Pham, H. L., “Tectonic development of the Cuu Long Basin, Vietnam”. Proceedings of the Science Conference on 25th Anniversary of the Vietnam Petroleum Institute. 2003.
Cuong, Trinh Xuan, and Warren, J. K., “Bach Ho field, a fractured granitic basement reservoir Cuu Long basin, offshore SE Vietnam: A ‘buried hill’ play”. Journal of Petroleum Geology 32.2 (2009): 129-156.
Boiero, D. and Bagaini, C., “Horizon-based Splitting Intensity Analysis and Inversion for Anisotropic Characterization”. 78th EAGE Conference and Exhibition 2016, 2016.
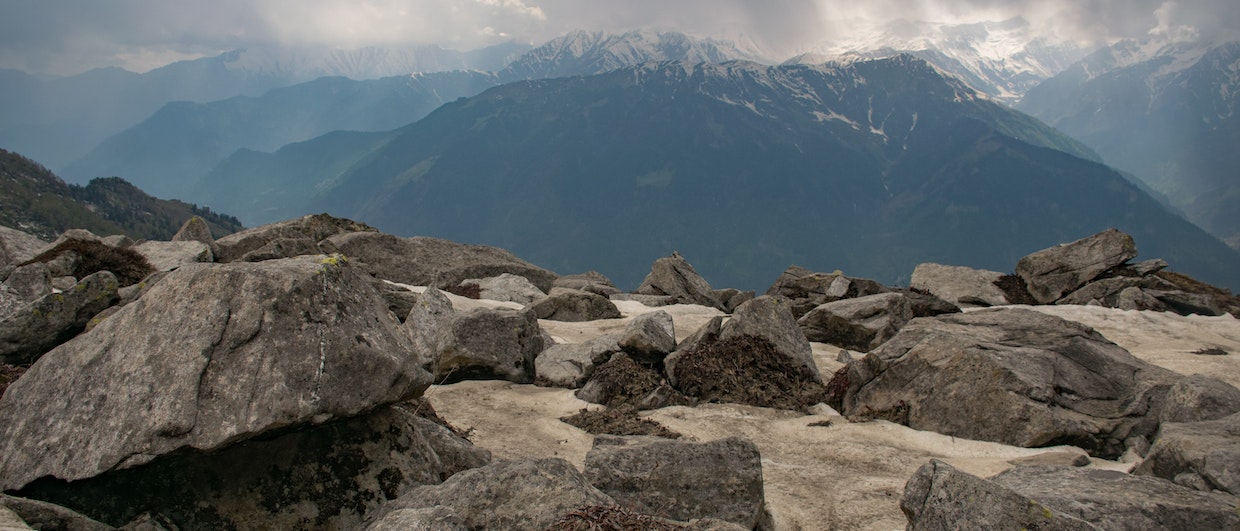
* Title image – ‘Fractured granite basement outcrop in Na Trang’ (© Alan64/Dreamstime.com)