Unlocking the Petroleum Potential of Iran
GIS databases are a powerful tool for minimising exploration risk in Iranian hydrocarbon basins through geospatial analysis.
Iran’s enormous surface area stretches over 2,300 km in a north-west to south-easterly direction – almost the distance from London to Istanbul. Inside this extensive territory, there are several highly prospective sedimentary basins, which host several world-class petroleum plays. Iran holds the fourth-largest proven crude oil reserves and the second-largest natural gas reserves in the world (EIA, 2015).
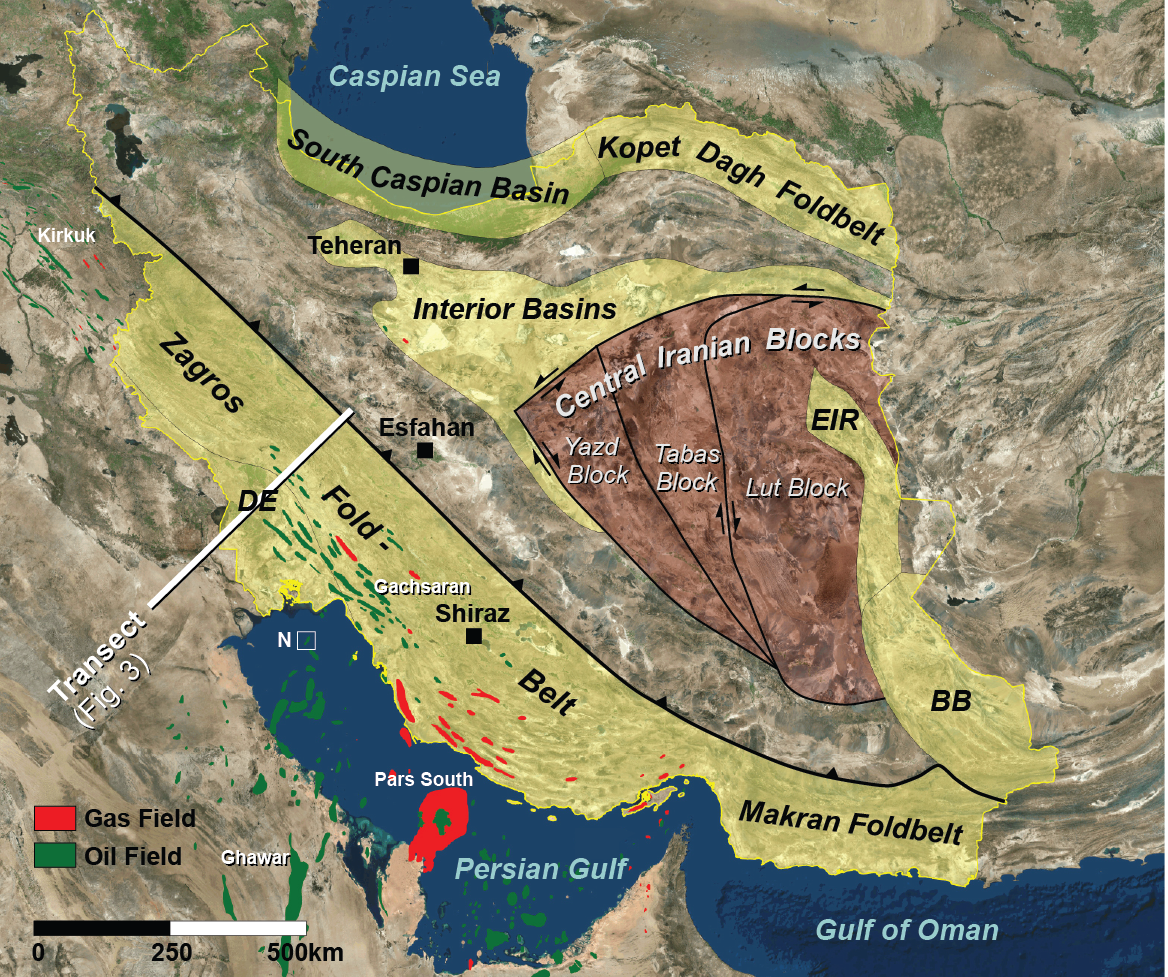
In simple terms Iran can be described as an assemblage of rigid crustal blocks forming the centre of the country, surrounded by a number of mobile orogenic belts (Figure 1), with the Zagros foldbelt being the most prominent and most prolific of these basins. In this article we will demonstrate how modern GIS databases can help to conduct regional studies and how they support exploration teams in reducing drilling risks in established and frontier hydrocarbon basins.
GIS Databases: Workflows and Benefits
A comprehensive proprietary GIS database covering the Middle Eastern countries from Egypt to Oman is currently being built by Falcon Geoconsulting. To date, this database, which covers Iran, already contains more than 30,000 GIS-based features, including digital elevation data, newly interpreted sedimentary basin outlines, distribution of salt basins, tectonic provinces, re-interpreted structural elements, structural cross-sections, basement maps, individual categorised faults, fold axes, lineaments, seeps, hydrocarbon fields, wells, individual salt structures, undrilled prospects, stress data, structural play fairway maps, cultural data and many other elements. The data is incorporated from publicly available sources and it is consistently georeferenced and digitised, before being integrated and re-interpreted according to the latest geological concepts. The database specifically focuses on tectonic and structural data, such as different types of faults and lineaments, present-day stress data, fracture data, etc.
The benefits of such a database are twofold. Firstly, statistical GIS data on petroleum basins is fundamental for regional evaluations, in order to understand how exploration-mature certain basins are and where upside potential is located. Whilst this data will help to de-risk existing plays, it can also be used to develop new ones. Secondly, local structural data, such as lineaments, categorised faults, fractures and stress data, will greatly help with projects at the prospect or field scale, supporting field development strategies and – ultimately – result in better recovery factors.
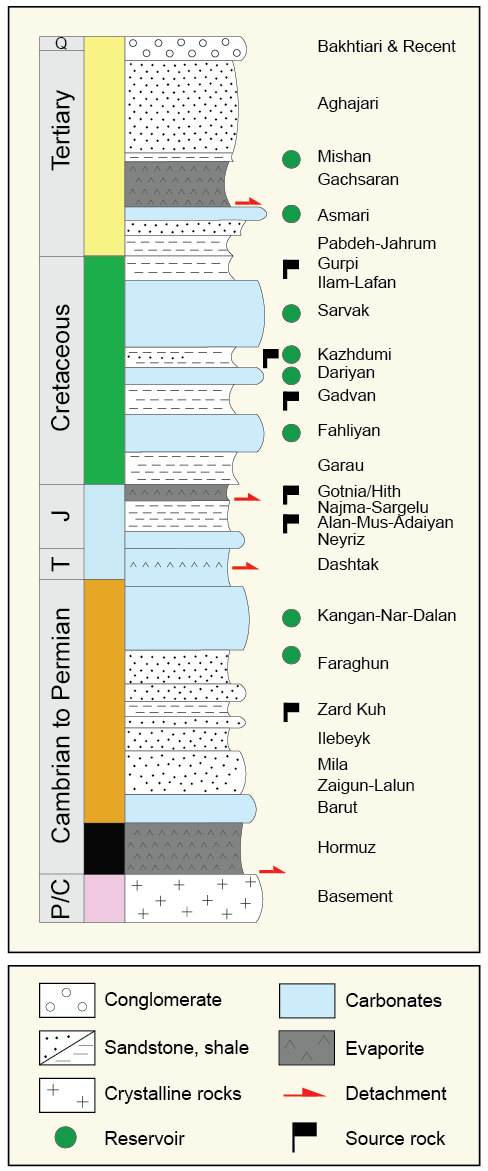
The data integration has already led to a detailed stratigraphic understanding of the different basins of Iran. Figure 2, detailing the Zagros zone, illustrates the way in which numerous highly prospective petroleum plays are stacked vertically above each other, explaining why the Zagros belt is such a prolific hydrocarbon province.
Data Integration and Regional Structural Analysis
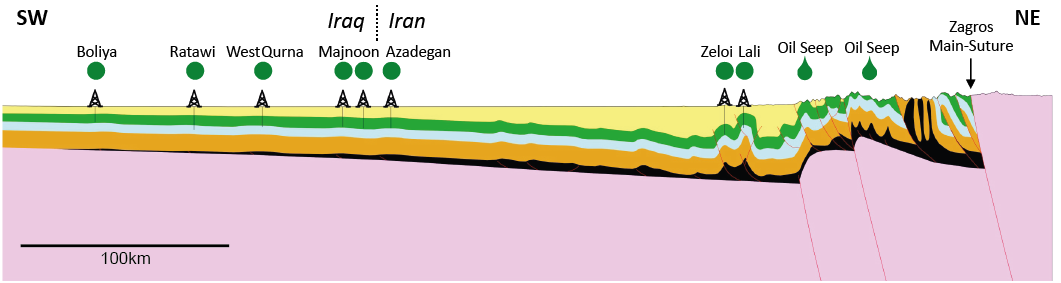
Digital elevation, well, geochemical and remote sensing data, together with structural geology and other data sources, are integrated to build regional structural cross-sections. The transects can be restored incrementally to their pre-deformational state, with the aim of understanding the lateral distribution, relief, timing, migration routes, access to kitchens and charge risk of paleo-structures.
The transect in Figure 3 reveals how thin- and thick-skinned structural styles interact. Near the Zagros thrust front most of the relief is generated by deeply rooted thick-skinned structures, whilst a superimposed thin-skinned system adds additional relief (e.g. Kashfi, 1980; McQuarrie, 2004). The thickness of the Hormuz salt decreases significantly westward and so does the influence of the thick-skinned structures, meaning that the distal structures are much less pronounced than the proximal ones, located above thick salt. Distal structures such as Azadegan, Majnoon or Ratawi still accommodate shortening through salt-detachment, but the importance of evaporites is much lower there than at the mountain front. In the absence of Hormuz salt, salt-detached traps cannot form, an important observation when exploring for salt-related prospects.
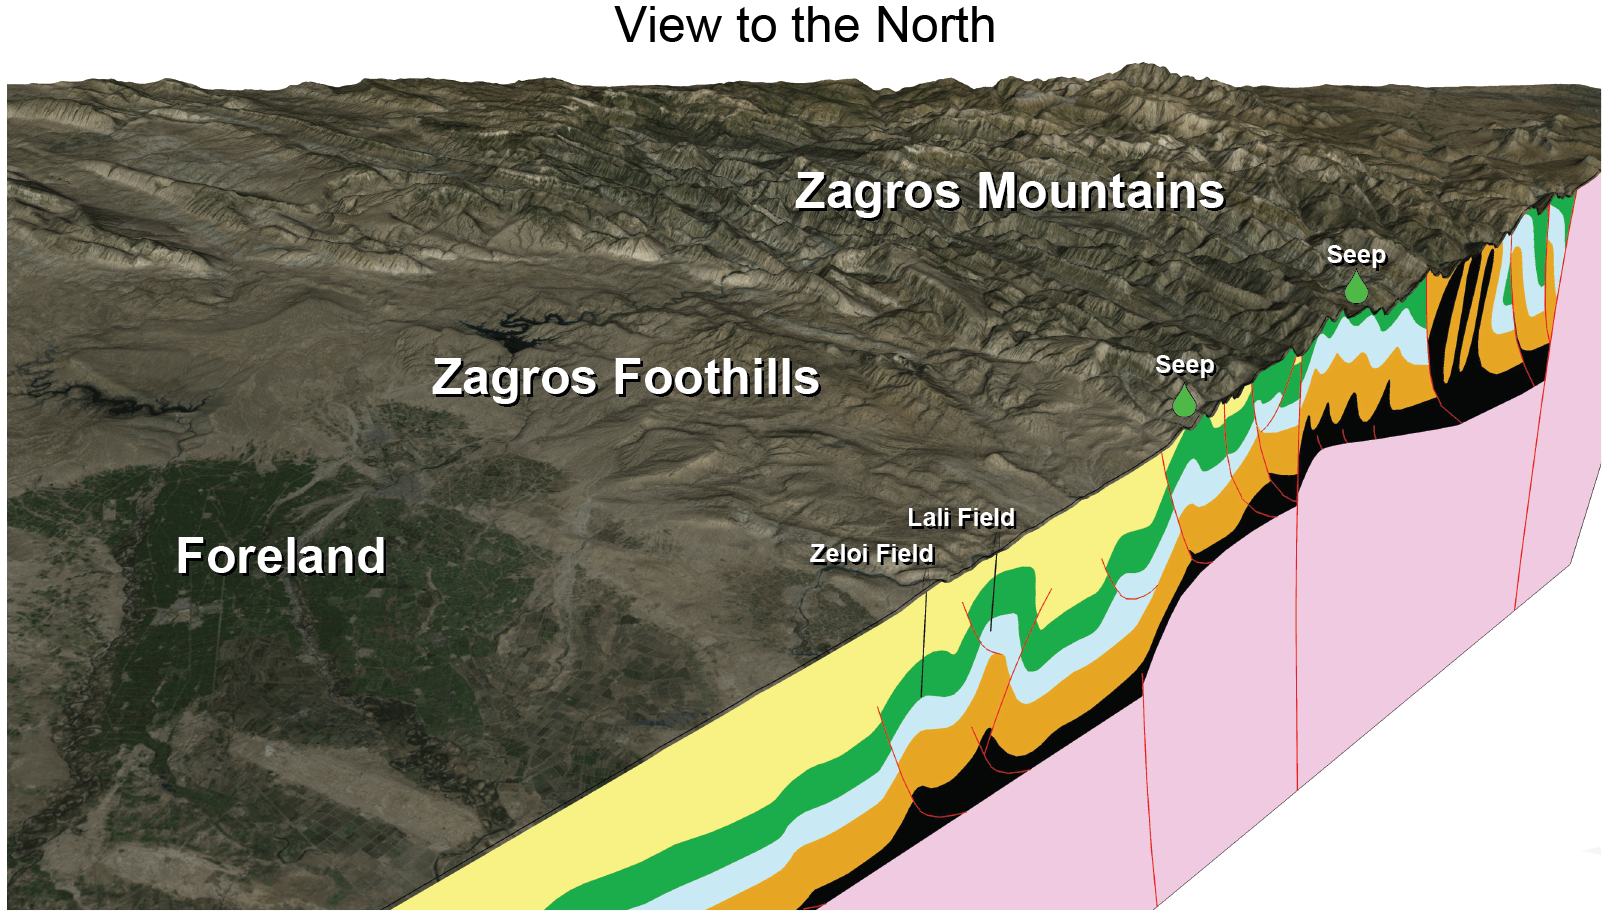
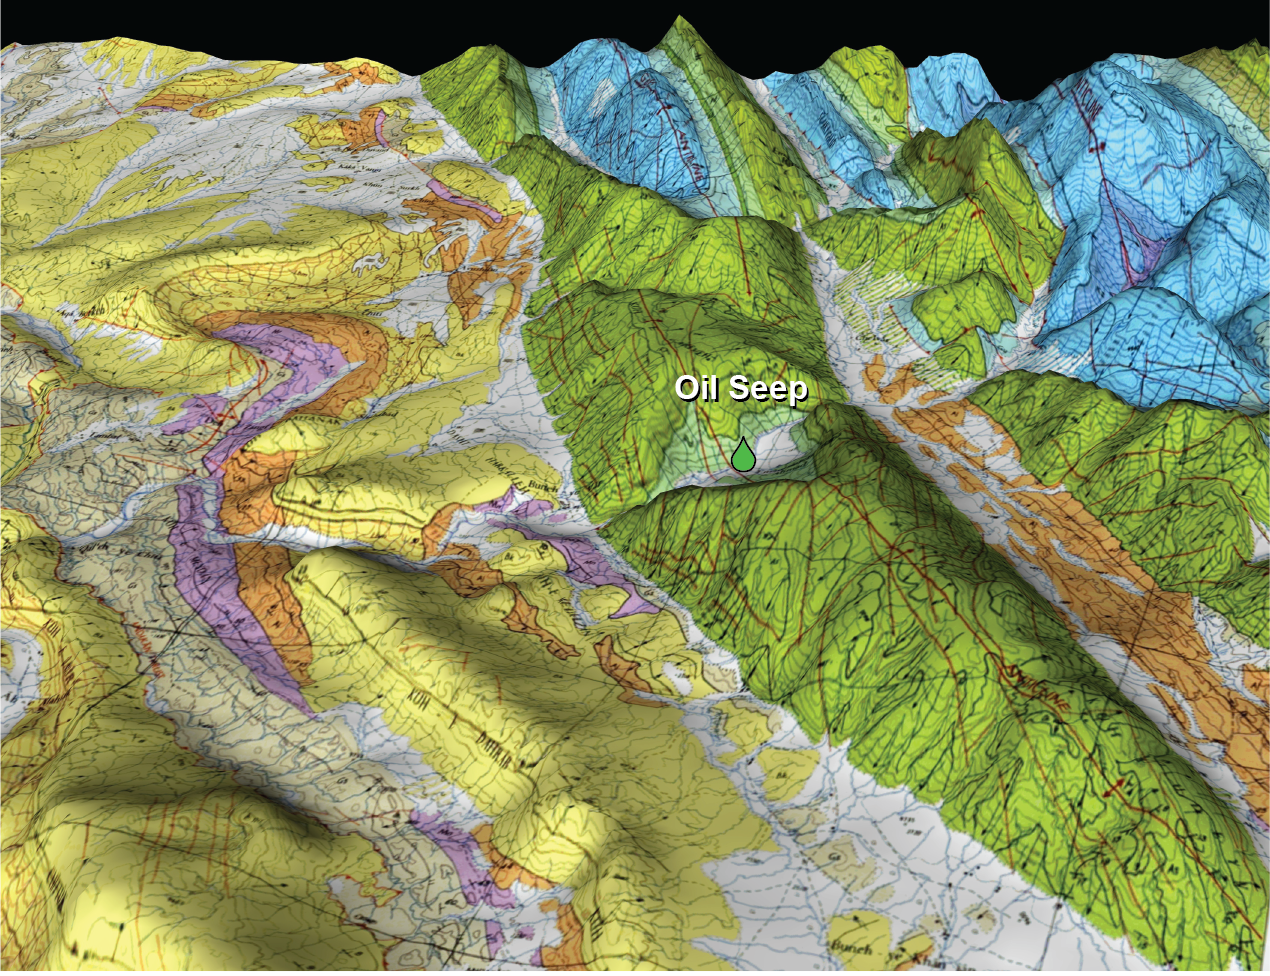
Known oil seepages are found mainly in highly deformed strata near the mountain front, where either hydrocarbons migrate to the surface via leaking faults or, alternatively, previously buried and impregnated reservoirs are currently being eroded at the land surface. 3D visualisations of satellite imagery and subsurface data help to assess the context of structural models and possible breaching risks of prospects (Figure 4).
Mitigating Exploration Risk in Iran’s Petroleum Basins
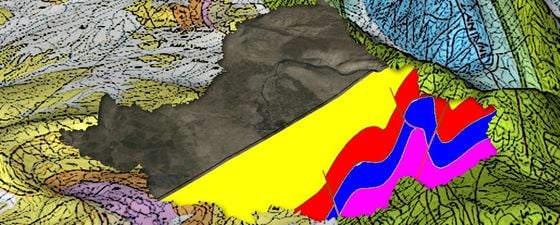
A very valuable tool in exploration risk management is the integration of remote sensing data, surface geology and geochemical information from oil seeps. These must be very carefully assessed, as oil seeps or oil impregnations may be indicative of different scenarios. An oil seep above a trap may indicate that the structure is breached and is actively leaking hydrocarbons to the surface, while seeps located between the kitchen and the trap may mean that the migration has been inefficient and the trap may not be fully charged. Seeps located updip from the kitchen but beyond the prospect may indicate that migrating oil has reached the trap, filled it to spill and is migrating further updip towards the basin edge. Tectono-morphologic visualisations (see Figure 5), if part of an integrated workflow, significantly help to assess the spatial context of migration routes and breaching risks.
To fully explore the vast potential of the Iranian hydrocarbon resources, we believe that surface and subsurface data integration should be undertaken for all potentially prospective Iranian basins, utilising the latest technological and geological methods. A lot of data is available for the established Iranian basins, which have been explored for decades, where consistent GIS and structural data integration will contribute to the discovery of new reserves and to optimised recovery from existing fields. For Iran’s frontier basins, such as the Central Iranian Basins, where only a few discoveries have been made to date, as well as the South Caspian Basin, the Amu-Darya Basin (hosting major gas-condensate fields) and the Kopet-Dagh belt, GIS analysis and structural assessment will lead to a better understanding of the prospectivity and will therefore help to uncover upside potential that has been overlooked so far.
Prospect and Field Scale Assessment
In addition to giving a regional perspective, the integration of a statistically significant number of structural data elements (faults, anticlines, lineaments, domes, arches, etc.) at the prospect-scale allows for the detailed assessment of individual reservoirs and their associated production behaviour. The integration of present-day stress data, for example, directly mitigates operational risks, as it has implications for well planning, borehole stability, breakouts, induced fractures, the behaviour of open versus closed fractures, coring operations, production and injection behaviour.
For the assessment of fractured reservoirs (clastics or carbonates) it is necessary to build 3D reservoir models, based on seismic data, well logs, surface geology (if applicable), production data and core data. Once the static 3D structural model is finalised, kinematic structural modelling is conducted, which is needed for two reasons. Firstly, as a quality assurance tool it will quickly reveal geometric inconsistencies in the model; and secondly, kinematic modelling allows for strain analysis of the reservoirs and seals and can help to detect ‘sweet spots’ (areas of higher fracture intensity) in the reservoir and to map highly strained areas in the cap rock, possibly indicative of a damaged seal.
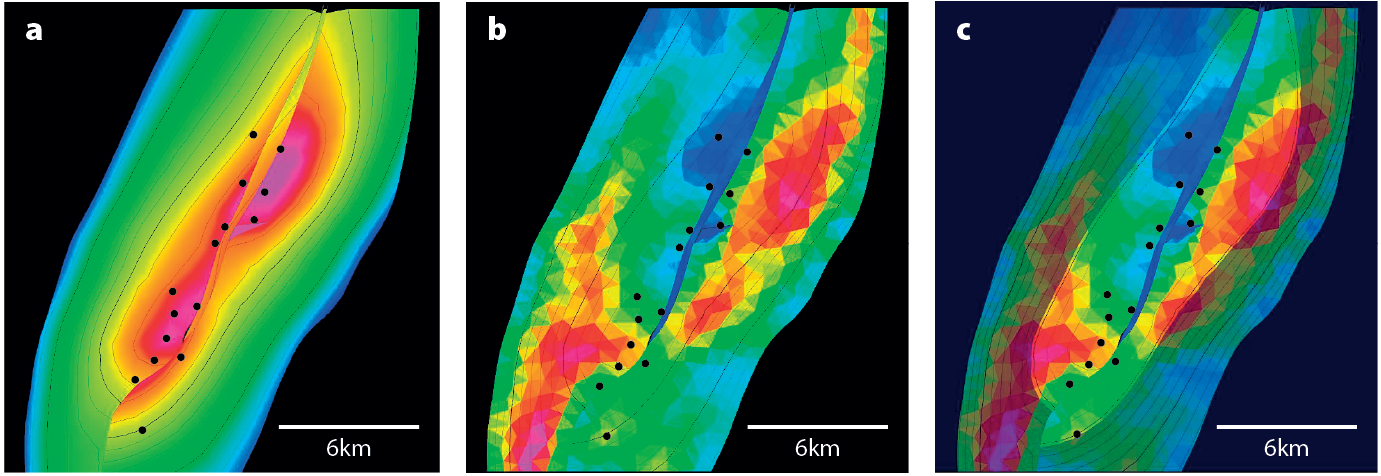
A structural 3D model of the Nowrooz Field, based on public data, reveals that its overall structure is a transpressional anticline, over 18 km long, dissected by two longitudinal faults (Figure 6). The main reservoir here, the Azadegan sandstone, belongs to the Early Cretaceous Kazhdumi Formation (Ghazban and Motiei, 2007). Curvature analysis was conducted and two anomalies of increased curvature have been mapped, one in the south-west quadrant and the other to the north-east. When displaying the oil water contact, present well locations and the curvature anomaly, it is easy to see undrilled and highly curved domains which could be potential targets for future infill drilling.
If detailed and localised fracture data from wells, cores, image logs and outcrops is available for a field, discrete fracture network models can be built and exported directly into reservoir simulation software. These models are a strong tool to better understand and optimise fluid flow inside the reservoir. Fracture analysis and fracture modelling will also improve extraction and injection strategies as well as permeability-enhancement of reservoirs. Hence, if applied correctly, these workflows may help to prevent early water breakthrough (or other reservoir damage) and enhance the ultimate recovery rates of fractured reservoirs.
Outlook
This article gives an insight into how modern GIS database management can help optimise basin-scale or field-scale petroleum projects. For a robust workflow it is fundamental that the data be integrated with modern geological and structural concepts. In our experience, it is common for G&G staff to work on the prospect-scale without the regional context, which can lead to interpretation biases and consequently to dramatically wrong strategic and economic decisions. For both exploration and development projects, the regional context has a tremendous economic impact, a fact often overlooked by explorers and managers. We suggest the regional GIS approach should be used for any exploration or development project.
If the data is integrated consistently and according to modern concepts, GIS databases are a powerful tool to minimise exploration risks and to unlock new petroleum potential, in Iran or elsewhere.
References
Alsharhan, A. S. & A. E. M. Nairn, 2003, Sedimentary basins and petroleum geology of the Middle East, Elsevier, Amsterdam.
Barzgar, E., Abdollahie Fard, I., Hamidzadeh Moghaddam, R., Abdollahi Khalili, E. and A. Garavand, 2015, Geological analysis and updating velocity model by restoration of a cross section in Zagros fold-thrust belt in the southwest of Iran, Arab Journal of Geoscience, 16 p.
EIA, 2015, Iran – International energy data and analysis (report).
Ghazban, F. & H. Motiei, 2007, Petroleum Geology of the Persian Gulf; Teheran University and NIOC.
Jahani, S., Tectonique salifere, plissement et fracturation dans les provinces du Fars Oriental et le domaine marin adjacent du Golfe Persique (Iran), Doctoral Thesis, Cergy University, 245 p.
Kashfi, M. S., 1980, Stratigraphy and environmental sedimentology of Lower Fars Group (Miocene), South-Southwest Iran, AAPG Bulletin, 64, p. 2095-2107.
Perry, J. T. & A. Setudehnia, 1967, Geological Sheet, Lali area, 1:100.000, Teheran.
McQuarrie, N., 2004, Crustal scale geometry of the Zagros fold-thrust belt, Iran, Journal of Structural Geology, 26, p. 519-353.