Uniting the Arctic
A new generation of Circum-Arctic geological and geophysical digital maps will reveal new data about the hydrocarbon potential of the region.
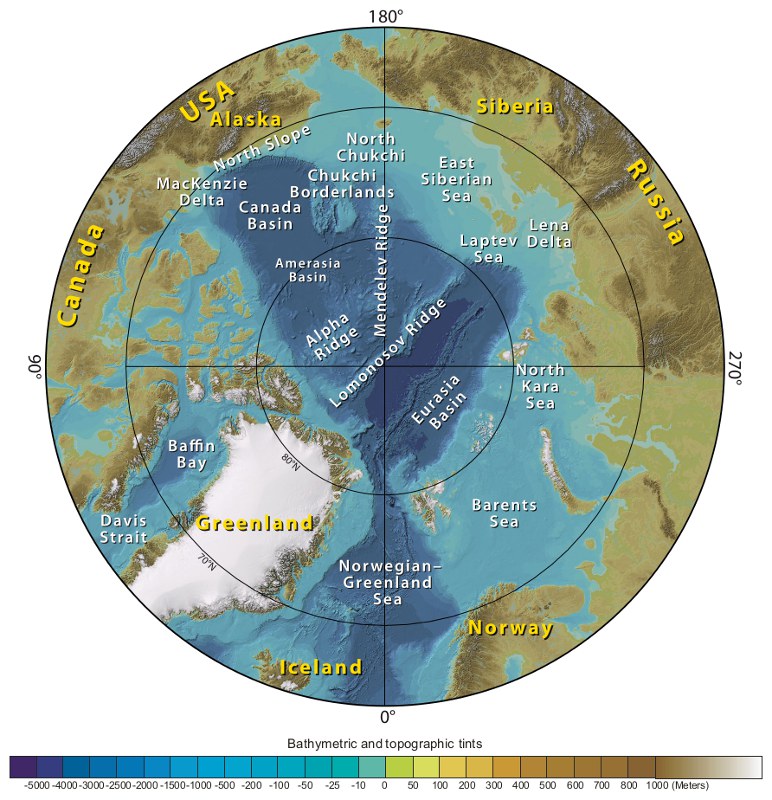 The Arctic Circle.The Arctic contains some of the world’s largest hydrocarbon provinces, including the West Siberian basin, as well as several other world-class petroleum-bearing regions, such as the Timan-Pechora Basin, the North Slope of Alaska, the Barents Sea and the Norwegian Sea. These latitudes also contain a significant potential for metallogenic resources, as well as holding large volumes of prospective industrial minerals.
However, the Arctic is largely unexplored with respect to mineral resources, and there is a rapidly growing need to effectively assess the resource potential of the Circum-Arctic region. A meaningful assessment must be based upon an evaluation using updated geological and geophysical data and knowledge. Initiated in 2003 by the Russian Ministry of Natural Resources, an international effort to compile Circum-Arctic geophysical (magnetic and gravity) and bedrock data has been undertaken by a consortium of national agencies from Canada, Denmark, Finland, Norway, Russia, Sweden and the USA.
The project has so far provided new geological and geophysical digital maps, at a scale of 1:5 million, for the Circum-Arctic region limited by the 64°N latitude (60°N latitude for the NW Europe and Canadian regions). Further tectonic/ structural and metallic ore deposits maps are being developed. The new Circum-Arctic maps are formally published under the Commission for the Geological Map of the World (CGMW/CCGM).
History of Arctic Mapping
The world’s first specific map of the High Arctic and North Pole is considered to be Mercator’s Arctic projection from 1569, where Mercator first introduces his revolutionary polar projection. Today, the map is known as pure fantasy, but for hundreds of years a central Arctic landmass was considered very likely.
In 1599 the voyage by Willem Barents to what at that time was known as the Murman Sea (the ‘Northern Man Sea’) resulted in a more realistic picture. Barents mapped Svalbard (Spitsbergen) for the first time, on the map indicated as ‘Het Nieuwe Land’ (Dutch for ‘New Land’). However, the High Arctic still remained an unknown frontier for more than 200 years.
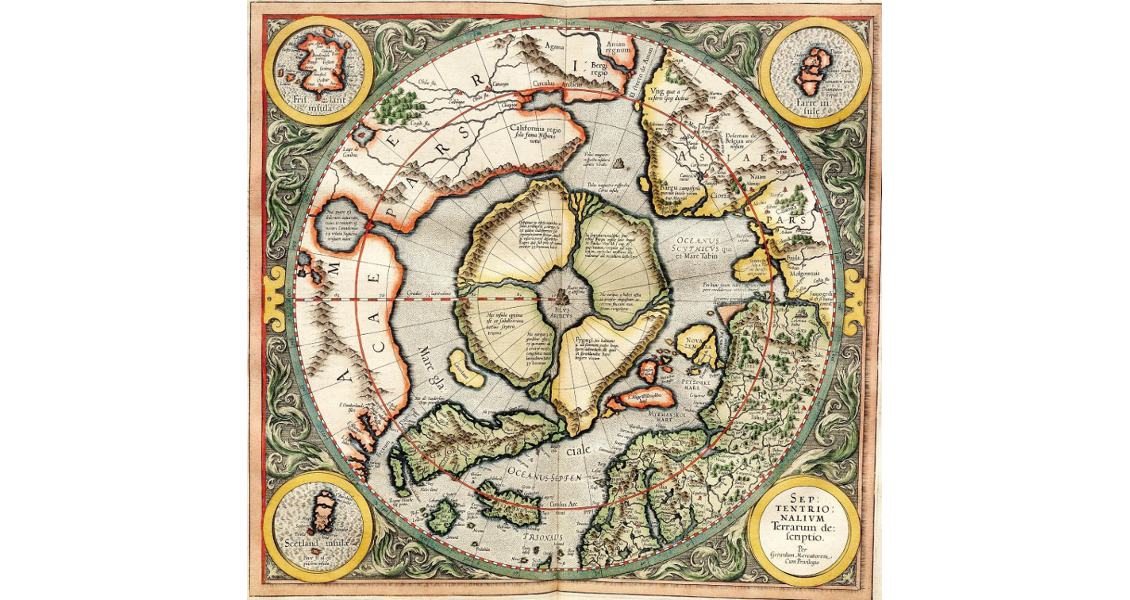
Mercator’s Arctic projection from 1569.
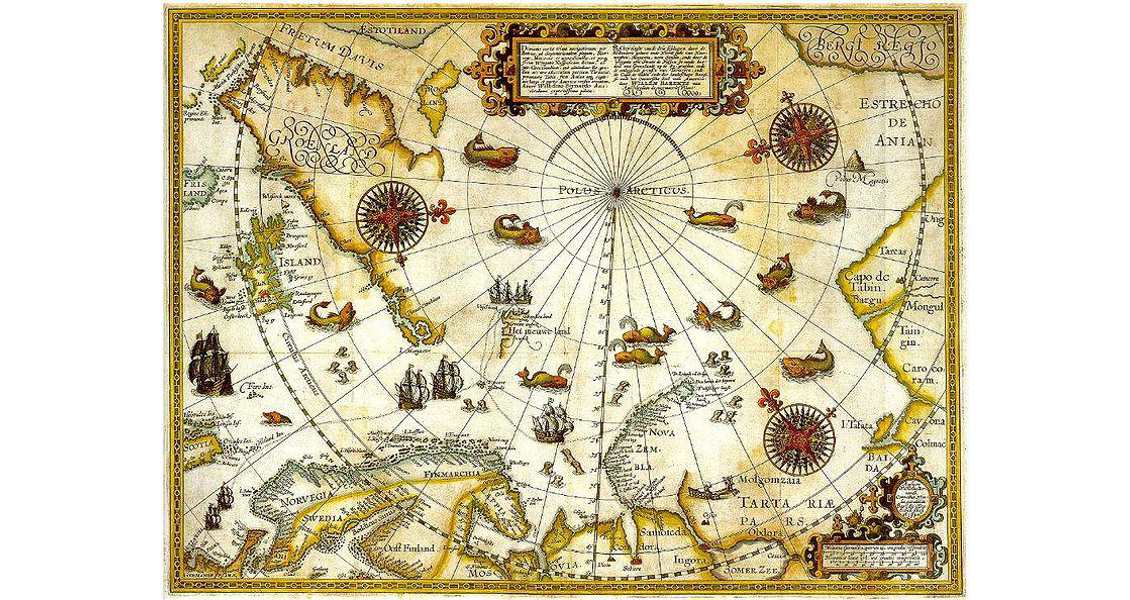
Barent’s Arctic projection from 1599.
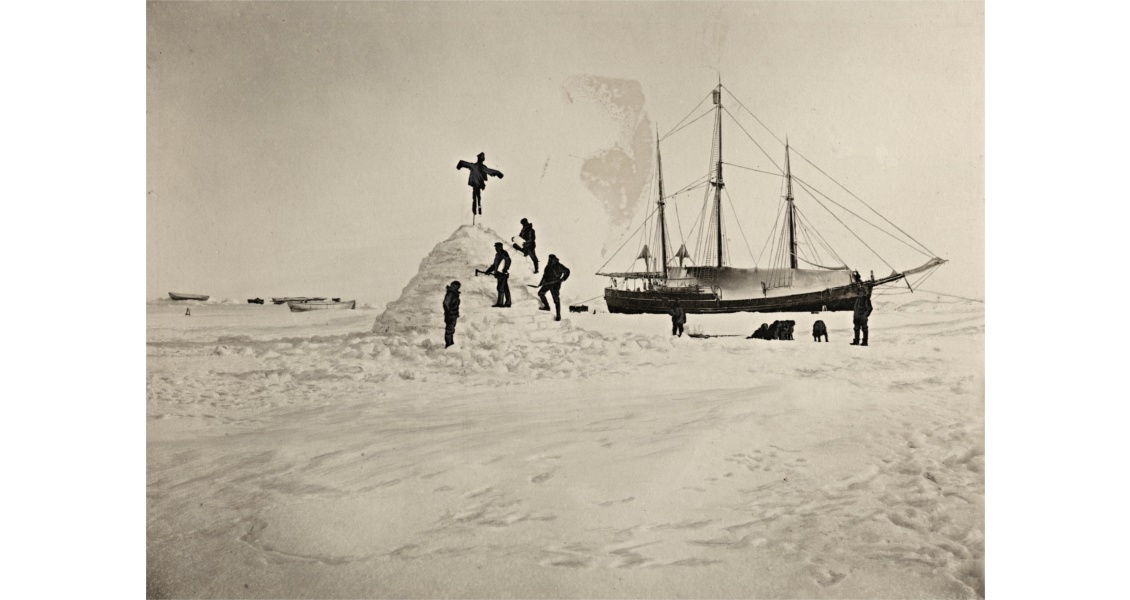
During the Norwegian North Polar Expedition 1893–1896, with the mission to drift across the north pole with the vessel Fram frozen in the ice, the first bathymetric data and sediment samples from the deep Arctic ocean were collected. the expedition also undertook geophysical measurements, including magnetic and gravimetric data.
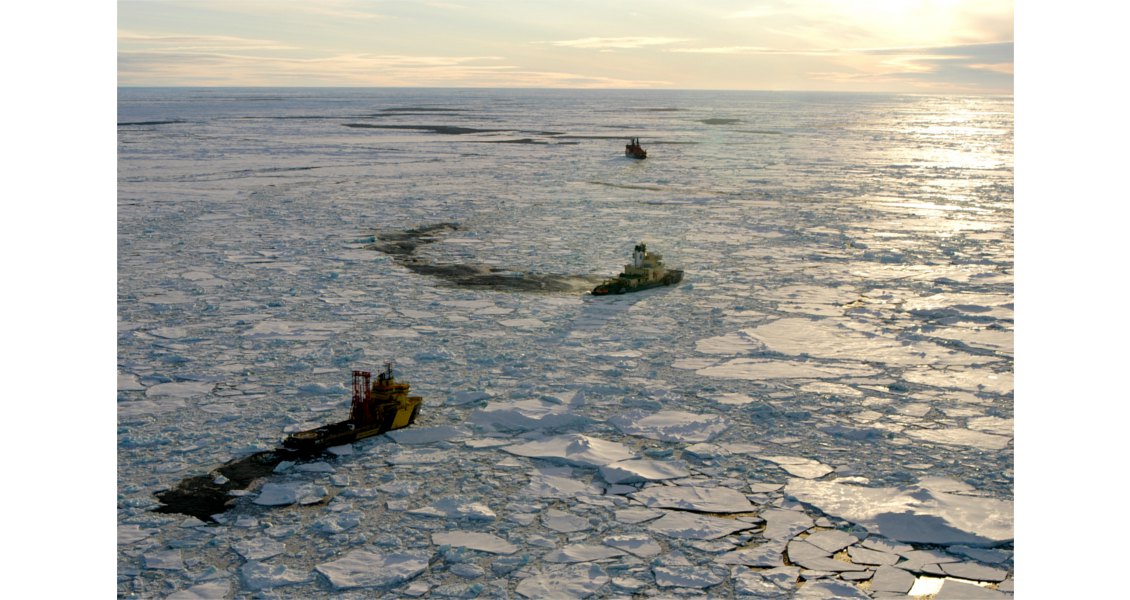
In 1899 the first icebreaker, Yermak, entered the Arctic Seas and reached Spitsbergen. Some years later the Yermak also made a pioneering voyage through the North-East Passage. Since then the Arctic ocean has been investigated by American submarines, Russian ice-drift Research Stations and icebreakers and ice-classed research vessels from various nations. A milestone was reached on 3 August 1958, when the American naval submarine USS Nautilus was the first ship to reach the geographical North Pole. also noteworthy are the Russian and Soviet ice-drift stations, which were first established in 1937 and are still in operation, having covered almost 100,000 km of the Arctic Ocean, and contributed greatly to our present knowledge of the physical geography of the Arctic, including the discovery of the Lomonosov Ridge.
The very first magnetic and gravimetric measurements in the Arctic Ocean were carried out during Fridtjof Nansens Fram-expedition 1893-96. The photo from 22nd September 1895 shows the crew building the ice-hut observatory for the magnetic measurements. (Photo: National Library of Norway).
Drilling on the Lomonosov Ridge in 2004. The Norwegian drillship Vidar Viking behind to the left, the Swedish icebreaker Oden in the middle, and the Russian icebreaker Sovetskiy Soyuz in front.
Bedrock Map of the Arctic
Despite the advances in understanding made through such projects as the IODP Arctic Coring Expedition on the Lomonosov Ridge in 2004, the geographical and geological secrets of this very large area are still not fully revealed. Further advances in our understanding of the geological history and the resource potential of the Arctic call for international cooperation. With this in mind the various nations signed an agreement to develop the Circum-Arctic Atlas in 2005.
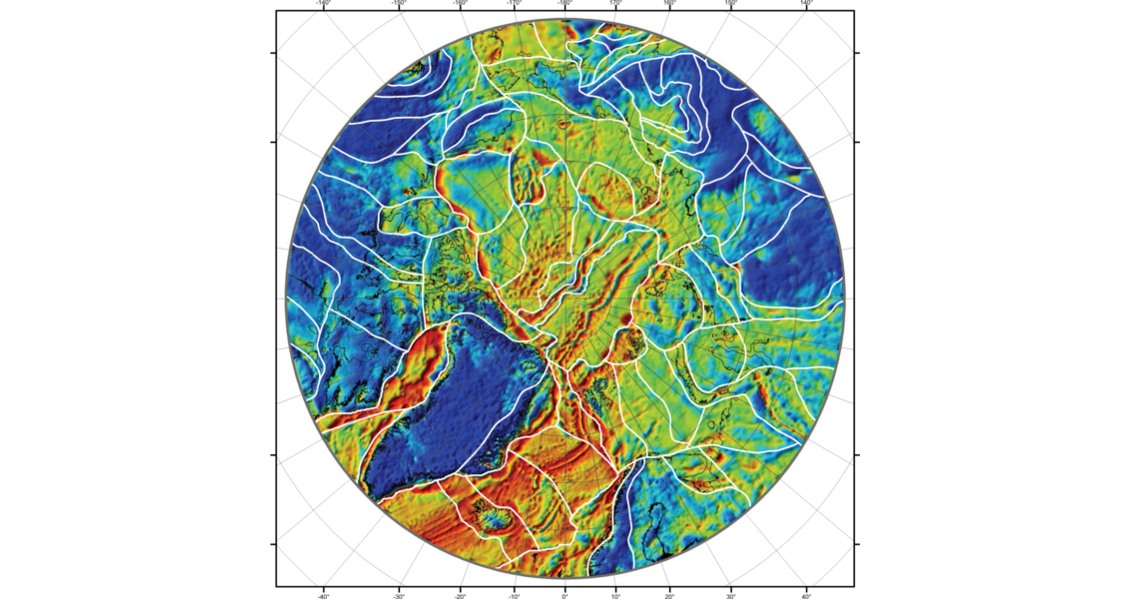
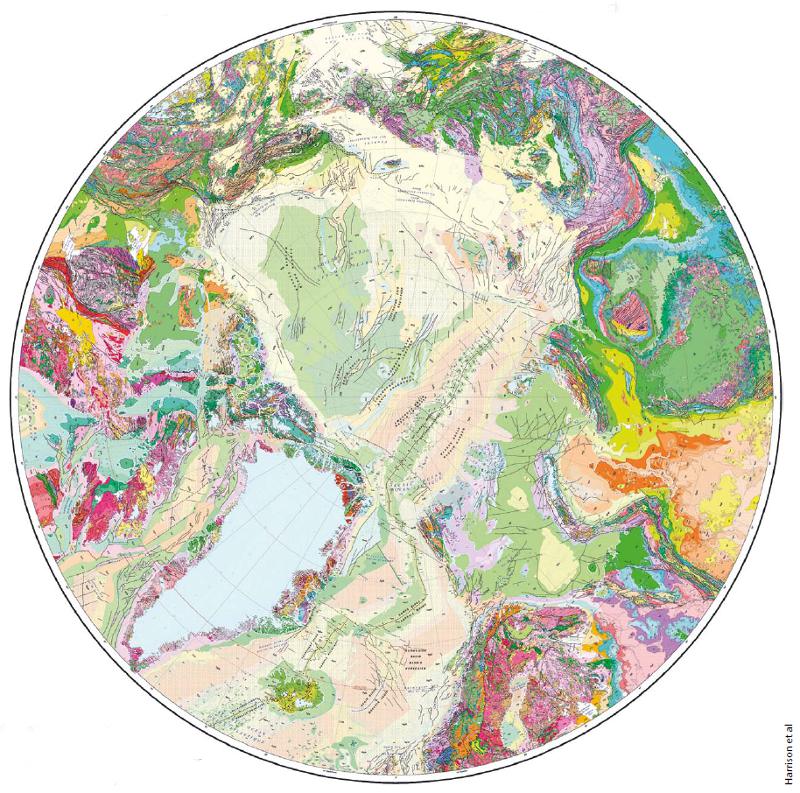 The bedrock map of the Arctic, published in 2010. It is said to be one of the most intricate maps of its kind ever produced in the 169-year history of the Geological Survey of Canada.The first result of this was a draft of the bedrock map of the Arctic, first presented at the 33rd International Geological Congress in Oslo in 2008. The work was coordinated by J.C. Harrison at the Geological Survey of Canada, and is now freely available in digital format from NRCan’s MIRAGE website. This map is said to be one of the most intricate maps of its kind ever produced in the 169-year history of the Geological Survey of Canada. putting together and unifying bedrock map data from so many different countries has been challenging and complicated. The final printed map is 1.5m in diameter and consists of five different sheets: the bedrock map at a scale of 1:5 million with explanatory notes and the list of contributors; the legend; a Precambrian correlation chart; and two Phanerozoic correlation charts.
But it is not just a printed map. The bedrock map of the Arctic is supported by the first complete, seamless, spatial database of onshore and offshore bedrock geology for the Arctic areas north of 60° latitude. There are tens of thousands of spatial objects, including 32,000 geological polygons, 1,220 map units, and 137 latest International Commission on Stratigraphy (ICS) timescale divisions.
The bedrock map and the related digital data sets are released in North Polar stereographic projection using the WGS84 datum, and include a complete geological coverage for all onshore and bedrock offshore Arctic areas. The new interpretation is based on digital geological compilations for land areas, and, for the Arctic Ocean Basin, on bathymetry, dredge samples and available seismic and potential field data. Correlation of compilation map units is based on the ICS time scale, and for pre-Ediacaran rocks will primarily use the absolute time scale. The map is now freely available in digital format from NRCan’s MIRAGE website.
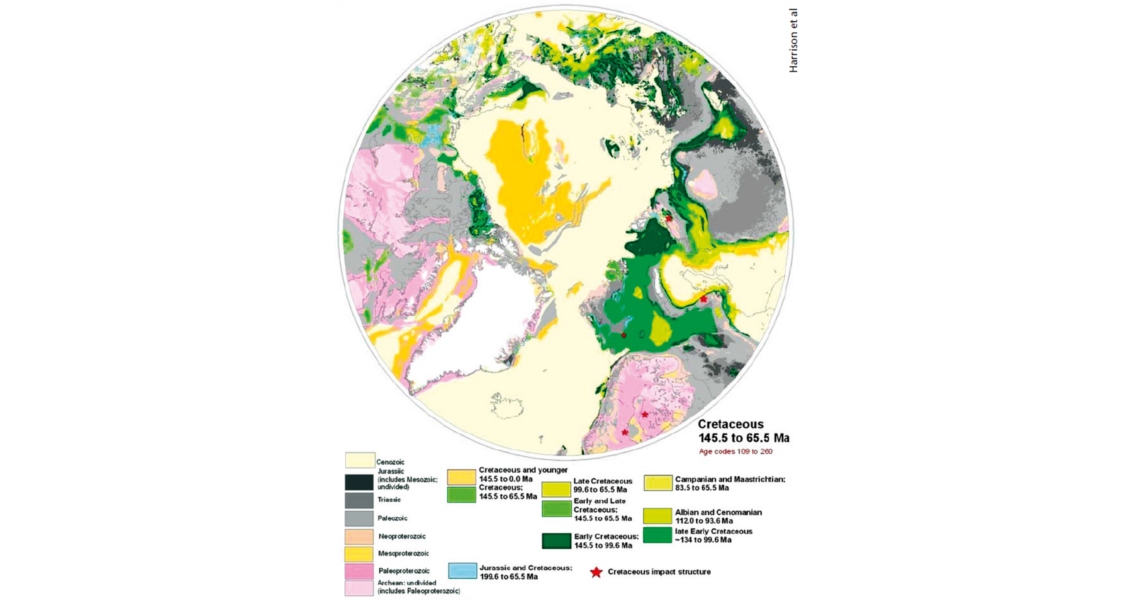
The database can be queried to call up maps based on a variety of criteria, such as this one showing all rocks of Cretaceous age. Individual geology units are coded for composition, age, environment of formation and plate tectonic domains: geological contacts, faults and oceanic spreading ridges, meteor impact structures, salt and gypsum extrusions and selected point data such as kimberlites.
Magnetic And Gravimetric Maps
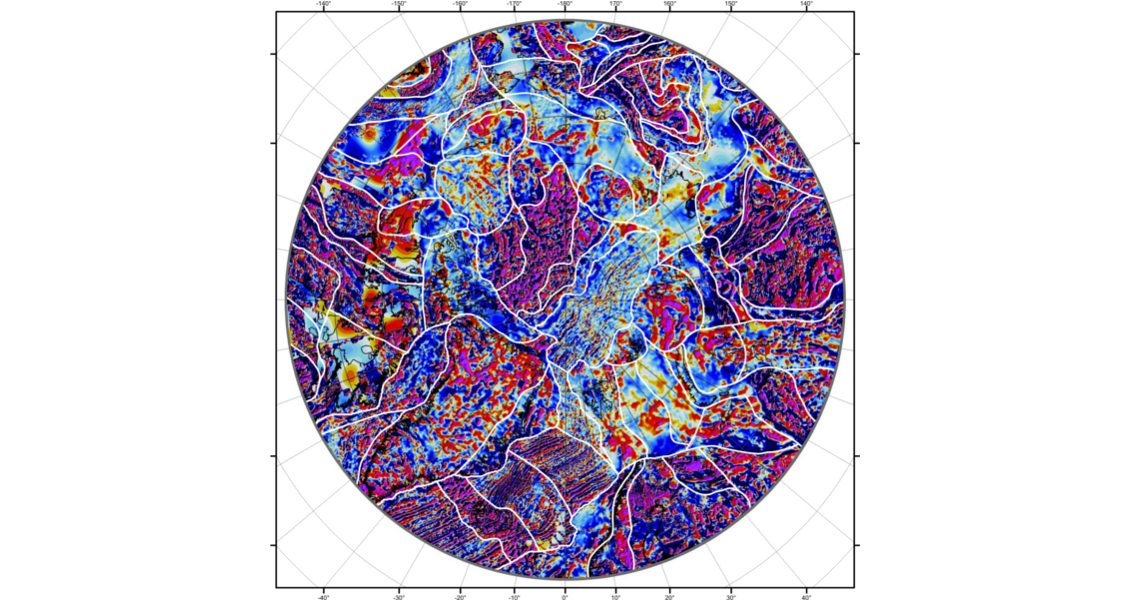
The compilation of the magnetic and gravity maps was coordinated by Carmen Gaina at the Geological Survey of Norway. New public and proprietary magnetic and gravity anomaly gridded data from each participant group were gathered and converted into a common datum (WGS84) and format. The magnetic anomaly compilation relies on 1 km gridded data for Canada, Alaska and NW Europe regions, and 5 km gridded data for Oceanic and Russian regions.
In order to construct the final Circum-Arctic magnetic anomaly grid (CAMP-M) the authors have adopted the approach used by several research groups for compiling the World Digital Magnetic Anomaly Map (WDMAM) and used near-surface magnetic data for the short wavelength component of the compilation and the satellite-derived magnetic anomalies for the long wavelengths.
The new CAMP-M compilation is superior to similar gridded data over the Circum-Arctic area due to its better coverage (it includes updated aeromagnetic data in the High Arctic, west and north of Greenland and in the NE Atlantic). It preserves smaller wavelength structures by keeping the grid resolution at 2 km, and has a consistent regional long wavelength component introduced by the MF6 satellite-based lithospheric magnetic model.
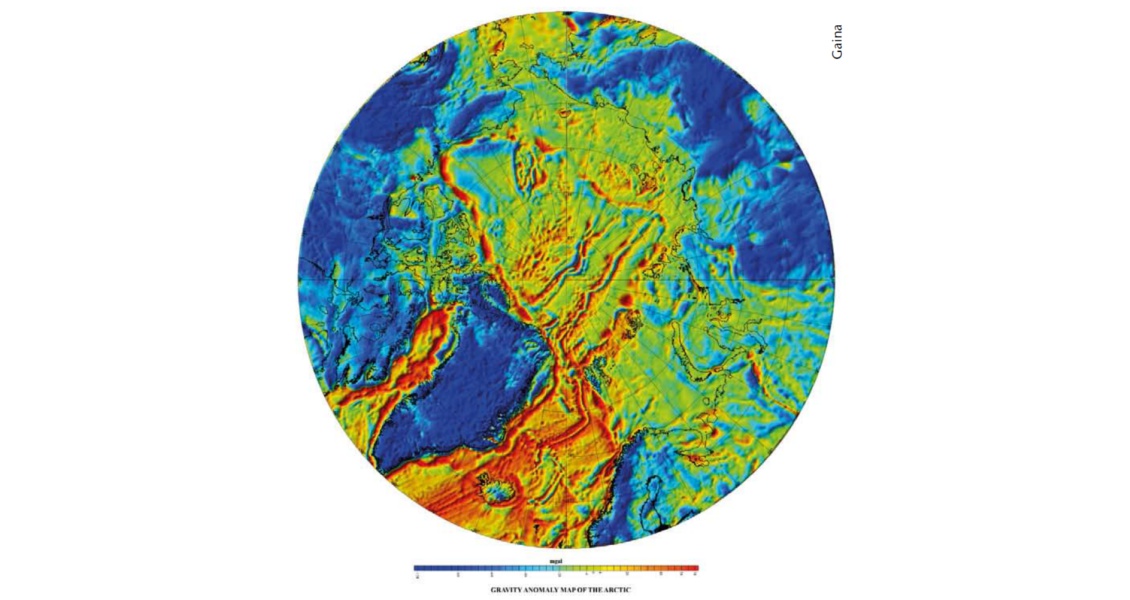
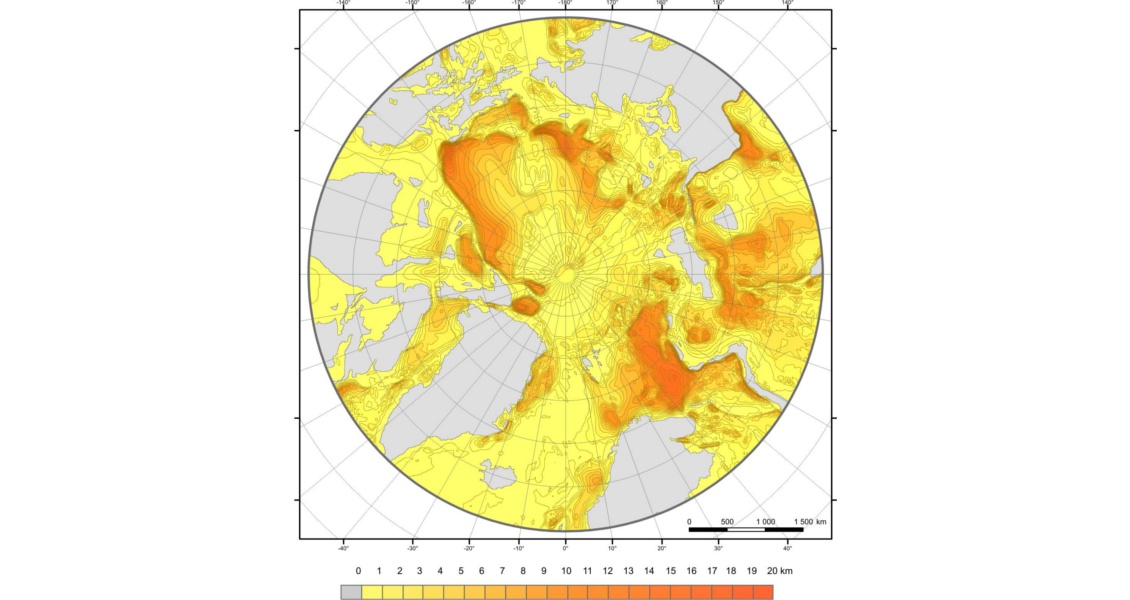
Gravity map of the Circum-Arctic, with Bouguer gravity anomaly data onshore and Free Air gravity anomaly data offshore.
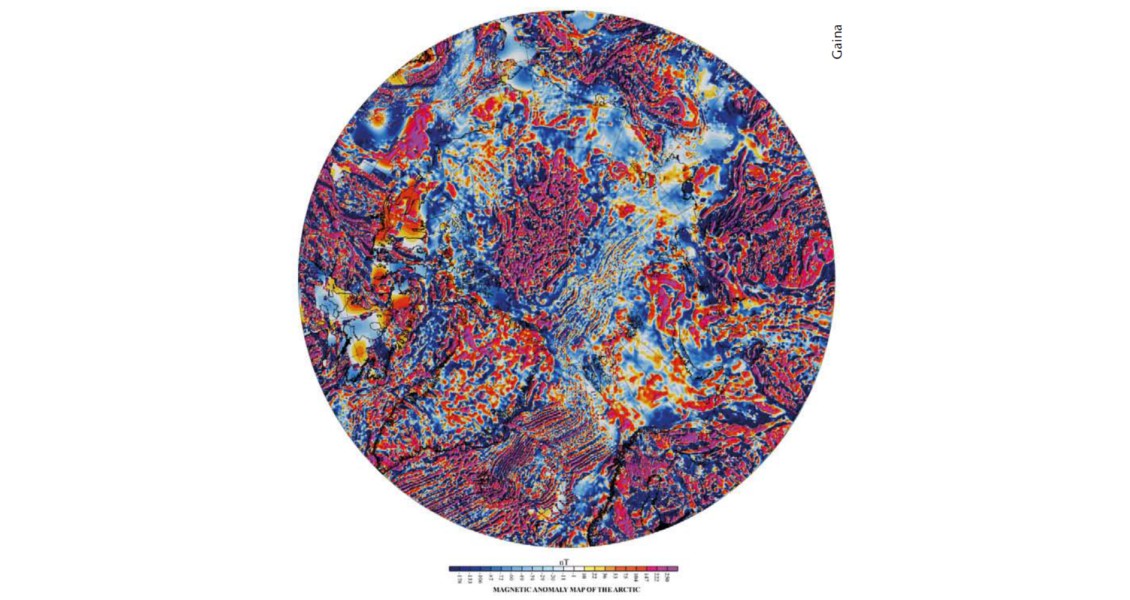
CAMPGM-M magnetic anomaly compilation of gridded data (to 60°N) based on ground/airborne regional compilations and global model of lithospheric field, based on satellite data (MF6).
The new gravity anomaly compilation was originally supposed to produce one map of the Free Air gravity anomaly for the Circum-Arctic region and one map of combined Free Air for oceanic areas and Bouguer for land, both at 10×10 km grid resolution. However, a new ArcGp free air gravity anomaly grid was completed and published by Kenyon et al. (2008), and they used the new free air data on the Siberian Shelf primarily available to the CAMP-GM project. Therefore the authors have restricted the new compilation to the combined Free Air/Bouguer corrected data set to cover the Circum-Arctic region to 60 degrees north and used satellite gravity models (EIGEN 115 GL04C) for quality control of the long wavelengths.
The new gravity and magnetic anomaly maps and their derivatives have been used to refine the outlines of some of the present-day tectonic features in the High Arctic. They allow a more accurate delineation of the boundaries between different continental blocks, micro-continents and active and extinct plate boundaries in the oceanic High Arctic. By using the new bedrock map and derivatives of the two gridded geophysical data sets and edge enhancement techniques, the authors have been able to reveal interesting features that should be taken into account when refining the interpretation of the High Arctic, in particular, the transition from continent to oceanic regions and outlines of micro-continents and volcanic provinces.
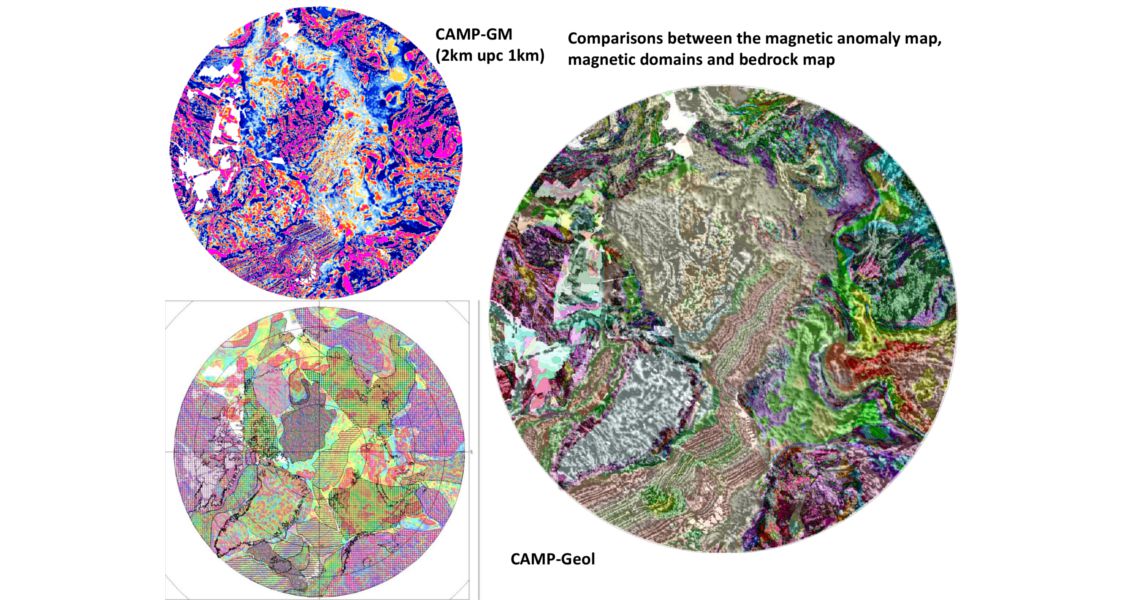
Comparisons between the magnetic anomaly map, magnetic domains and bedrock map.
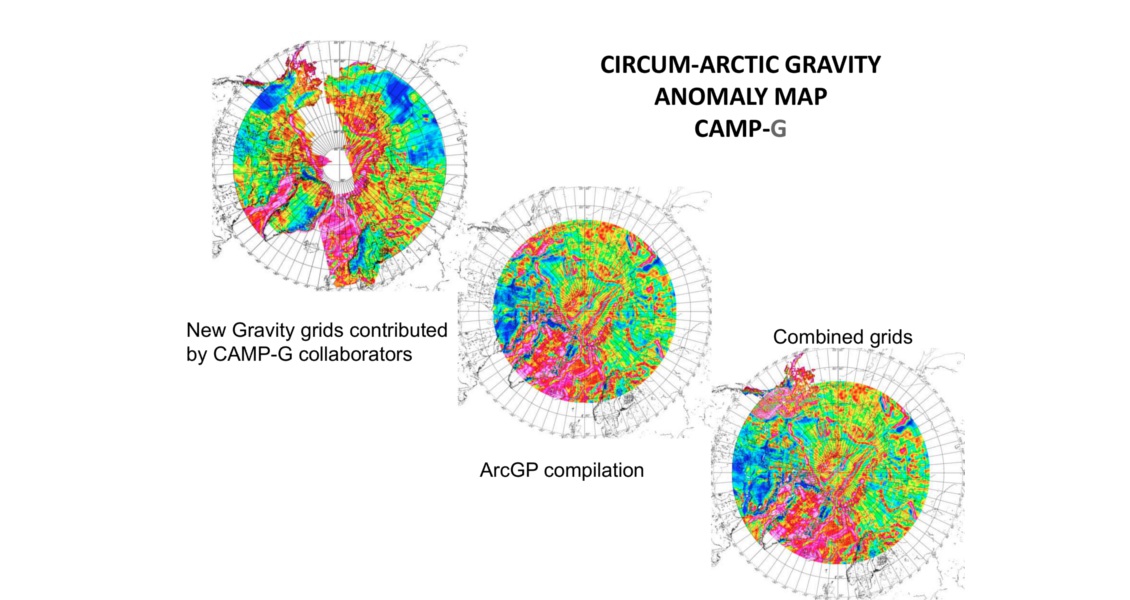
Circum-Arctic gravity anomaly map CAMP-G.
Tectonic and Ore Deposits Maps
In 2010 an international working group was formed in order to compile the tectonic map (TeMar), led by Dr. Oleg Petrov, Director of VSEGEI, Vice-president of CGMW, and Sergey Shokalsky, Secretary General of Sub-commission for Northern Eurasia under the supervision of the Commission for Geological Maps of the World. In April 2011 (Paris, CGMW) the map legend was agreed, and in April 2012 this first draft of TeMar was discussed at a workshop at the Geological Survey of Austria in Vienna. A preliminary version of the map was first presented at the 34th Session of the International Geological Congress that took take place in Brisbane in 2012.
The new tectonic map presents our current model of the geological history of the Circum-Arctic. The revised version which will be published at the 35th Session of the International Geological Congress in Cape Town this summer (2016) includes new data and will represent our present understanding on the geological structure and tectonic history of the geologically complex and vast Arctic territories. As new geological and geophysical data are acquired from the Arctic frontiers, new and refined versions of the tectonic map will appear.
The Arctic area contains large amounts of mineral resources, which are likely to be explored and mined in the years to come. Information on these is available in the archives and databases of the geological surveys and other national agencies. The next step in the cooperation initiated twelve years ago is therefore to jointly develop a common database and a map of Circum-Arctic mineral resources. This will be focused on metallic ore deposits and diamonds.
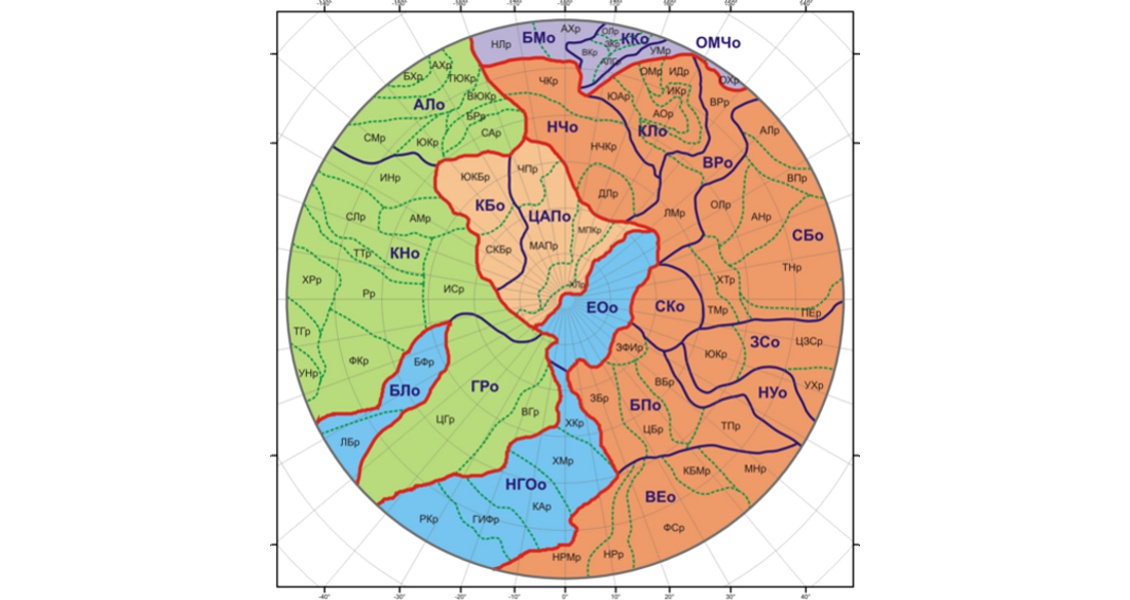
Schematic zoning of the potential fields.
Schematic zoning of the gravity field.
Schematic zoning of the magnetic field anomaly.
This initiative is be coordinated by the Geological Survey of Norway and led by Ron Boyd, and the first workshop was held in Toronto in March (2012). It is suggested that the current Fennoscandian Ore Deposits Database will be used as a model for this work. The Circum-Arctic Mineral Resource Database and map, with 2 accompanying books, will be ready by the 35th IGC in Cape Town.
Interest in the Arctic will continue to increase in the years ahead of us, and a knowledge- and research-based approach is needed. Cooperation on the production of modern and accurate geological and geophysical data and maps is a necessary step towards a common understanding of the potential and limitation of the natural resources of the Arctic regions.