Magnetics and Fractures in Coal and Shale
Magnetic surveys can provide an economic alternative to seismic in the search for coal seam and shale gas, and do not impinge on the environment
Coal seam and shale gas exploitation has presented vast new opportunities, but has also brought with it some new and unusual challenges, not all of them technical in nature. Accurate characterization of the geological properties of the coal units or shale beds is a pre-requisite for efficient and cost-effective fracking. Whereas 3D seismic surveys are the most common method of extending knowledge found from drilling samples, there are many times where such acquisition is not realistic. In addition to the high cost, issues of access, either because of environmental concerns, existing well developed agriculture, or simple political opposition, may make seismic unappealing. Magnetic surveys are able to provide a viable alternative, providing a much more economical survey, and one which does not impinge upon environmental issues over the surveyed area.
Horizon Mapping
The methods used to analyze magnetic data are twofold. The first analysis, in frequency space, allows determination of depths of geological horizons. The second is a spatial analysis that identifies individual causative bodies, and through this allows interpretation of the geological structure.
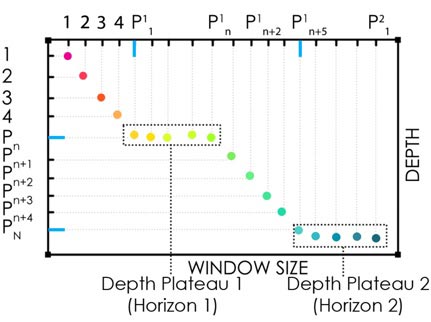
Energy Spectral Analysis (ESA) is a method used in mapping geological horizons from gridded magnetic data, and is equally applicable to gravity data. The technique relies upon magnetic susceptibility or density variations between geological horizons. The application of ESA involves using a moving window (ESA-MW) and a Multi-Window Technique (ESA-MWT) to detect and map horizons such as basement, shales, coals, carbonates, salt and basalts. ESA applied to magnetic or gravity data allows calculation of an average depth to ensembles of causative bodies. Plotting the logarithm of the radially averaged energy spectrum versus the radial frequency from potential field data shows the decay of the spectrum function, and depths are calculated from the slope of linear segments of the function. These depths are not dependent on assumed or measured susceptibilities or densities. The areal extent of the window analyzed limits the maximum depth being investigated, thus there is an optimal window size that detects a given horizon. To determine an optimal window size, the window size is incremented slightly, spectra are computed and depths interpreted. Around the optimal window size, the depths determined from increasing window sizes are stable, forming depth-plateaus. Depth-plateaus correspond to the geological interfaces where significant magnetic susceptibility or density contrasts exist. Analysis may find two or more plateaus at the same location, implying multiple geological interfaces.
Lateral correlation of depth plateaus is used to build horizons. This unique approach to interpretation of magnetic data distinguishes the new methods from conventional modeling techniques.
Fracture Detection
 ESA is used to detect horizons by identifying the plateau effect: when the window is large enough to detect bodies at the depth they lie, the detected depth stabilizes and a plateau of depths becomes evident.Automatic curve matching (ACM) is applied to the magnetic data. By identifying a magnetic anomaly on a profile, comparing the functions derived from the observed anomaly with a theoretical model, and varying the model’s parameters, the depth, geometry, and magnetic susceptibility can be computed.
Fault interpretation is undertaken by interpreting the output of ACM processing to find linear features and offsets. Identification of faults is aided by several factors, including changes in magnetic susceptibility along a fault plane, and contrasts in magnetic susceptibility between adjacent rocks. These make identification of both non-mineralized and mineralized faults possible. ACM lineaments detected at different depths can be correlated, and thus fault faces delineated in 3D. This approach to the interpretation of high resolution aeromagnetic data allows the detection of faults, associated structures, fracture patterns within different sedimentary formations, as well as underlying basement. These techniques deliver a detailed interpretation to aid in further exploration and development.
Red Hill Case Study
Archimedes recently completed a study in the Red Hill region of Moranbah, in the Northern Bowen Basin, Australia. The targeted units were the Fort Cooper and Moranbah, coal measures from the Blackwater Group of Late Permian age. The techniques successfully mapped the top of the Fair Hill Formation and the base of the Goonyella Middle Seam, which is a regional primary target within the Moranbah Coal Measures. These Permian coals were deposited under dominantly fluvial flood plain environments.
Tectonic activity during the Early Permian included extension, subsidence and transgression in a marine environment. Between the Early to Mid-Permian, the tectonic stress field shifted from extensional to compressional. This change in stress field was also accompanied by regression in sea level, leading to lacustrine and fluvial environments of deposition. The Blackwater coal measures formed during this period. During the Late Permian to Early Triassic, increased compression created thrust faults and caused uplift and erosion, ending sedimentation in the area.
Mapped magnetic field over the Red Hill survey area.
Magnetic Minerals
The magnetic response of sediments depends on the amount of magnetic minerals present at their formation, as well as the amount that has formed over geological time since then. There are a number of iron-rich clays that are very common in sedimentary environments such as the swamps that are typically the source of coal beds. These clays are initially usually only very weakly magnetic. Other sources of iron include eroded haematite and siderite which are transported to swampy environments from their source.
As the subsurface oxygen is depleted, geochemical conditions become more favorable for the formation of magnetic minerals. This process can occur where sulfur has been released into the anaerobic groundwater by decomposition of the plant material, where it comes into contact with the iron-rich clays or other iron sources. Insoluble iron sulfides can form around the contacts between coal beds and claystone/mudstone layers. Some of these iron sulfides will be magnetic. Magnetite can form in these environments when some of the iron atoms in weakly magnetic haematite lose an electron to more reactive ions, changing the crystal structure and increasing the overall magnetic moment.
In addition, a variety of anaerobic bacteria that live in these environments derive food by using sulfur or iron from minerals to break down hydrocarbons, making these elements available. Some microbes simply deplete the oxygen from the groundwater, aiding the creation of a reducing environment.
Faults and fractures are saturated with groundwater, which transports dissolved iron or sulfur to locations where the geochemical conditions change to a reducing environment, thus leading to the precipitation of insoluble iron sulfides and, sometimes, magnetite. The compressional and extensional forces applied to coal or shale beds and adjacent formations determine which faults and fractures are open to the migration of groundwater and this, in turn, will determine where the geochemical conditions are favorable for the formation of magnetic minerals.
By establishing the dominant direction of linear magnetic features in and around the coal or shale beds, it is therefore possible to determine the direction of the main compressional and extensional forces acting in an area.
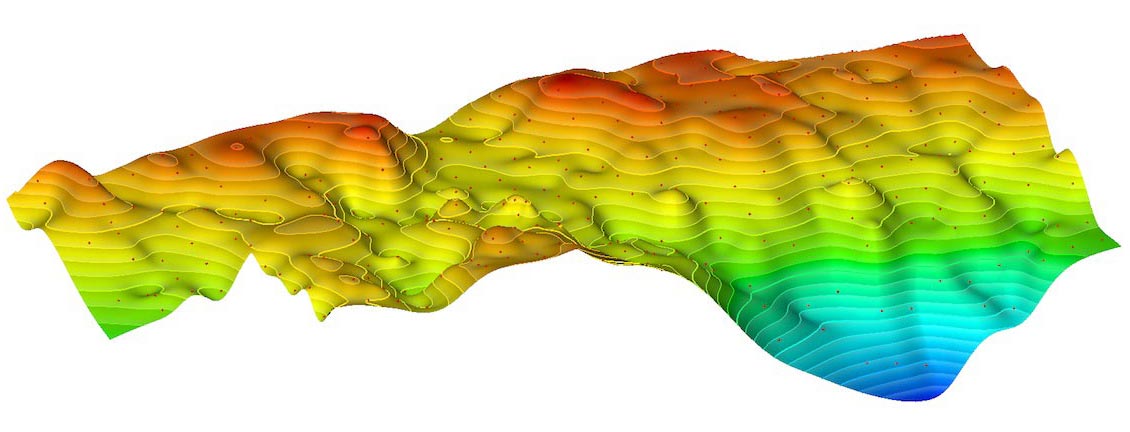
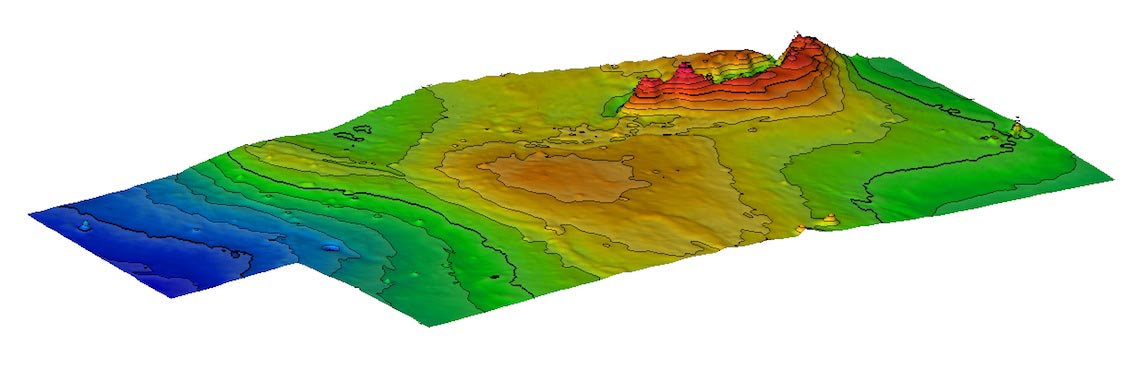
Images of the top and bottom of the targeted coal horizon at Red Hill.

Images of the top and bottom of the targeted coal horizon at Red Hill.
Red Hill Horizons and Fractures
Horizon mapping was undertaken to produce a surface of the Top and the Base of the targeted coal measure. The surfaces were mapped using the methods described above for ESA-MWT and ESA-MW. The technique relies on magnetic (and density) contrasts to map laterally continuous horizons. For this reason the Fair Hill Formation and the Moranbah Middle Seam, both of which have highly magnetic tuff bands from volcanics, were chosen. The two horizons were mapped over an area of 35,000m2 with the Top of Coal showing depth variations of -50 to -650m and the Base of Coal, -150 to -900m below MSL. Both horizons show a similar east-dipping trend with the highest point in the west of the study area.
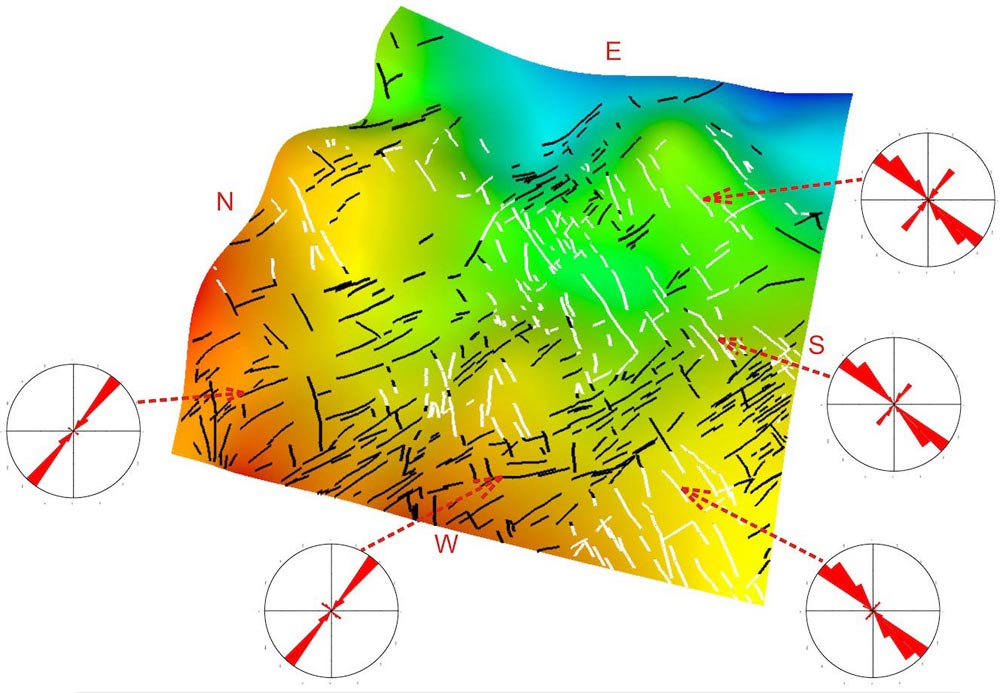 Surface showing lineaments which are used to identify stress alignments.Stress orientation was interpreted by analyzing the magnetic data using the ACM process to detect the depth to magnetic sources and their susceptibility. This analysis was used in conjunction with the results of the horizon mapping techniques (finding Top of Coal and Base of Coal). Using the Top of Coal surface, a band of magnetic sources between 10m above the coal to 100m below the coal surface was analyzed. In some cases, lineaments were determined by assessing the alignment of solutions, such as mineralized faults, while other lineaments were defined from the offset of magnetic markers. Swarms of short extended magnetic features correspond to fracture patterns within the coal measures interpreted. The trends were then grouped into dominant orientations for easier analysis. These are displayed along with their rosette diagrams in the figure below.
Range of Applications
Archimedes’ unique technologies, expertise and experience are vital tools for exploration and production when looking for a wide range of hydrocarbons. The techniques used in the Red Hill Case Study are equally applicable in other coal seam and shale gas regions. Knowing the fracture pattern or stress field orientation within the target area is of critical importance for exploration and production. The use of the Archimedes techniques makes exploration more economical, particularly in areas where seismic acquisition is not possible.
For further information about these techniques, see GEO ExPro app for iPad, Edition 4