While aspects of the geological evolution may still be complex, the distribution of phase (oil vs gas) is not and can be accounted for by the expected physical behaviour of petroleum in the subsurface. We discuss maturity, phase and the ‘critical moment’ in more detail in this article.
A top-down and bottoms-up approach to petroleum systems analysis is considered to illuminate some important concepts. The top-down approach relates to the interpretation of fluids and their distribution in the geological and pressure-temperature contexts to constrain the petroleum system and to infer the location and properties of yet-to-find hydrocarbons (He and Murray, 2019). Whereas bottoms-up methods typically utilise empirical, physical, and chemical models of the processes that occur in sedimentary basins to predict timing of generation, migration and the trapping of petroleum in the subsurface.
The earliest publications on the petroleum systems and basin modelling in the West of Shetland concluded that oil generation from the Upper Jurassic occurred in the mid-Cretaceous due to rapid Cretaceous basin subsidence (Holmes et al., 1999). This timing precedes the deposition of the proven Palaeocene and Early Eocene reservoirs and seals and thus the area has been considered complex. Critical aspects of the geology that are important to consider when modelling the petroleum system include the impact of pressure and ‘moteling’ (i.e., the retention of petroleum at depth), age and composition of the basement, influence of Tertiary volcanism/intrusion, Late Tertiary uplift and the influence of migration lag effects. Additionally, some published assertions reflect a fundamental misunderstanding of source rocks and what they expel through time, which has led to incorrect perceptions of the petroleum system. While aspects of the geological evolution may still be complex, the distribution of phase (oil vs gas) is not and can be accounted for by the expected physical behaviour of petroleum in the subsurface.
Basin Modelling and Phase Risk
While we expect that basin models have been relatively successful in temperature and pressure prediction, their success in preventing dry holes and in phase-prediction is modest at best. He and Murray (2019) have discussed this challenge and conclude that the models used do not replicate nature, so this should not be surprising. At the basin scale, systems tend to fall into either gas-prone or oil-prone and this overwhelmingly relates to the nature of the source rock. In basins with discoveries, a ‘system’ gas–oil ratio (GOR) can be estimated. For the West of Shetland, if we estimate ~10 Billion bbls of oil in place in the proven oil discoveries and similarly ~18 Tcf GIIP in the associated gas and in the known gas fields, then the system GOR would equal 1,800 scf/bbl, which is consistent with a Class B marine, oil-prone source rock (Pepper and Corvi, 1995).
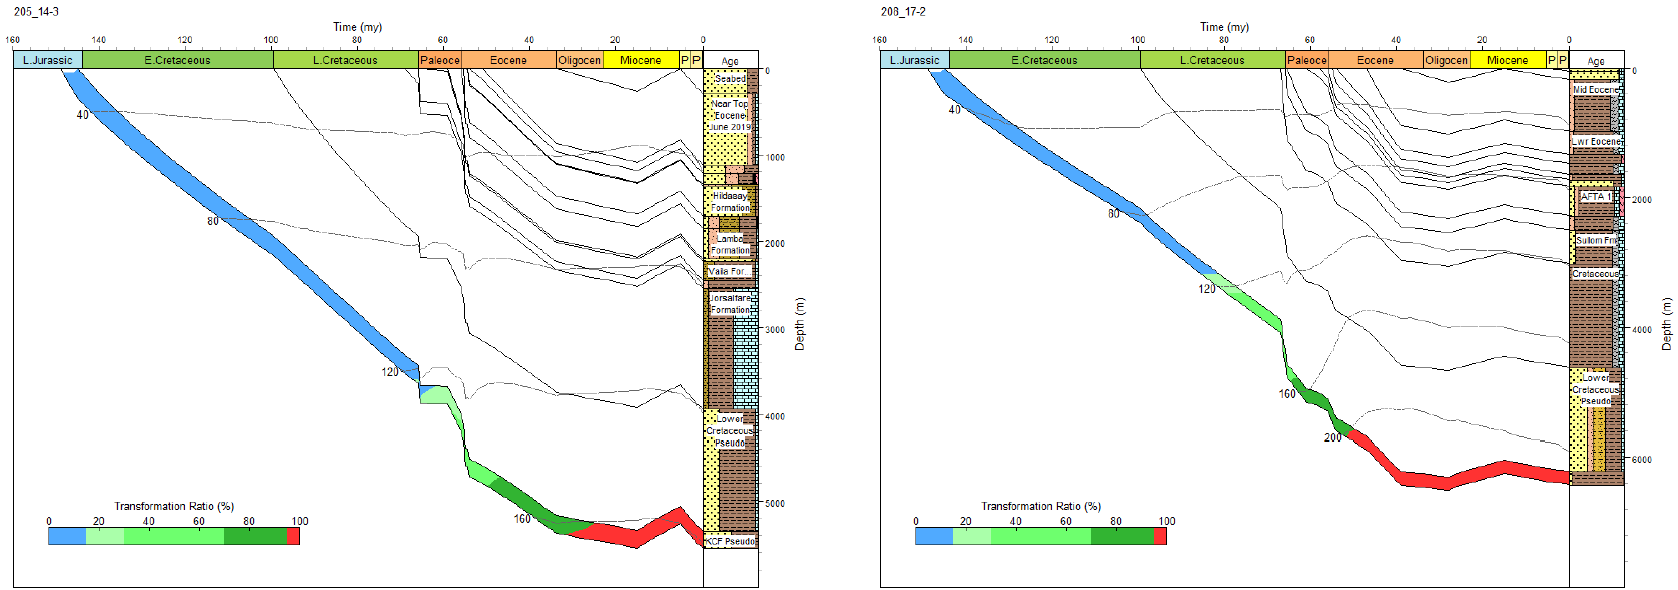
A common misunderstanding is that gas-mature equates to dry gas or a gas risk. 1D models (Figure 1) or basin model derived maps will often be made in a basin model with some parameter (% vitrinite reflectivity (Ro), standard thermal stress, transformation ratio etc.) and then inferences about the predicted phase made based on the map, and these maps may even be used to describe a ‘phase risk’. Explorers may look at basins with deeply buried source rocks and erroneously pronounce them ‘gas-mature’.
Does high maturity really relate to ‘high maturity’ gas? The answer is no. In Figure 2 the model shows that in an oil-prone source rock that has efficient expulsion, ~80% of the mass will be converted to black oil (gas/liquid ratio <2,000 scf/bbl); even in temperatures commonly referred to as the ‘gas window’ the product will be volatile oils to rich gas-condensates with wet gases probably only being dominant at (source rock) temperatures ~190°C and above.
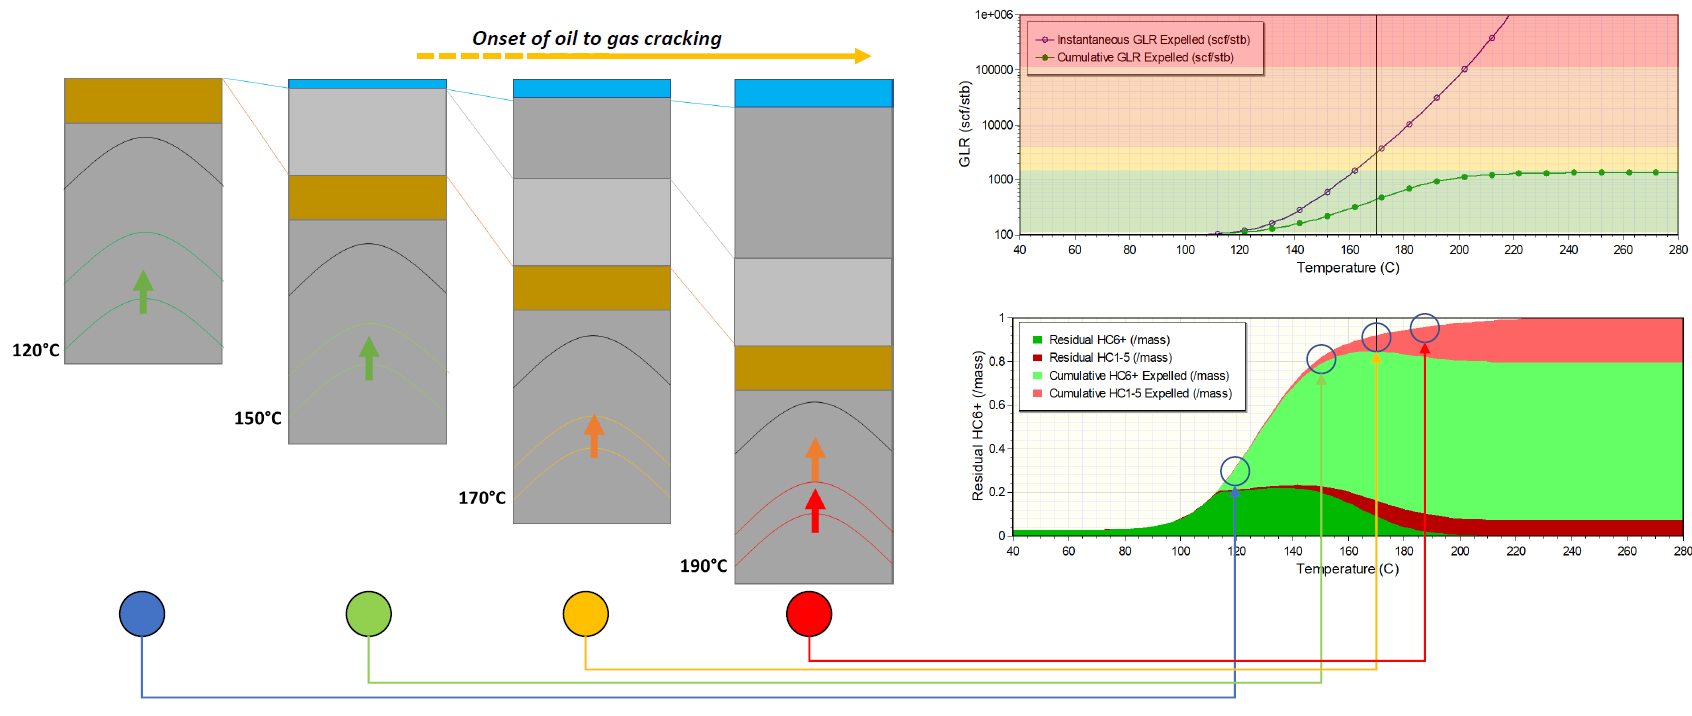
It seems likely that even after the source rock is effectively exhausted, significant secondary migration will occur. Where oil is retained at depth, either in inter-bedded units in the source rock or in traps too deep to drill, oil will eventually crack to condensate and wet gas which may continue to contribute to the volume available for migration (due to volume expansion) (Figure 3).
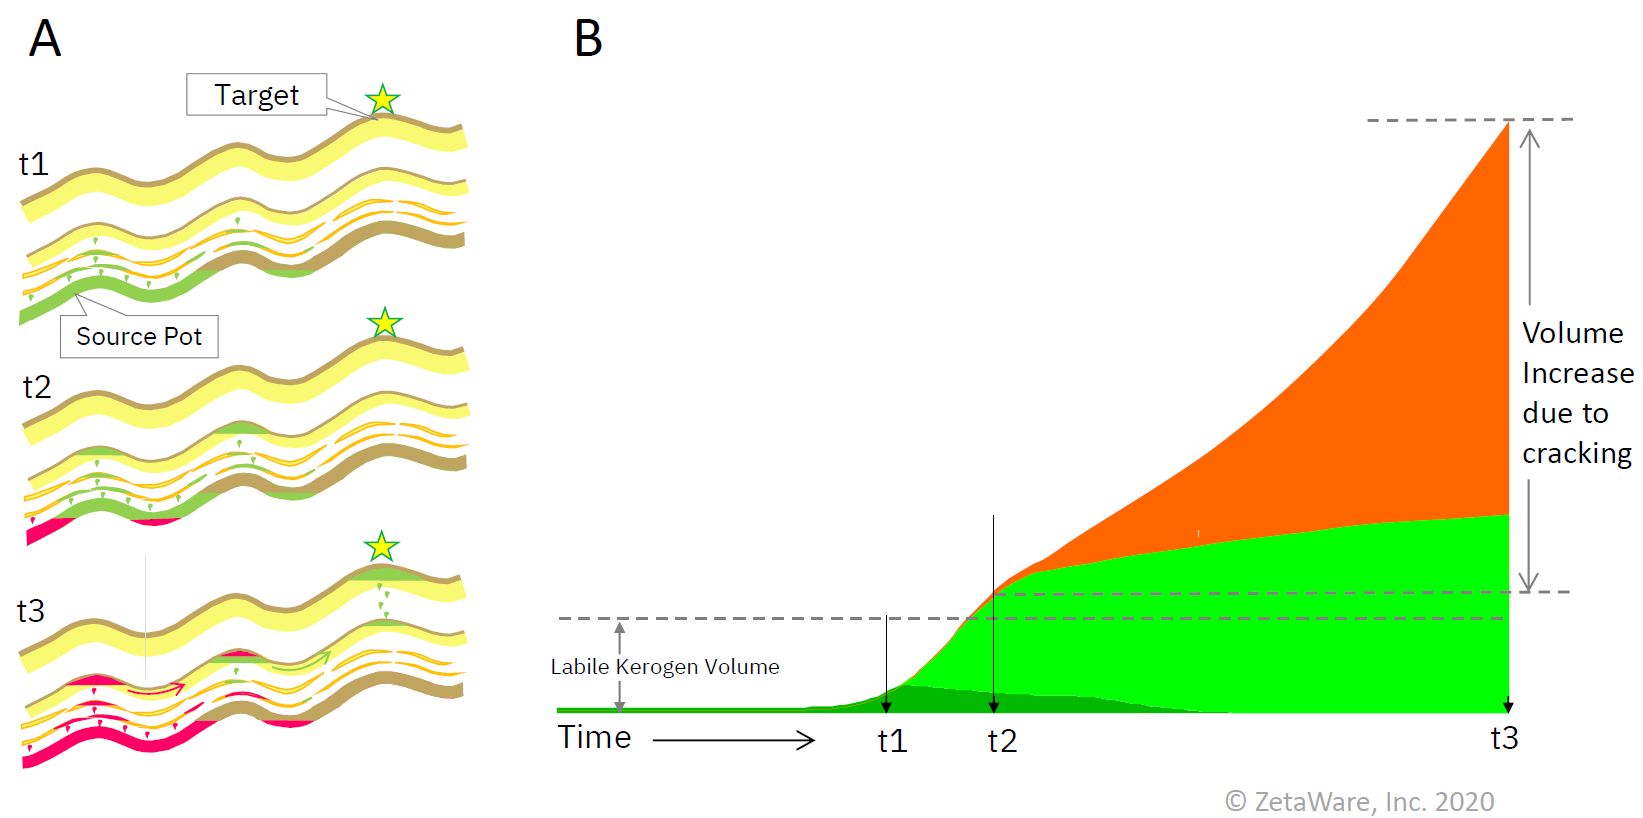
In this sense, deep basins, with an oil-prone source rock are most favourable from an exploration point of view since they will have the greatest mass of petroleum available for migration (Gulf of Mexico, Central North Sea). ‘Moteling’ is commonly dismissed by explorers as a form of special pleading. Logically, however, if you are exploring for traps within a basin, it seems illogical to dismiss the occurrence of traps at depths beyond those in which we typically explore.
Top-Down Assessment
The West of Shetland has been thought of as enigmatic since the published basin models predicted that the source rock was in the oil window near the end of Cretaceous, and post-mature today – even if using correctly parameterised basement (cf. APT and Chemostrat, 2020; Gardiner et al., 2018). Yet the basin contains mainly oil fields and is certainly more oil- than gas-prone in mass terms. A rough estimate of the system GOR is less than 2,000 scf/bbl, consistent with the Pepper and Corvi (1995) Class B organo-facies and yet areas have found gas, so how to make sense of the basin? Do the models and observed fluids agree?
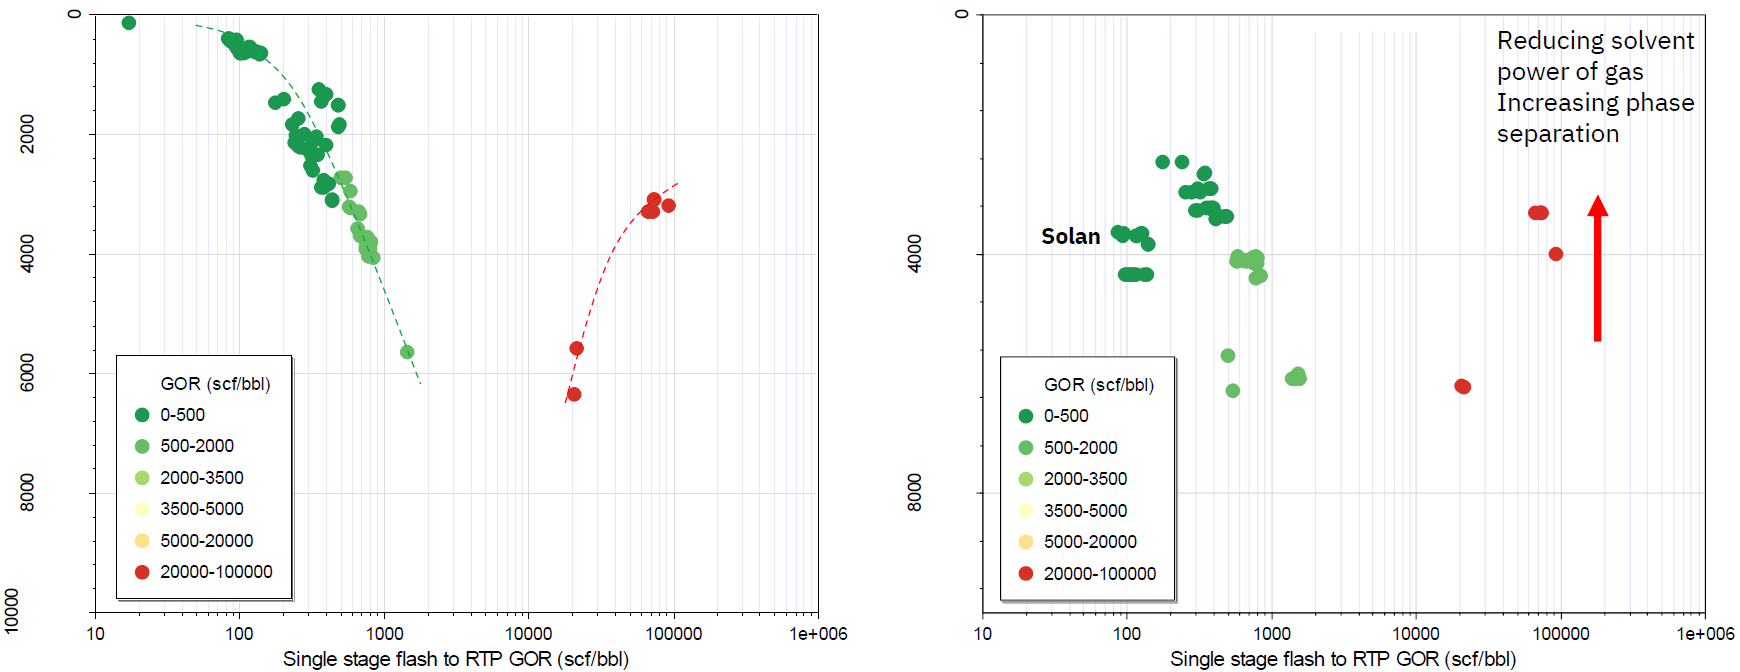
In a system with oil-prone source rocks, the bulk of the product will be oil and hence most of the accumulations should be oil, regardless of maturity or timing. The GOR and API gravity of the oils should increase with depth for various reasons, such as migration lag effects, gravity fractionation, and bubble point controls. Simply plotting this data can bring significant insight to the petroleum system. The gas–oil ratio versus saturation pressure is plotted in Figure 4A, and reservoir pressure in Figure 4B for most of the fields from the West of Shetland; this shows most of the fields are black oils close to their saturation pressures.
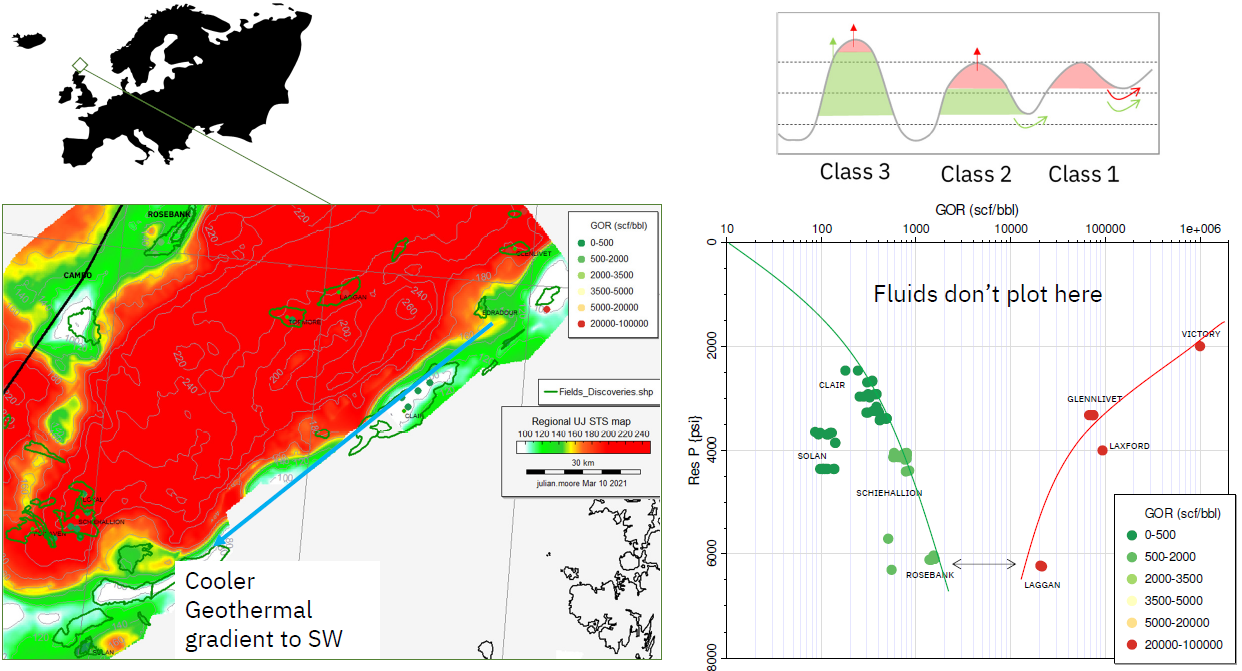
A maturity map for the Upper Jurassic is shown in Figure 5a. Inspection of the burial histories (Figure 1) might suggest that the basin migrated oil in the Late Cretaceous and would be dominated by gas present-day, but exploration results has proven otherwise. To date, much of the exploration focus has been on the shallower, post-rift plays because of the known challenges for seismic imaging (due to widespread volcanics) that have historically hampered the targeting of the deeper syn- and pre-rift plays. West of Shetland fields are generally hydrostatic with reservoir pressures close to saturation pressures and hence gas caps are likely to form. In light of this and the observations that the gas fields are small relief structures and oil fields have large closures, the distribution of oil vs gas can be explained by the Sales 1997 model of trap classes (Figure 3A). Small gas fields are a result of phase separation, rather than maturity, and the GOR for those are higher at shallow depth due to dew point control. Small traps located on a spill path will retain phase separated gas by spilling its oil leg (class 1), whereas large relief structures should contain oil (class 3), the preservation of the oil leg is a function of the seal capacity and the depth to the spill point not maturity. Thus, in the case of the Clair field, which both leaks gas and has a deep spill point, the potential exists for the oil to be preserved. The greater buoyancy of gas and leaky seals act to preserve the oil legs (Figure 5b). Most of the main oil fields West of Shetland are two-phase (e.g., Clair, Foinaven, Rosebank etc.) suggesting similar processes are occurring in each. While conceptually simple, these processes can be complex to capture in a model.
Concerns expressed around the timing of generation are perhaps moot, since valid traps tested by drilling are proven to be charged. An often-cited concept in petroleum systems studies is the ‘critical moment’, defined by Magoon and Beaumont (2003) as ‘the time that best depicts the generation–migration–accumulation of hydrocarbons in a petroleum system. A map and cross section drawn at the critical moment best show the geographic and stratigraphic extent of the system’.
In the deeper parts of the basin where the Jurassic is over 7 km deep present-day, irrespective of the thermal (or pressure) model invoked, maturation will be early relative to the deposition of reservoirs and seals. Evidence of earlier charge phases exists in fluid inclusion data e.g., Mark et al. (2005) and thus cannot be dismissed entirely. Cooler geothermal gradients are known to occur in the Quad 204 area and can be accounted for based on the basement composition (cf. APT and Chemostrat, 2021), which will act to retard the timing of generation relative to models with standard properties. Furthermore, it seems likely that there will be some degree of ‘migration lag’ induced by the geologically temporal storage of oil at depth, which either becomes available through leakage or is cracked to lighter, more mobile compounds (Figure 3). Quantitative estimates of the degree of ‘lag’ are challenging to determine with confidence; in the Gulf of Mexico, another basin dominated by oil but with a very deeply buried source rock, He (2016) estimates a migration lag of 10–20 Ma and similar values may also be appropriate for the West of Shetland.
Maturity, Phase and the Critical Moment
There are commonly held misunderstandings in the industry regarding how maturity relates to phase. This article provides a clearer framework with which to consider how phase may be distributed within a basin. For accurate phase prediction, integration across the following elements is required: charge volume and GOR, trap pressure, trap geometry and seal capacities. This has not always been adequately captured in basin models, however tools are becoming available that allow these factors to be assessed probabilistically on the principal controlling elements, allowing geoscientists to judge the expected phase in a risk-based manner. The Faroe-Shetland Basin’s current discoveries can be accounted for by some combination of: delayed expulsion due to a function of cooler models (especially in the southwest) appropriate expulsion models; migration ‘lag’ and the preservation of oil legs under leaking gas caps. Given the complexity at play in such systems, the use of the ‘critical moment’ concept does not seem very helpful and its importance is perhaps overstated.
Julian Moore, APT UK; Zhiyong He, Zetaware Inc.