The sky above, the ice floes, and the Earth below
See GEO ExPro v9i6 for full size Seismic Line
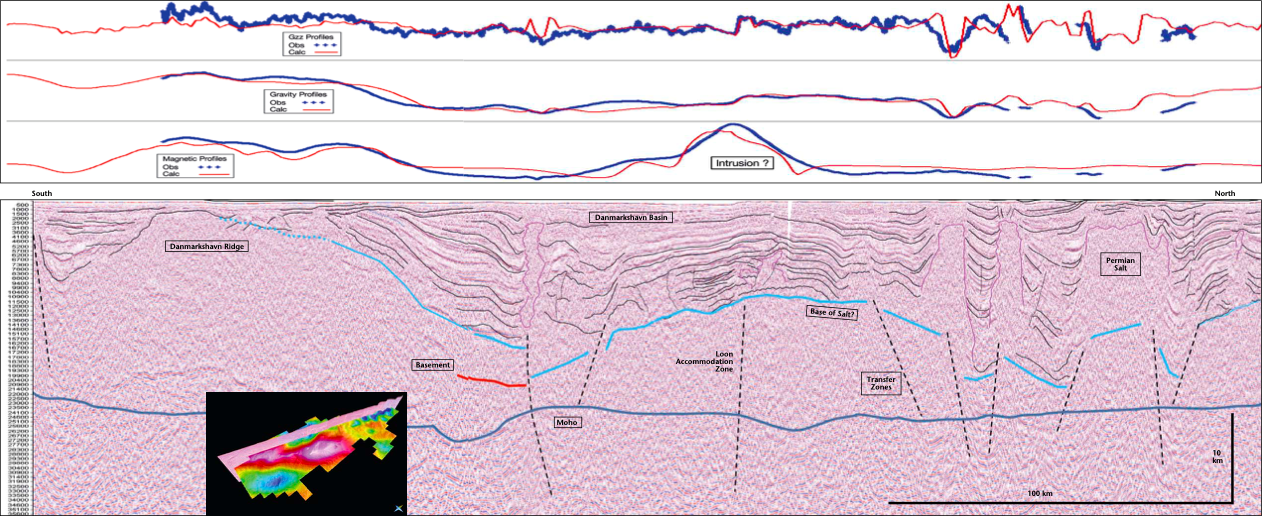
The main tectonic elements of the line shown here, Line 5150, are the Danmarkshavn Ridge to the south and the Danmarkshavn Basin to the north. This line is chosen to show (see inset diagram of Gz field and line location) how powerful the Gz and Gzz signals (vertical gravity value and first derivative component) are in terms of identifying the presence of salt. This project is at the early stages of 3D modeling, but already it is possible to incorporate salt bodies into continually evolving 3D models of the basin architecture. The following pages discuss the potential fields data in more detail, show a tectonic framework map, and discuss this line while also displaying results for a key dip line.
ARKeX, the provider of non-seismic services, has recently completed an airborne Full Tensor Gravity Gradiometry (FTG) survey offshore north-east Greenland in conjunction with ION Geophysical. The 50,000 km2 multi-client survey is the largest single offshore FTG survey ever carried out, and was successfully acquired above the harsh Arctic ice-laden waters according to plan in the summer of 2012.
The survey takes in key areas of the pre-round blocks that are on offer to the KANUMAS group and, in addition, the ordinary round blocks that will be offered in Greenland’s 2013 license rounds. The FTG data has been integrated and jointly interpreted with ION’s 2D NE GreenlandSPAN™ program to provide a better understanding of the structural development of the region. The NE GreenlandSPAN seismic survey and geological interpretation across this undrilled high Arctic continental margin have been reported on earlier in Geo ExPro (Vol.7, No. 6) and also in First Break (November 2010). The interpretation and the report of the new potential field study and its integration with previous seismic mapping, along with the data, are available to license on a non exclusive basis.
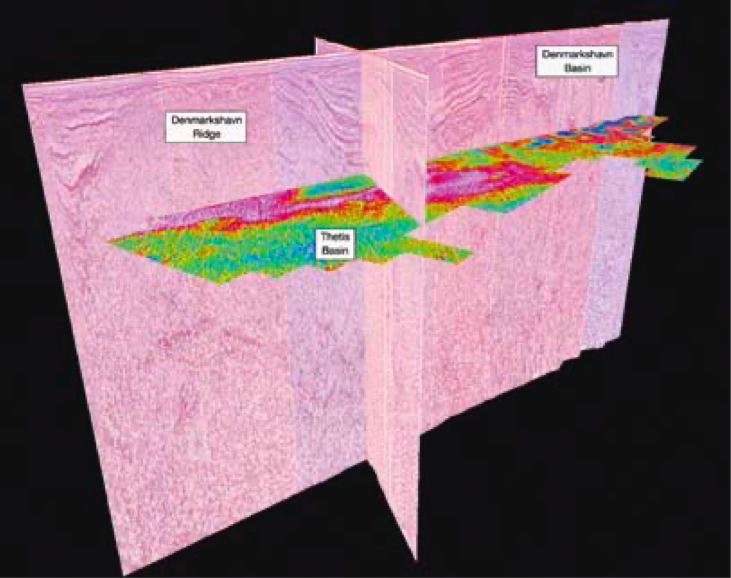
Two lines from ION’s 2D NE GreenlandSPAN program are discussed here, to highlight the benefits of multi dataset integration. The locations of the dip and strike lines are shown on the tectonic map. The lines are also shown in perspective in a gravity gradiometry (Gzz) image. Although the major discussion in this article is confined to 2D models, 3D forward modeling and inversion techniques have been applied to the seismic and FTG datasets. The visualization of all datasets in a 3D volume allows a team approach to discuss the what-ifs generated from the 2D and 3D modeling.
Interpretation of strike line
The first line, shown in the foldout, follows the Danmarkshavn Ridge northwards into the Danmarkshavn Basin, which is marked by a salt province in the north. At the southern end of the line, we see the Danmarkshavn Ridge plunging northwards, and as we progress into the Danmarkshavn Basin we see coherent seismic boundaries showing strong truncation beneath onlapping Tertiary sediments. All three profiles match nicely with the area where a steepening in dip occurs on the ‘light-blue reflector’ (base of Permo-Carboniferous, below the salt) on the northern part of the Danmarkshavn Ridge.
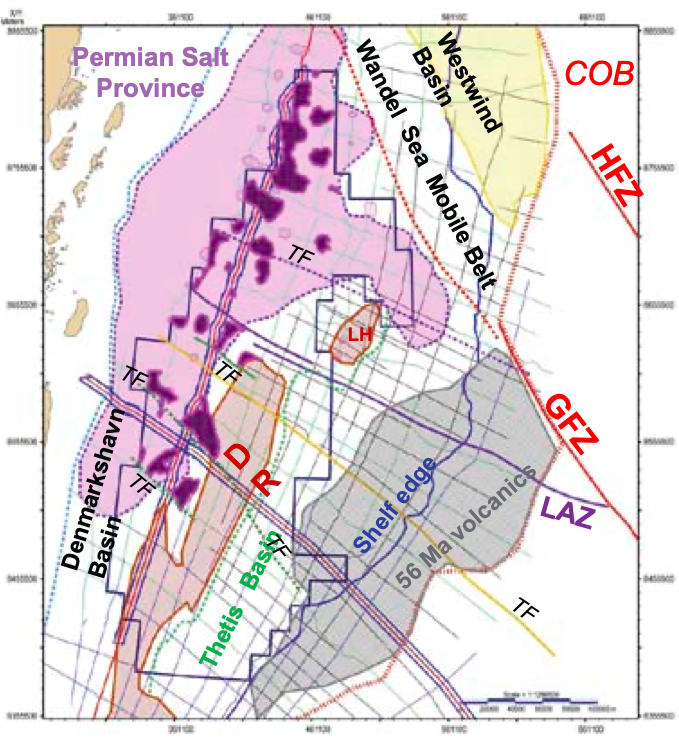
As we move into the basin, we see that a high magnetic signal occurs just over half-way along the section. Remembering that this is a strike-line, this magnetic response is observed where the Loon Accommodation Zone (LAZ) cuts the section at great depth. This is another area where work is ongoing to try to understand the signatures of all the profiles.
What is very clear on this line is the ability to define the lateral edges of the salt using the Gzz signal. Some diapirs are so large, and the salt so shallow, that the Gz profile allows interpolation away from widely spaced regional seismic control. The smaller and deeper salt bodies are much better defined on the Gzz profile and image. Before the Gzz data was available the seismic data coverage led to a map of more than 25 isolated diapiric structures, but integrating the seismic with Gzz data (underpinned by 2D detailed modeling) has led to the discovery of a greatly expanded distribution and area of intrusive salt bodies and the definition of significant salt wall features.
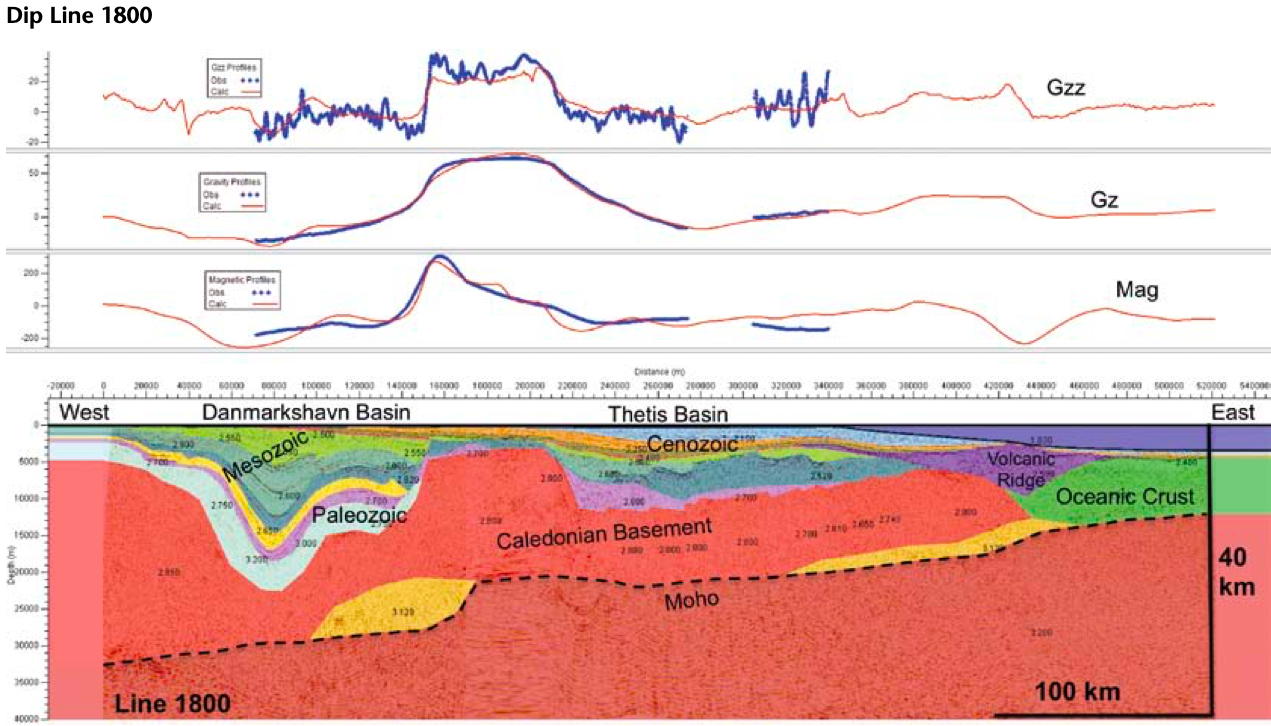
Interpretation of dip line
The second line is a dip line that traverses the southern Danmarkshavn Basin and continues eastward across the Danmarkshavn Ridge into the Thetis Basin, and over the shelf edge. The western-bounding fault of the Danmarkshavn Ridge is seen on all three of the potential-fields profiles, Gzz-Gz Magnetic, but the Gzz dataset provides the clearest definition of the fault position. The magnetic profile indicates a heterogeneous basement structure, with early modeling indicating presence of magnetic and non-magnetic basement. The eastern-bounding fault of the Danmarkshavn Ridge is more difficult to define, and the Gzz and Gz profiles indicate that the fault should be positioned farther eastwards than the presently interpreted seismic data. However, another option is that the hanging-wall contains high density rocks (intrusive?), and that the fault is correctly interpreted on seismic profiles. We are at the early stages of modeling, but further analysis of all the data may well lead to a shallower basement than current mapping in this region of the Thetis Basin.
The acquisition, processing, inter pretation and modeling of Full Tensor Gravity Gradiometry (FTG) data are quite comparable in complexity with advanced seismic imaging technology. Here we have not delved into the complete story, e.g. presentation of density and susceptibility models. Rather our goal here is to demonstrate the value of mapping and modeling regional airborne potential fields to infill regional structural models in frontier basins having only regional seismic coverage. Integration of gradiometry investigations with seismic datasets and interpretations affords synergistic leverage to subsurface interpretation in both 2D and 3D. This technology has proven to be technically feasible and to provide a new and expanded vision for understanding the geological architecture of the north-east Greenland continental margin sedimentary basins.