Geophysicists are involved at every stage of hydrocarbon exploration, development, production and at field ‘end of life’. They can be responsible for data acquisition and processing, its interpretation, and integration of the data with information from other geoscience disciplines to construct a viable prediction of the subsurface. Geophysicists use many different types of data to assess the subsurface, including gravity, magnetic, seismic refraction, seismic reflection, electro-magnetic, induced polarity and resistivity. Each of these provides a piece of the puzzle. We never have all the pieces, so we will never see the complete picture of the subsurface – but then that’s the challenge. The ultimate goal of any exploration team is to find reservoir rock trapping oil, gas or condensate in economic volumes.
Thinking in 3D
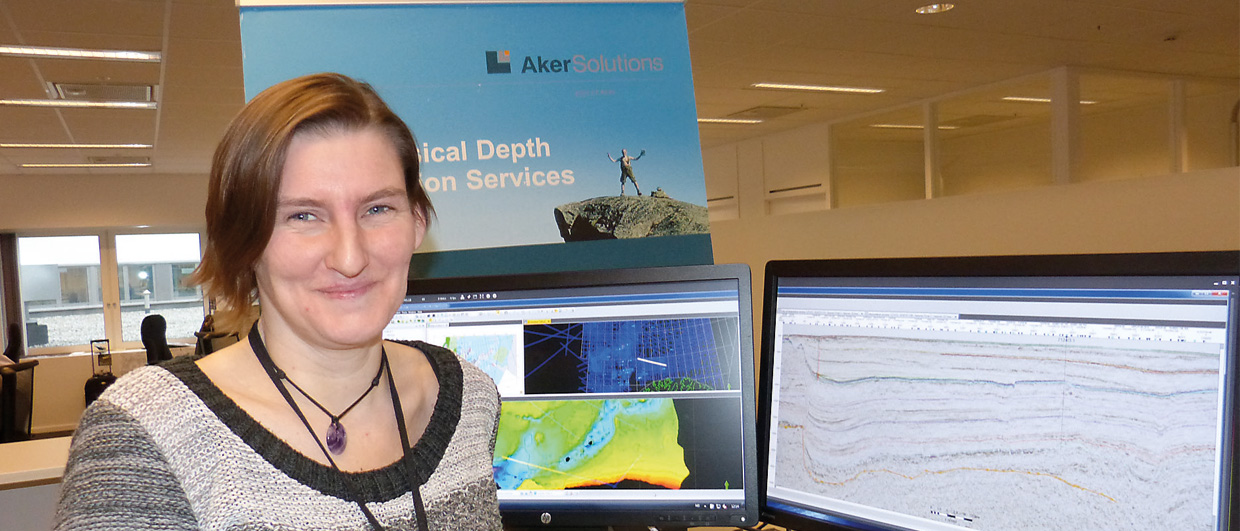
I am currently working as a seismic interpreter, part of a multidisciplinary team putting together license applications for the Norwegian 23rd license round.
As with any interpretive process we have to make sure our base data is of the highest quality possible. We check the seismic data for polarity and phase according to the SEG standard being used. Where there are several seismic surveys overlapping, a harmonization process has to be performed, bringing together surveys of varying vintages and quality, to have the same phase and polarity. It may also be necessary to time shift surveys to ensure a good continuity on a regional scale. During this data quality assurance check and harmonization we use well data (sonic, density and gamma logs) as well as check-shots to tie the wells into the seismic. A synthetic seismogram is generated from the well data to aid this process – an incredibly important step as it connects the time domain seismic data to the well which is in the depth domain. The quality of this well tie is also dependant on good quality log data.
We can then take the interpretations the geologist has made from the well (formations, reservoir units, chronostratigraphy, etc.), and display these geological interpretations on the seismic, analyze the character of the seismic at points of interest (e.g. reservoir) and use this seismic character to interpret the lateral and vertical variations and limitations of the unit away from the well location. This link between geological facies analysis and seismic facies analysis enables us to ‘predict’ the extent of the unit concerned. In addition to the basic seismic data, we can derive attributes to see the variability of things like amplitude, frequency content, phase shifts, wavelet asymmetry and acoustic impedance. Combinations of attributes can be useful to identify and classify seismic facies, and if intercepted by a well they can be correlated with a specific geological unit.
We are also on the look-out for Direct Hydrocarbon Indicators (DHI or HCI): flat spots, polarity reversals and AVO anomalies, for example. However, these indicators are not unique to reservoirs filled with hydrocarbons. We need to use other investigations and information to confirm or negate whether the anomaly is due to hydrocarbons.
As things like volume calculations and drilling operations work in the depth domain, we have to convert the seismic interpretation from time to depth by generating a velocity model for the area of interest using velocity information derived from wells and/or from the seismic data. These conversions are generally QC’d at control points, often wells that have not been used to construct the velocity model. Presentation of our interpretations is often in map form, showing the depth and thickness of a predicted reservoir, the size of the trap and its spill points, and any potential drilling hazards (e.g. shallow gas). Maps of any attribute analysis in the area are presented, as well as seismic cross-sections to demonstrate the trap and the salient points of the interpretation.
Our work is very visual in nature; we look for patterns, make observations, thinking in three dimensions, image recognition and correlation with text book examples, problem solve and use our intuition on a daily basis.
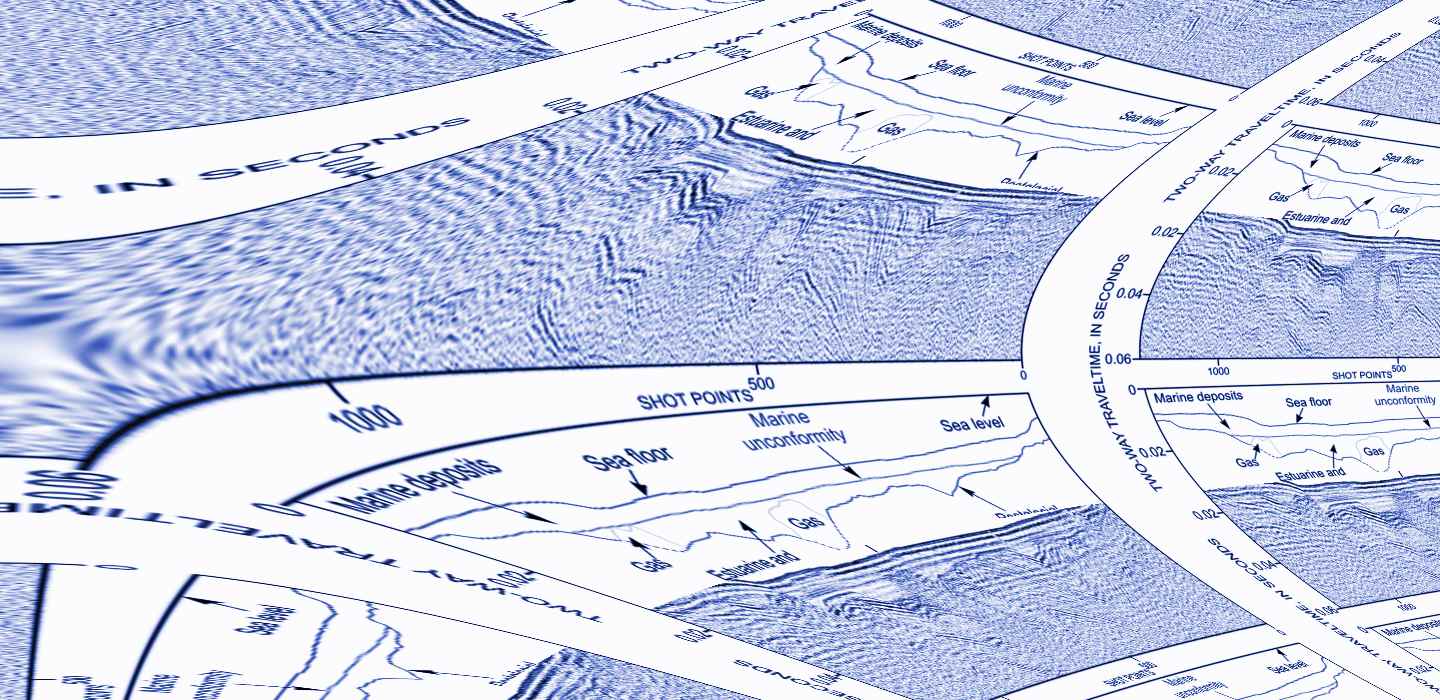 The term ‘geophysicist’ covers many specialist areas of work, but what we have in common is the recognition that different rocks and fluids respond differently to applied forces such as sound, gravimetric, magnetic and electrical. These differing rock properties enable us to describe what is under our feet or indeed beneath the waves. (Image modified from USGS),