Timing is critical in the formation of any petroleum system: if the key elements are not in place at the correct time, hydrocarbons will not form or accumulate. Understanding how these systems evolve through time is therefore essential for maximising the likelihood of success and providing information on which to base future decisions regarding the development of a resource. Kinematic modelling gives us the tools to ‘see’ into the past, allowing for a robust analytical study and therefore provides us with a way to better understand the evolution of petroleum systems and to develop realistic geological models.
This model demonstrates the timing and relationships (a–d) of complex 3D geometries in the Bolivian fold and thrust belt. (Repsol-YPF are acknowledged for providing data).
4D Thinking
For more than thirty years, geoscientists at Midland Valley Exploration have used restoration and balancing techniques to unravel the geological evolution of petroleum systems, and to extract unseen information from available data. In consultation projects, this approach has facilitated the identification of new plays and additional resources, helping make informed decisions, improving well planning, and reducing risk associated with hydrocarbon recovery.
The key tool for investigating the past is Midland Valley’s Move™ software, which has been developed by geoscientists working in close collaboration with software developers. The innovative approach, driven by geoscientists, has remained central throughout the development of Move. This has ensured that every tool is efficient and easy-to-use, therefore allowing users to quickly generate and analyse two and three-dimensional models and see evolution through time (the fourth dimension). The result is a software package that can be used to test and differentiate between alternative interpretations; identify key geological events; predict palaeo-basin architecture; analyse sediment dispersal and salt movement; and provide the ability to model strain and fracture systems. Collectively, these tools and techniques have the ability to solve many of the geological problems commonly investigated in the oil and gas industry, offering unparalleled insight into the geological evolution of petroleum systems.
Kinematic modelling is used to reveal timing relationships regarding juxtaposition, migration and charge associated with the footwall trap in a Listric normal fault from the Gulf of Mexico (a–d). Data from Xiao and Suppe (1992).
Questioning Interpretations
Interpretations remain a geoscientist’s best estimate of the truth. They need to be as accurate as possible to ensure that the right decisions are taken in the development and management of a prospect, or in planning further exploration. Strong emphasis must be placed on the importance of developing structurally valid interpretations based on geometric and geological principles, rather than the artistic skill and panache of the interpreter.
A typical workflow for testing interpretations in Move uses a combination of back-stripping and restoration techniques. This allows the user to identify locations of geometric, structural and geological inconsistencies, which may indicate whether a model is incorrect, or needs to be revised or potentially discarded. Successive iterations of the workflow and subsequent adjustments of the model produce a structurally valid interpretation. This modelling procedure highlights possible alternatives and enhances understanding of geological evolution in the area of study.
Combined 2D and 3D analysis for an extensional example from the Gullfaks field, North Sea. Using an interpretation of seismic imaging, block restoration and jigsaw fit, the mismatch between horizon and fault geometries is highlighted. During the subsequent adjustment of the interpretation, an alternative scenario involving fewer faults was developed, which increased the extent of the reservoir unit and led to other resources being identified along strike.
Visualising the Puzzle
Building a geological model typically involves piecing together different datasets and developing a solution that accurately honours the available constraints. Invariably, there will be pieces of this geological puzzle that are missing, and the interpreter is required to extrapolate between constraints into areas with little or no data. Numerous tools and techniques have been incorporated into the software to assist users in building geologically and structurally feasible models and reducing difficulties associated with integrating different datasets and extrapolating into unknown areas.
Realistic 3D surfaces can be generated quickly and easily using a number of algorithms from any positional constraint, including well data, 2D interpretations and surface intersection angles. In 2D, users can also develop interpretations and fill in the missing pieces by using several geological projection techniques. Horizons can be constructed using established fold geometry relationships, and developed to honour dip data and positional constraints. Geometric fault construction techniques, such as the constant heave method, can be used to predict fault geometries at depth where they are not as constrained by geological or geophysical data. Alternatively, users can interactively investigate faults at depth by forward modelling hanging-wall horizons, and then comparing them to observed geometries.
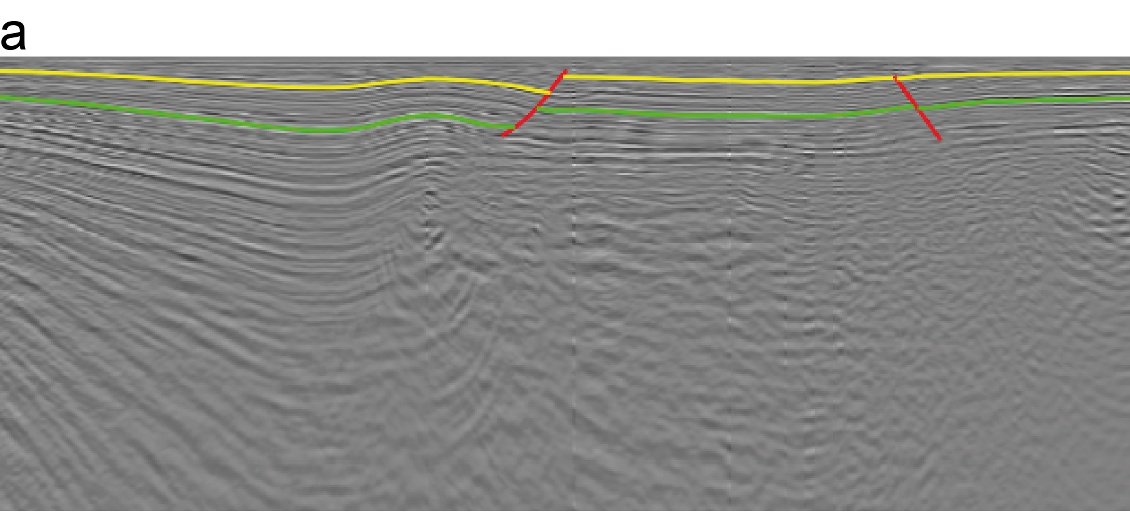
How do you interpret at depth where seismic imaging is poor? Geometric models permit realistic fault and bed shapes to be predicted at depth where information is limited (a–b). (BP/GUPCO are acknowledged for providing data from the Gulf of Suez.)
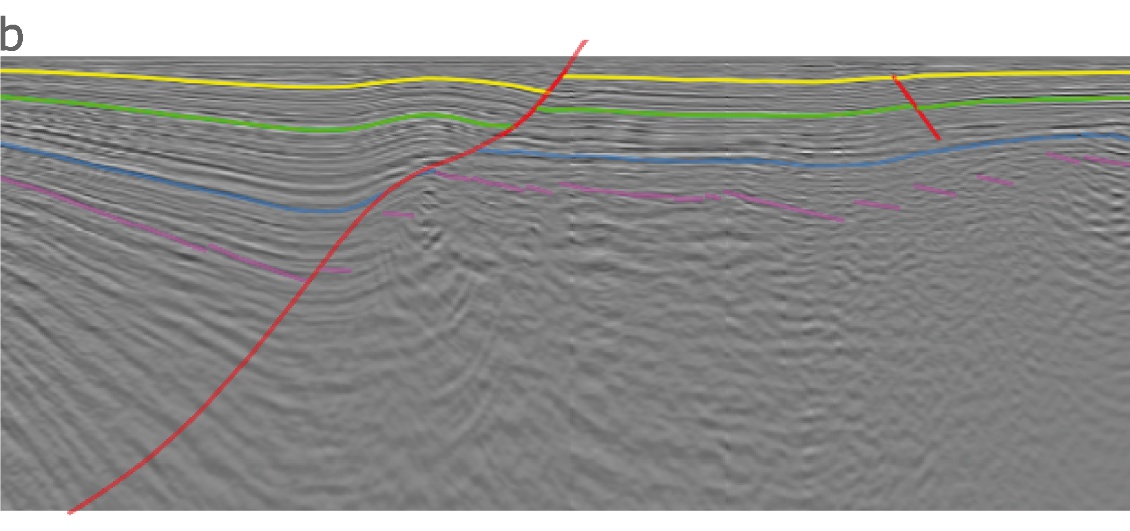
How do you interpret at depth where seismic imaging is poor? Geometric models permit realistic fault and bed shapes to be predicted at depth where information is limited (a–b). (BP/GUPCO are acknowledged for providing data from the Gulf of Suez.)
Collectively, these techniques and tools allow users to make predictions relating to unknown areas that are based on geological and mathematical principles, rather than speculation and guesswork. The result is more confidence in geological models, and an ability to objectively evaluate datasets in order to better understand the uncertainty attached to a model and therefore reduce the risks.
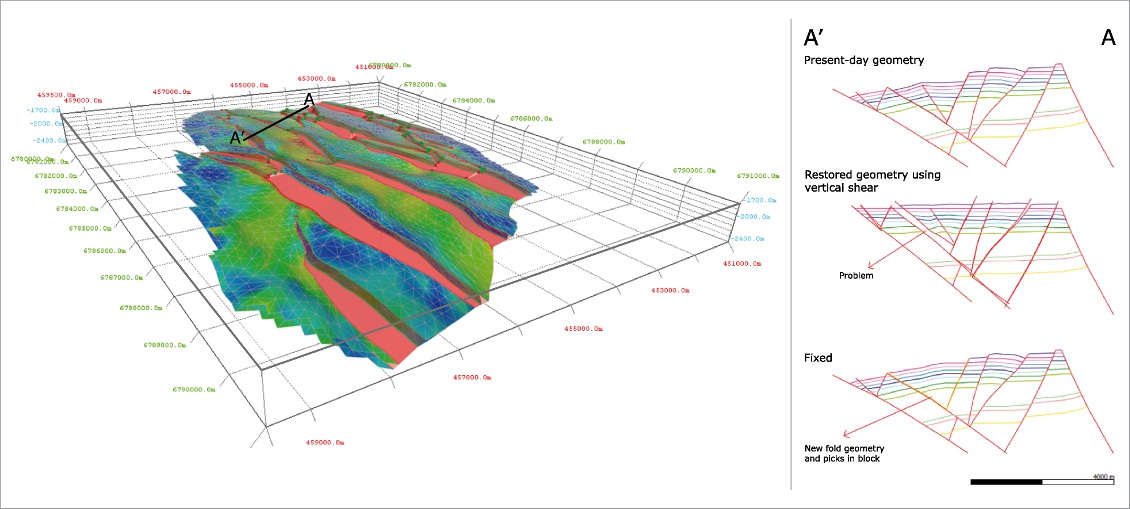
Once a structurally valid model has been constructed, the sequential restoration of deformation, sediment compaction and isostasy reveals the geometries and positions of key horizons through time. This provides a window into the past, which allows the evolution of petroleum systems to be investigated; for example, faulting and folding can be restored and modelled through a variety of kinematic and geomechanical algorithms. The kinematic algorithms can be used to restore both 2D and 3D models, and rely on geometrical relationships to maintain line-length, area and/or volume.
In contrast, the geomechanical algorithm considers the rock properties (Young’s modulus and Poisson’s ratio) and handles non-plane strain situations. The selection of the algorithm depends on the structural setting and the objectives of the restoration. Since Move uses mathematical models of reality, it is normal for a variety of restoration algorithms to be tested and compared. This makes it possible to assess the implications of different algorithms and develop an understanding of the uncertainty with the defined deformation history.
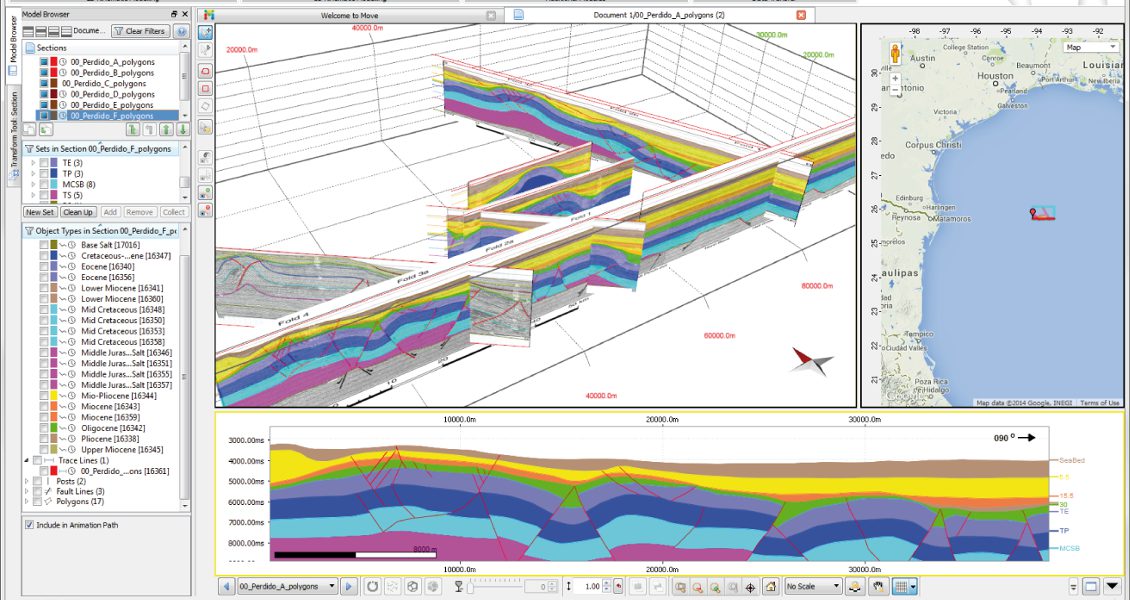
Move can be used to integrate all available data in 3D and model through time, allowing geoscientists to continually challenge and test assumptions and gain a better understanding of the model whilst solving complex geological problems. Data from Trudgill et al. (1999). Map Data ©2014 Google, INEGI.
Identifying ‘Sweet Spots’
The amount of additional analyses and potential applications that can be carried out in this software is vast. Here we give an example of the development and analysis of sediment models based on the geological evolution determined from conceptual models, and interpretations tested through restoration.
For hydrocarbon reservoirs hosted in turbidite deposits, Move can be used to simulate turbidity flows. This aids in the assessment of sediment distribution and reservoir quality attributes, and ultimately can lead to the identification of optimal package thicknesses, grain size distributions and sand fractions: ‘sweet spots’ in the reservoir units that should be targeted for drilling.
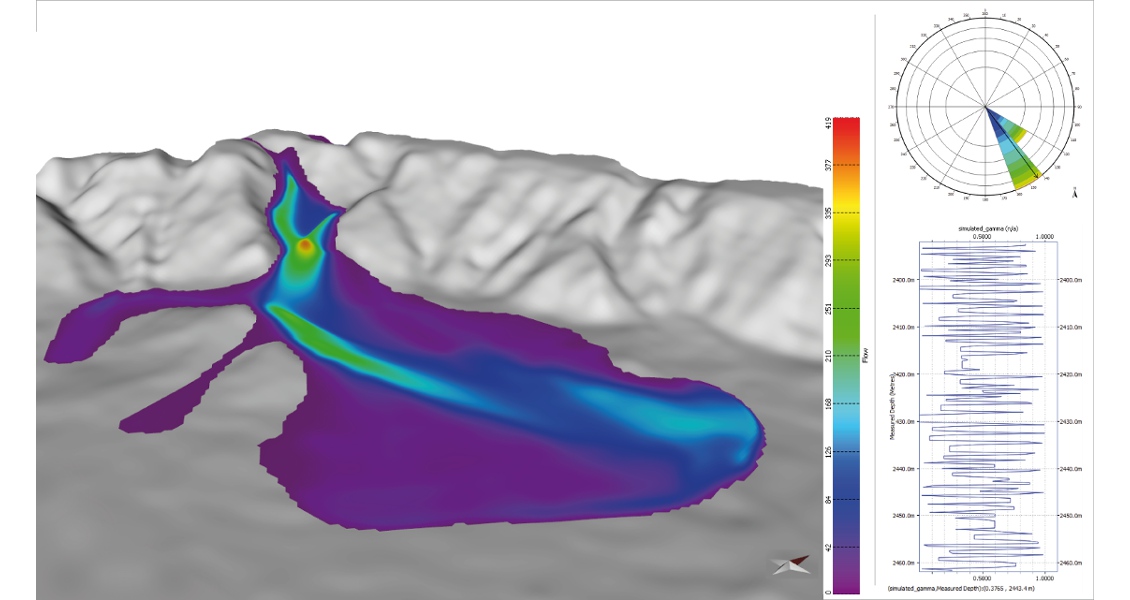
Sediment flow run over the present-day bathymetry south of Nice, France (The GEBCO_08 Grid, version 20100927, courtesy of http://www.gebco.net). This model is inspired by a turbidity flow that developed from a large landslide associated with the construction of Nice International Airport in 1979. (Mulder et al. 1997)
The workflows within the Sediment Modelling module are very flexible and can be tailored to investigate specific aspects of turbidite deposition, including the number of turbidity currents, the location of entry points into a basin, and the initial sediment composition. Initially, this requires the construction of a palaeobathymetric surface which can be generated using the 3D Kinematic Modelling module tools to restore deformation, sediment compaction and isostasy. Turbidity flows can then be run across this surface to investigate sedimentation: for example, to test basin entry points, predict the amount of sand, determine the net:gross relationship and distribution, or simulate multiple scenarios and compare the predicted sediment attributes to observed data from wells to identify the best-fitting flow or flows (inverse modelling). As with many of the workflows within Move, the ability to quickly carry out modelling and analysis means that multiple models can be tested and evaluated, providing more insight into the spatial distribution of reservoir units and reducing uncertainty within a hydrocarbon play.
Dynamic Solutions
In the past, traditional paper maps, sections and elaborate isometric diagrams were the cutting edge of geosciences and offered fascinating new insights into geology. As technology has advanced, the ability for geoscientists to investigate the sub-surface and constrain the geological evolution of an area has vastly improved. The powerful modelling and analysis tools within Move have the potential to be a significant asset to all geoscientists working in the oil and gas industry, enabling the user to visualise and test ideas, generate solutions, effectively communicate concepts, and interact with geological models in a flexible and dynamic ma