When I start a new project, I commonly get this question: “What is the geothermal gradient in this area?” The question stems from an underlying assumption that the gradient provides information about the temperature down deep at the source rock level. I don’t particularly care. Why? Well…, what gradient are we talking about? At what depth range?
Geothermal gradient is a rate of temperature change with depth – the slope of a line in a temperature-depth (T-D) plot between two temperature measurements in a well. Using a single gradient implies a linear geotherm.
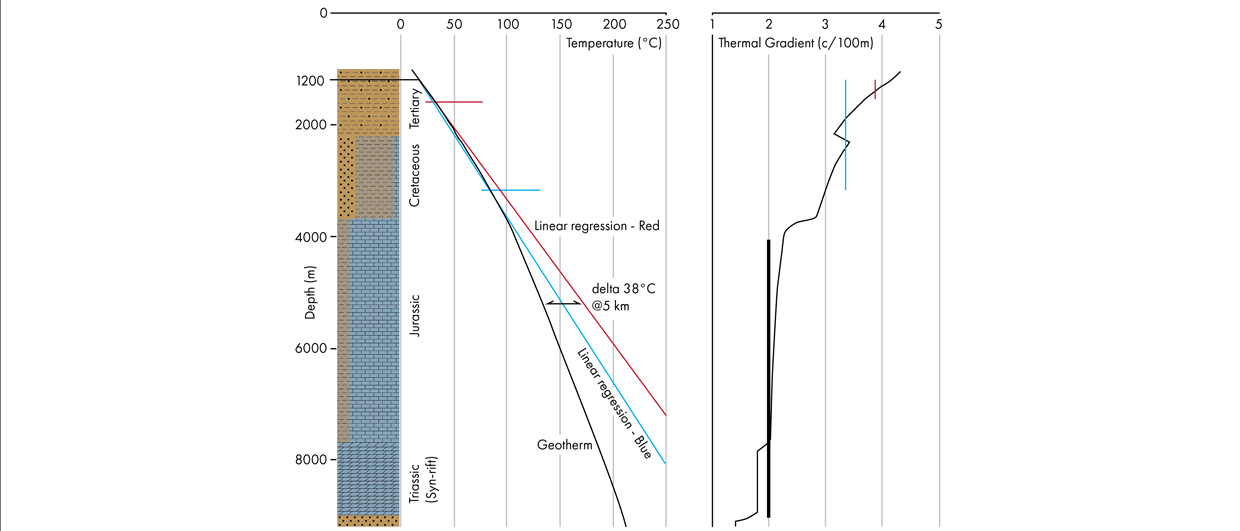
Let’s consider a North Sea 1D model and focus purely on the present-day temperature, ignoring transient effects over geologic history. Looking at the model plot we can immediately notice that the temperature does not increase with depth in a linear manner, i.e. at a constant rate. The geotherm is a curve in the T-D plot and the gradient generally decreases with depth. Why? Because the rocks are less porous and therefore more conductive with increasing depth. This is only partly balanced by the opposite effect of thermal conductivity decreasing with increasing temperature.
Further, lithology contrasts induce substantial variation in the geotherm slope (the gradient). And we don’t even consider the extreme case of salt here. Notice the sharp change in the geotherm slope at the top of Jurassic carbonates. That is because carbonates are more conductive than shales. Shales act as insulators, slowing the upward heat flow and therefore temperature increases below. That translates to a) higher T gradient within the shaly section and b) the geotherm within the conductive carbonates being shifted to higher temperature and slightly steepened. The effect is further supported by a substantial shale radioactive heat generation.
Consider two linear temperature regressions starting at 1200 m depth bsl (200 m bsf). The red one fits through the temperature 600 m deeper, the blue one fits through the temperature 1800 m deeper. The corresponding average gradients over those depth ranges are indicated in the gradient plot. Interpolated temperatures over those intervals are close to the geotherm, although the blue line is up to several °C lower than the geotherm. Extrapolations look entirely different though. At 5000 m bsl (4000 m bsf), the red line overestimates the geotherm by 38°C, let alone deeper down.
A constant geothermal gradient is not a good rule of thumb to extrapolate temperatures – not even close. At best, it can be used for temperature interpolation over a short depth range at a reservoir scale. A simple 1D thermal model is needed to get a meaningful temperature estimate at depth.