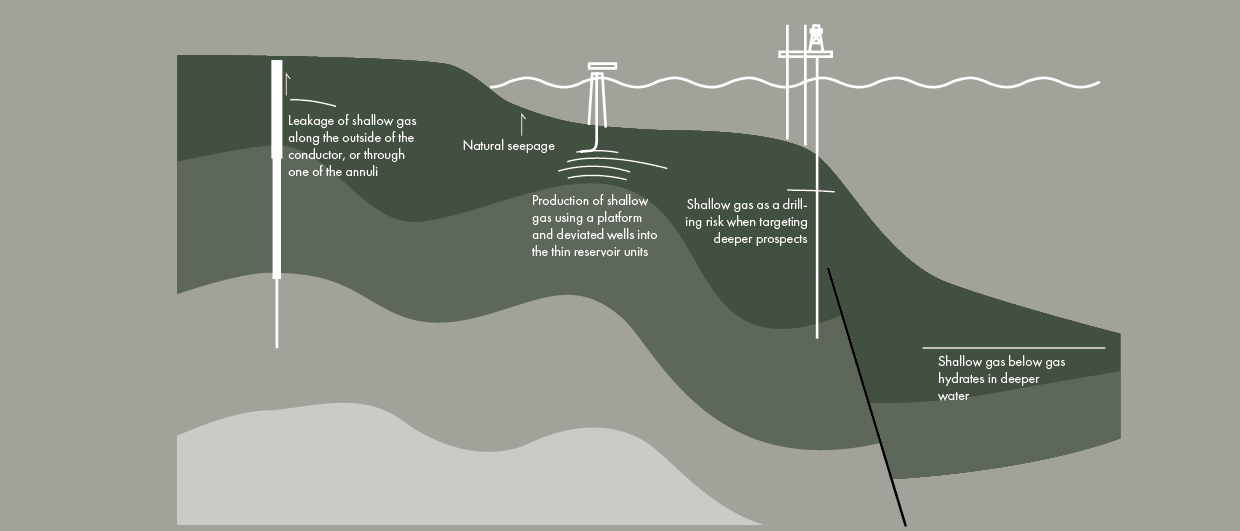
Shallow gas has long been known as a drilling hazard. However, the increasing costs of powering offshore production facilities, the problems associated with decommissioning, and the contribution of natural and induced methane seepage to global warming, have all begun to focus attention on shallow gas either as a resource or as a problem, each requiring a different array of engineering strategies.
This is the first article in a series of three on the different aspects of shallow gas, brought to you by Francis Buckley. Today, he focuses on shallow gas as a drilling hazard.
Shallow gas as a drilling geo-hazard
Before a new offshore well can be drilled, it is considered best practice to carry out a site survey to find out if there are any pockets of gas in the shallow subsurface. Why is it so hazardous to drill into these shallow gas pockets? The main reason is that once a pocket is penetrated by the drill bit, uncontrolled release towards the sea floor can lead to explosions and large methane venting events that can carry on for a long time.
And where drilling into a gas pocket deeper down brings protection from the blow-out preventer (BOP) and the overburden, this is much less so in the first hundreds of meters below the mud line. BOP stacks cannot be installed until the surface casing string is securely installed, with a casing shoe set in a competent formation such that any connection to down-hole pressures can be contained. In addition, the low fracture gradient within the top-hole section limits the extent to which mud-weight alone can be used to control gas kicks and so avoidance of any shallow gas represents the most effective risk mitigation strategy.
There are plenty of examples of cases where drilling a shallow gas pocket went wrong. In the Gulf of Mexico in 1964, the CP Baker drilling rig penetrated a shallow gas reservoir in the top-hole section prior to the installation of the BOP system. Escaping gas caused seawater to erupt around the vessel’s hulls and entered through open doors. A subsequent explosion and fireball killed 21 crew, injured 22 others, with a further fatality on a vessel alongside at the time of the disaster. In terms of loss of life, this was the worst shallow gas blowout in the history of offshore drilling.
In 1985, a shallow gas blow-out occurred while the West Vanguard was drilling the top-hole section of a well at Haltenbanken in the Norwegian sector of the North Sea. There was one fatality. Another North Sea blowout took place on the 20th of November 1990, when Mobil North Sea (MNSL) encountered shallow gas at 360 m below seabed while drilling in the Quaternary section of exploration well UK22/4b-4 in the UK sector. The well blew out, creating a massive bubble plume that rapidly diminished after several days. However, during a survey in September 2011, 21 years later, strong gas emissions were still occurring, and a blow-out crater on the seabed can still be seen.
How are the risks for shallow gas mitigated?
Typically, a geohazard site survey is carried out before the rig arrives to spud the well. In the North Sea, this has been a routine element of exploration drilling since the 1970’s and is considered a due-diligence approach to all drilling projects.
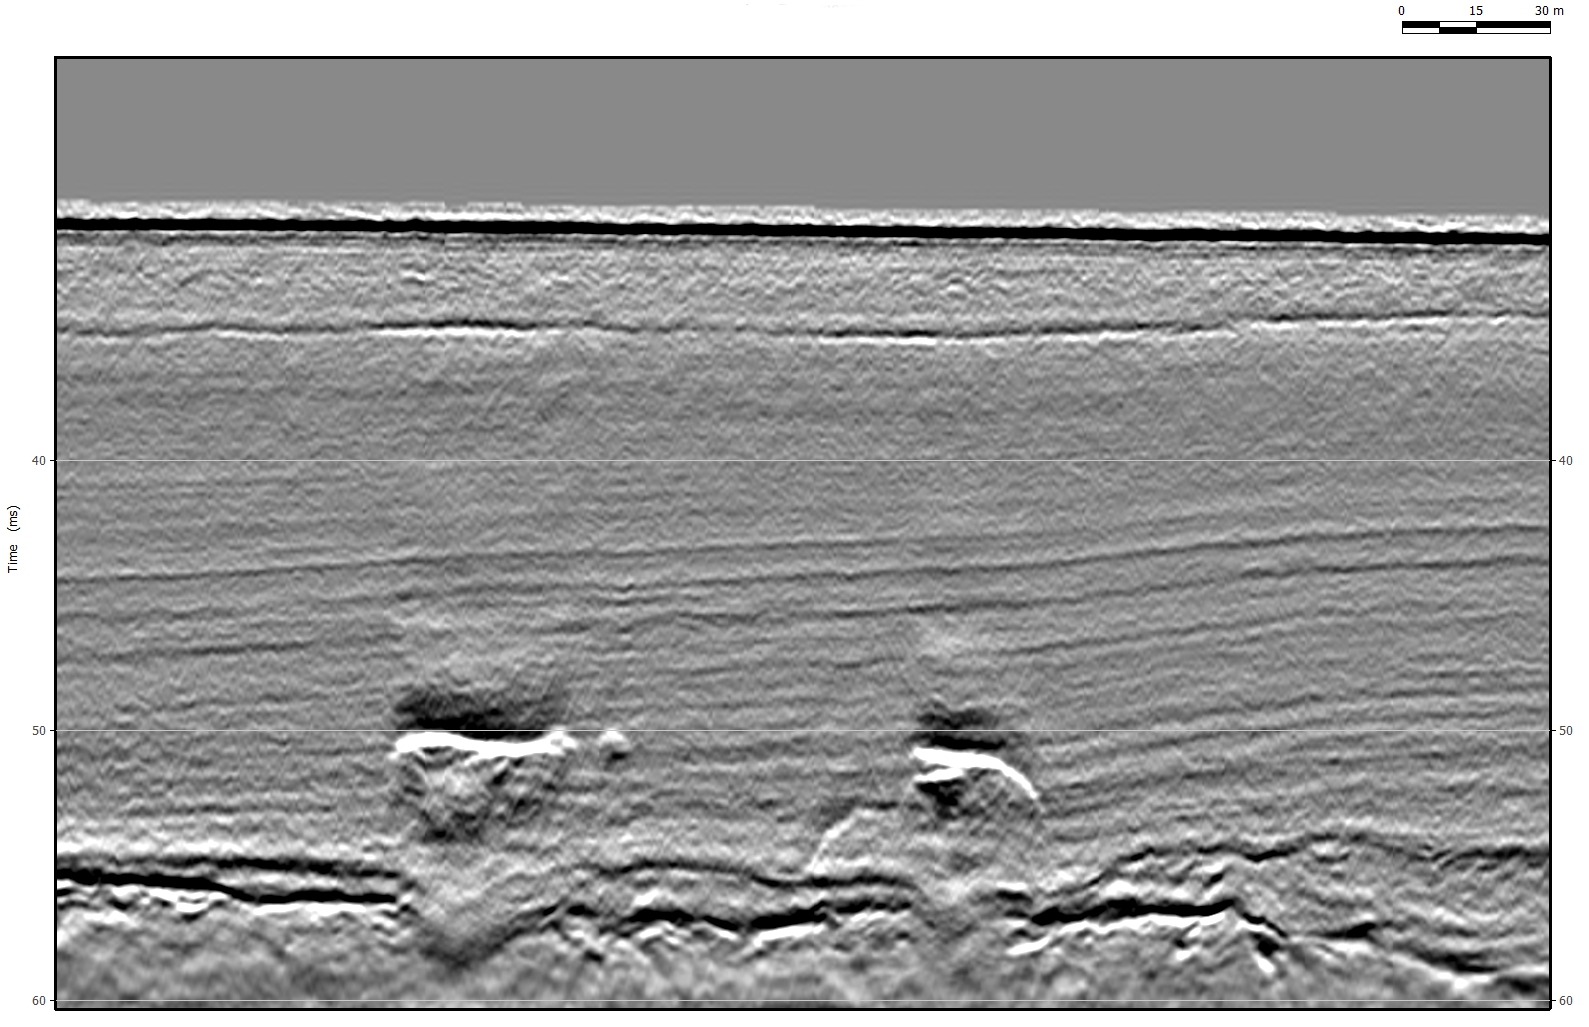
Dedicated site surveys are required because the “conventional” 3D seismic exploration data, which aims to illuminate the subsurface at depths of 2 to 3 km, do not generally image the top-hole section at sufficient resolution for the purpose of shallow gas detection. Modern 48 or 96-channel HR2D systems, with far-channel offsets of up to 1,200 m, are capable of acquiring data to 2 seconds TWT below the seabed, or deeper if required. Frequency content may be up to 250 Hz, or higher for UHR systems, with vertical resolutions of just a few meters in the top-hole section.
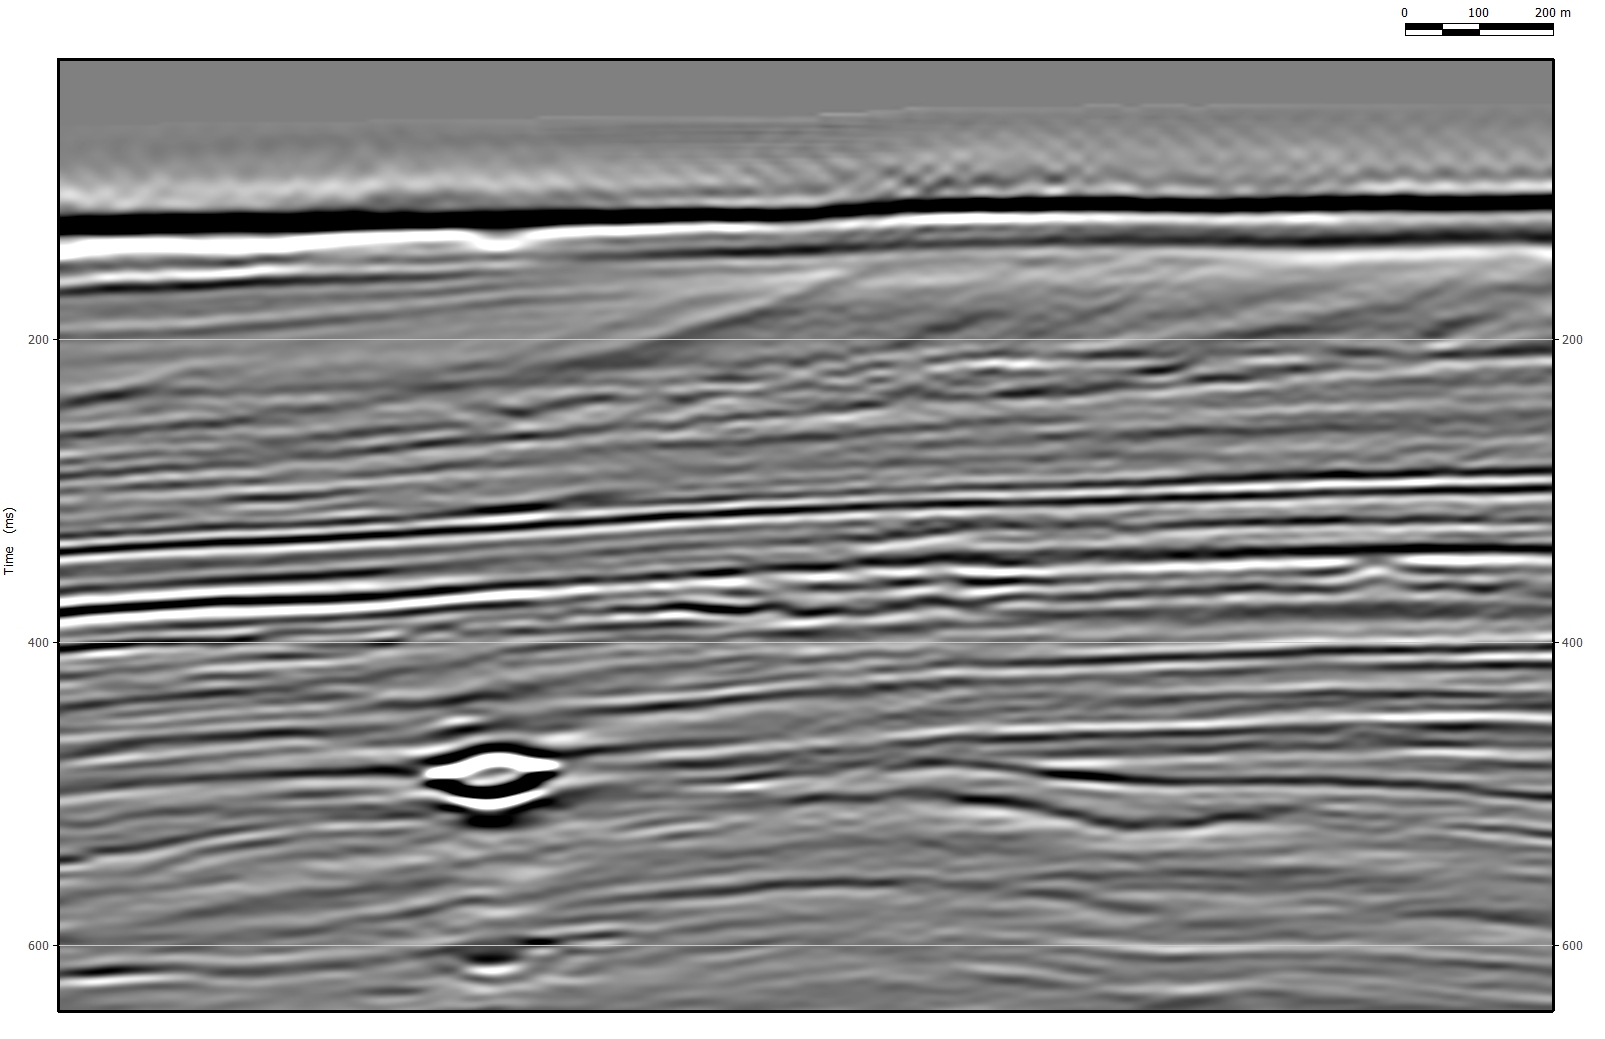
The detection of shallow gas anomalies normally relies on the interpretation of reversed-phase seismic anomalies, also called bright spots. Practical proof that amplitude anomalies may represent shallow gas accumulations is borne out by the seismic response at the 2/4-14 well in the Norwegian North Sea where a reservoir blow-out in 1989 resulting in gas ingress from the well into an un-cemented annulus and subsequent injection into a series of thin sand units within the Pleistocene succession. These were detected on a subsequent 3D seismic survey by a series of sub-circular seismic anomalies, which grew over several months to approximately 10 km in diameter.
However, a reverse phase anomalous reflection is considered only to represent a probability of gas rather than a diagnostic proof of gas. In the absence of any other features diagnostic of gas, this probability would be considered to be low in that a gas interpretation, while possible, may not be considered the most probable, and other interpretations may be more likely. If the amplitude anomaly is associated with other attributes diagnostic of gas, an argument can be made in favour of an interpretation that gas is a more probable cause.
Other hydrocarbon-indicating features include a number of other attributes that may be used to build an argument for gas-probability, including the selective high-frequency attenuation effect of gas, the velocity suppression effect, structural considerations, the lithological model and the evidence of offset-well data.
Once a gas pocket is detected and a well location is planned such that the shallow gas is avoided, there is still no guarantee that no gas will be encountered at all. Gas is omnipresent in sedimentary basins, be it in low concentrations most of the time. In those cases, simple diverter systems are all that is required to manage the problem. Larger volumes of flowing gas cannot be contained by these diverter systems, and therefore, avoidance is considered the safest mitigation. Offshore wells are, therefore, generally sited at least 100 m from seismic anomalies considered to represent a probability of shallow gas.
The geohazard interpretation community adopts a highly risk-averse approach to shallow gas interpretation, such that even very marginally raised amplitude events may be considered to represent a probability of gas and, hence, a risk to successfully drilling the well.
Drawbacks of the current way of working
While the likelihood of encountering shallow gas is considered to represent a significant risk, operators have consistently been reluctant to commit much funding to addressing the risk to any extent other than the barest minimum. Therefore, nearly all site survey data acquisition is high-resolution 2D rather than 3D and ancillary data, in the form of top-hole well logging, is rarely available. Both HR3D and top-hole wireline data acquisition may sometimes be challenging, but the lack of these data can severely compromise the ability of site survey practitioners to accurately predict top-hole conditions.
In addition, defining what is ‘anomalous’ can be highly subjective. Some workflows define an anomaly as having a particular amplitude above a ‘background’ threshold, but these values are often dependent on geology, depth within a sequence and processing of the data. An attempt by the author to objectively define what is anomalous takes a statistically derived amplitude decay curve from a data volume and plots potentially anomalous events on the same graph. Departures from the statistical decay curve can then be individually assessed.
Dag Lundqvist from Equinor has drawn attention to instances of false positive identifications of shallow gas on seismic data and failure to identify shallow gas on seismic following top-hole shallow gas incidents. He concluded that there was only a 50 % chance of geohazard practitioners accurately predicting the presence of shallow gas (FORCE seminar, Stavanger, 2011).
It is also important to remember that seismic anomaly thresholds can only ever represent a subjective best estimate of anomalous behaviour, although there are semi-quantitative methods for assessing ‘how anomalous’ a particular event might be. Anomalous amplitudes are obviously just the initial step in defining shallow gas probability and it should always be remembered that seismic amplitude is a very misleading indication of gas content, as very high amplitudes can result from almost negligible gas content.
A further complication is differences in phase and polarity between different datasets, the subtleties of which are often missed. The main conclusion is that anomalous amplitude thresholds can only ever represent an approximation at limits of likely gas probability.
How can we do better?
In the presence of suitable datasets, it is possible to constrain estimates of porosities, pore-fluid gas fraction, gas volume and gas buoyancy overpressure, such that risk mitigation becomes a more data-driven exercise. The key to such workflows are 3D seismic angle-stacks (although 2D stacks may suffice), and reliable velocity and density logs.
Angle-stacks provide the raw material for Amplitude-Versus-Offset (AVO) analysis, which may provide diagnostic evidence for the presence of gas and inform the construction of a geological model. In addition, sonic and density wireline data provide calibration for absolute impedance inversions of the seismic, whilst fluid-substitution exercises, based on Vp, Vs, density and porosity estimates, may be used to constrain estimates of gas-fraction within pore-fluids. In some circumstances, Extended Elastic Impedance (EEI) inversions may be carried out, whereby interpretations of lithology, porosity, pore-fluid chemistry and pressure may be made with greater confidence.
Workflows such as these have been carried out in furtherance of risk mitigation decisions. However, they are the exception rather than the rule and are way beyond the scope of traditional geohazard investigation projects. The key constraint is the lack of suitable data, although relative impedance seismic inversion is a reasonably accessible workflow. Training of geohazard interpretation specialists, on the other hand, rarely goes beyond simple amplitude interpretations for shallow gas.