Raman Spectroscopy enables precise reservoir rock characterisation studies and provides invaluable insight into the reservoir’s heterogeneity and other fine-scaled details.
In today’s competitive market, reservoir rock characterisation has become a critical success factor. Understanding the reservoir’s heterogeneity as well as the intricacies of the rock could make the difference between profit or not. Measurements that the industry has used in recent times include mineralogy (minerals present and in what quantities), total organic carbon (TOC), thermal maturity, brittleness, microfossil identification and distribution, and porosity. Understanding how these change throughout the reservoir is important for reservoir evaluation and completion designs. Data such as these are utilised for determining where to land a lateral and exactly where and how best to stimulate the well.
Another critical success factor is the interaction between the chemical composition of the fluids and solids used in completing or stimulating a well and those that exist in the subsurface. These interactions can affect the physics and chemistry of a well and impact its producibility. By combining intimate knowledge of the well’s fluids with the geochemical profile of the formation, a company can more efficiently plan stimulation plans, or even secondary recovery.
What is Raman Spectroscopy?
Figure 1: Overview of how Raman spectra are captured and an example of the Raman spectrum of water, which shows three Ramanactive molecular vibrations: bending, symmetric stretching, and asymmetric stretching.
Raman Spectroscopy is an old technology, but modern optics and computing technologies are opening new applications that were previously off limits. It is named after Sir C.V. Raman, one of the scientists who discovered it in the 1920s, earning him the Physics Nobel Prize in 1930. In the classical description, photons of light inelastically scatter off molecules, resulting in the transfer of a small amount of energy. When energy is transferred to the molecule, the molecule begins to vibrate, and the scattered photon is red-shifted in colour (termed Stokes Raman scattering). The magnitude of the Raman shift is characteristic of the molecular vibration. In modern times, a monochromatic laser is used as the excitation source and specialised filters along with sensitive photon detectors are used to capture Raman scattering for chemical fingerprinting of materials. The colours of the scattered photons are different for each molecule and are based on the chemical bonds within the molecules.
Raman spectra can be acquired using a petrographic microscope that focuses a laser onto the surface of the sample, an area as small as one square micron. The light scattering from the sample passes through a filter and a Raman spectrum from the material in that area is recorded on a CCD-detector (Figure 1).
Raman spectra can be used to identify and quantify a variety of materials on a molecular vibrational basis. This includes thousands of minerals, as well as organic material in source rocks and gases. The Raman shift is based on molecules and the arrangement of the molecular bonds, the advantage being that it is possible to differentiate between minerals which have the same elemental composition but different structures. The atoms in those crystals are arranged differently, and therefore the vibrations are different: for example, polymorphs of titanium oxides and iron sulphides are easily distinguished in Raman spectra.
In Figure 2a, Raman spectra are shown from a variety of gases important in the oil and gas industry, including light hydrocarbons, carbon dioxide, nitrogen and hydrogen sulphide. These can be measured in a variety of ways: dissolved in formation fluids in situ, at the surface through a pressure manifold and even midstream in the pipeline. Reservoir Raman Spectroscopy technologies, such as those performed by WellDog, can be applied to a wide range of well prospecting, development and production scenarios.
Figure 2: (a) Raman spectra of various gases. (b) Example spectra of some clays, micas and quartz. (c) Because this technique is based on molecular vibrations, elemental equivalent polymorphs can be differentiated.
Figure 2: (a) Raman spectra of various gases. (b) Example spectra of some clays, micas and quartz. (c) Because this technique is based on molecular vibrations, elemental equivalent polymorphs can be differentiated.
Figure 2: (a) Raman spectra of various gases. (b) Example spectra of some clays, micas and quartz. (c) Because this technique is based on molecular vibrations, elemental equivalent polymorphs can be differentiated.
What Does Raman Spectoscopy Tell Us About the Reservoir Rock?
To fully understand the reservoir, certain characteristics of the reservoir rock need to be quantified to determine how the rocks come together to create production sweet spots. The primary characteristics are the organic constituents in the rock, mineralogy of inorganic rains and associated cement, porosity, permeability, and composition of the fluids. Thermal maturity is also a key piece of information in understanding the best targets in a reservoir.
Raman microscopy yields information about the solids and pore spaces of the reservoir, as well as thermal maturity. It is a non-destructive, repeatable, objective way to look at cuttings, core, plugs or thin sections.
There are many challenges in determining thermal maturity for the purposes of source rock assessment. Important factors are temperature, time, and pressure; temperature being the most sensitive parameter in hydrocarbon generation. Reconstruction of temperature history is essential when evaluating petroleum prospects.
Vitrinite is a powerful method favoured by petrographers looking for coal, where that woody maceral is commonplace, but in shales – marine shales in particular – vitrinite can be extremely rare, if it exists at all. Vitrinite reflectance is a tedious measurement. Anisotropy affects it, as the material polishes up differently based on which face is oriented upwards. This forces the petrographer to locate and perform measurements on at least 50 bits of vitrinite, ideally more, all the while being careful to avoid recycled material, or solid bitumen, which can polish to a similar lustre, but has a different correlation to thermal maturity. Raman spectroscopy, however, provides a direct method of measuring thermal maturity and WellDog has participated in various studies to determine how Raman thermal maturity results compare to other methods. Initial results are promising, and more data points continue to bring enhanced confidence.
Reservoir Raman spectroscopy therefore not only determines the composition and quantities of the minerals present in the reservoir, but it can also measure TOC and thermal maturity.
Examples of Raman Spectroscopy in Use
An example of the use of Raman spectroscopy is the nondestructive lab service provided by Welldog’s Reservoir RockHound, which can discern the minerals, microfossils, organic matter, and pore spaces (including their contents) in core, cuttings, plugs or thin sections. It can also help determine thermal maturity.
Figure 3: (a) Photograph of the laser spot-focus onto the surface of a thin section sample. (b) Composite view of multiple passes.
The instrument is built around a petrographic microscope which can capture conventional optical images of the sample, as well as focus a Raman excitation laser to a single-pixel spot (Figure 3a). The sample is mounted on a digital encoded stage with sub-micron precision, which allows one to collect and characterise the Raman spectra from the material in the focused spot. Samples are studied in an automated, methodical fashion either by a point, line, or grid scan.
Using a grid provides a thorough analysis of the rock and its components. Various spectral maps can then be created to show exact minerals present in the sample, including their location. This leads to quantifiable mineralogic composition.
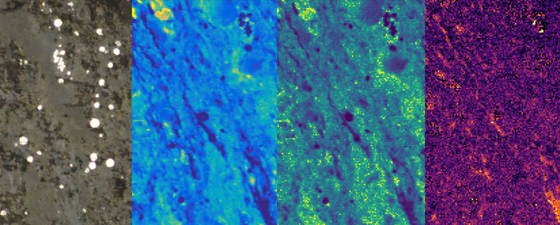
Figure 4a shows the highest resolution on the microscope. Bright pieces in the photo are pyrite (some rounder framboids). The stringy lighter grey colour is the solid bitumen. The rest is additional organic matrix material. A hyperspectral map consisting of Raman spectra in every square micron over this region (about 200 x 250 square microns) has been collected and analysed. Figure 4(b–d) shows three maps of Raman spectral parameters. The first can be termed pseudofluorescence and is a false-colour map showing the range of fluorescence intensities. The second and third are Raman characteristics of the organic material which distinguish carbon types and can be correlated with thermal maturity.
Figure 4: Optical view of a sample (a), and three Raman parameters differentiating various mineral and organic components: pseudofluorescence (b); carbon index (c); and G-Cluster width (d). Bitumen streamers can be seen in each photo as light gray (a), dark blue-black (b and c), and yellow-orange (d). Bright framboids in the optical view are pyrite, which can also be identified in each photo.
Figure 4: Optical view of a sample (a), and three Raman parameters differentiating various mineral and organic components: pseudofluorescence (b); carbon index (c); and G-Cluster width (d). Bitumen streamers can be seen in each photo as light gray (a), dark blue-black (b and c), and yellow-orange (d). Bright framboids in the optical view are pyrite, which can also be identified in each photo.
Figure 4: Optical view of a sample (a), and three Raman parameters differentiating various mineral and organic components: pseudofluorescence (b); carbon index (c); and G-Cluster width (d). Bitumen streamers can be seen in each photo as light gray (a), dark blue-black (b and c), and yellow-orange (d). Bright framboids in the optical view are pyrite, which can also be identified in each photo.
Figure 4: Optical view of a sample (a), and three Raman parameters differentiating various mineral and organic components: pseudofluorescence (b); carbon index (c); and G-Cluster width (d). Bitumen streamers can be seen in each photo as light gray (a), dark blue-black (b and c), and yellow-orange (d). Bright framboids in the optical view are pyrite, which can also be identified in each photo.
Achieving Optimal Wells Using Reservoir Rock Characterisation
Practical, fit-for-purpose technology can help one achieve optimal wells. Not only can the downhole fluids be identified and quantified, but the reservoir rock itself can also accurately be described. Additionally, since the source of the fluids is known, the composition of the reservoir from which those fluids flow can also be determined.
What does that mean for the bottom line? How might these technologies benefit oil and gas exploration and appraisal? If the features of the fluids in the well are known – composition, quantities, and where each is coming from – and the solids are also understood, then exploration and appraisal teams can more accurately determine which zones to target within the reservoir. Reservoir, production, and drilling and completions engineers can understand the best places to stimulate in the well and which fluids might be most effective in the process. Future secondary recovery efforts can also be maximised. This will save millions of dollars and significant time and resources. More environmentally sound decisions and perhaps even better public relations will result.
Armed with full knowledge of the reservoir, oil and gas producers can drill fewer wells while increasing production.