Rejuvenating legacy seismic for screening carbon storage sites in the Gulf of Mexico
A major challenge in the US Gulf of Mexico is transforming disparate public datasets into a quality-controlled database. CGG has successfully created and used a database for its Storage Play Quality Index (SPQI) carbon storage screening methodology and applied its latest imaging technologies to rejuvenate the legacy seismic data.
A major challenge in the US Gulf of Mexico is transforming disparate public datasets into a quality-controlled database. CGG has successfully created and used a database for its Storage Play Quality Index (SPQI) carbon storage screening methodology and applied its latest imaging technologies to rejuvenate the legacy seismic data.
The last two years have seen a rapid growth in interest in carbon storage in the US Gulf Coast. Carbon storage operators have been racing to take key acreage positions through Local State Bid Rounds and Shallow Water Gulf of Mexico (GOM) Lease Sales. The associated area of interest stretches across the coastlines of both Texas and Louisiana and contains high-quality reservoirs for carbon storage which occur within the Miocene clastic section at 2,500 ft – 10,000 ft.
Screening – Data and Workflow
To support operators in screening potential carbon storage sites, CGG created a quality-controlled and consistent database of legacy data. Data types include well log suites, deviation surveys, check shot surveys, well test data, core data, biostratigraphy, water chemistry and formation pressure data. The available information was a mix of analogue and digital data, totalling thousands of data files in some wells.
Data science workflows were developed to identify, evaluate, extract and enhance the data into a consistent digital database. Over 600 wells were selected for mapping and approximately 400 wells were used for extracting petrophysical properties.
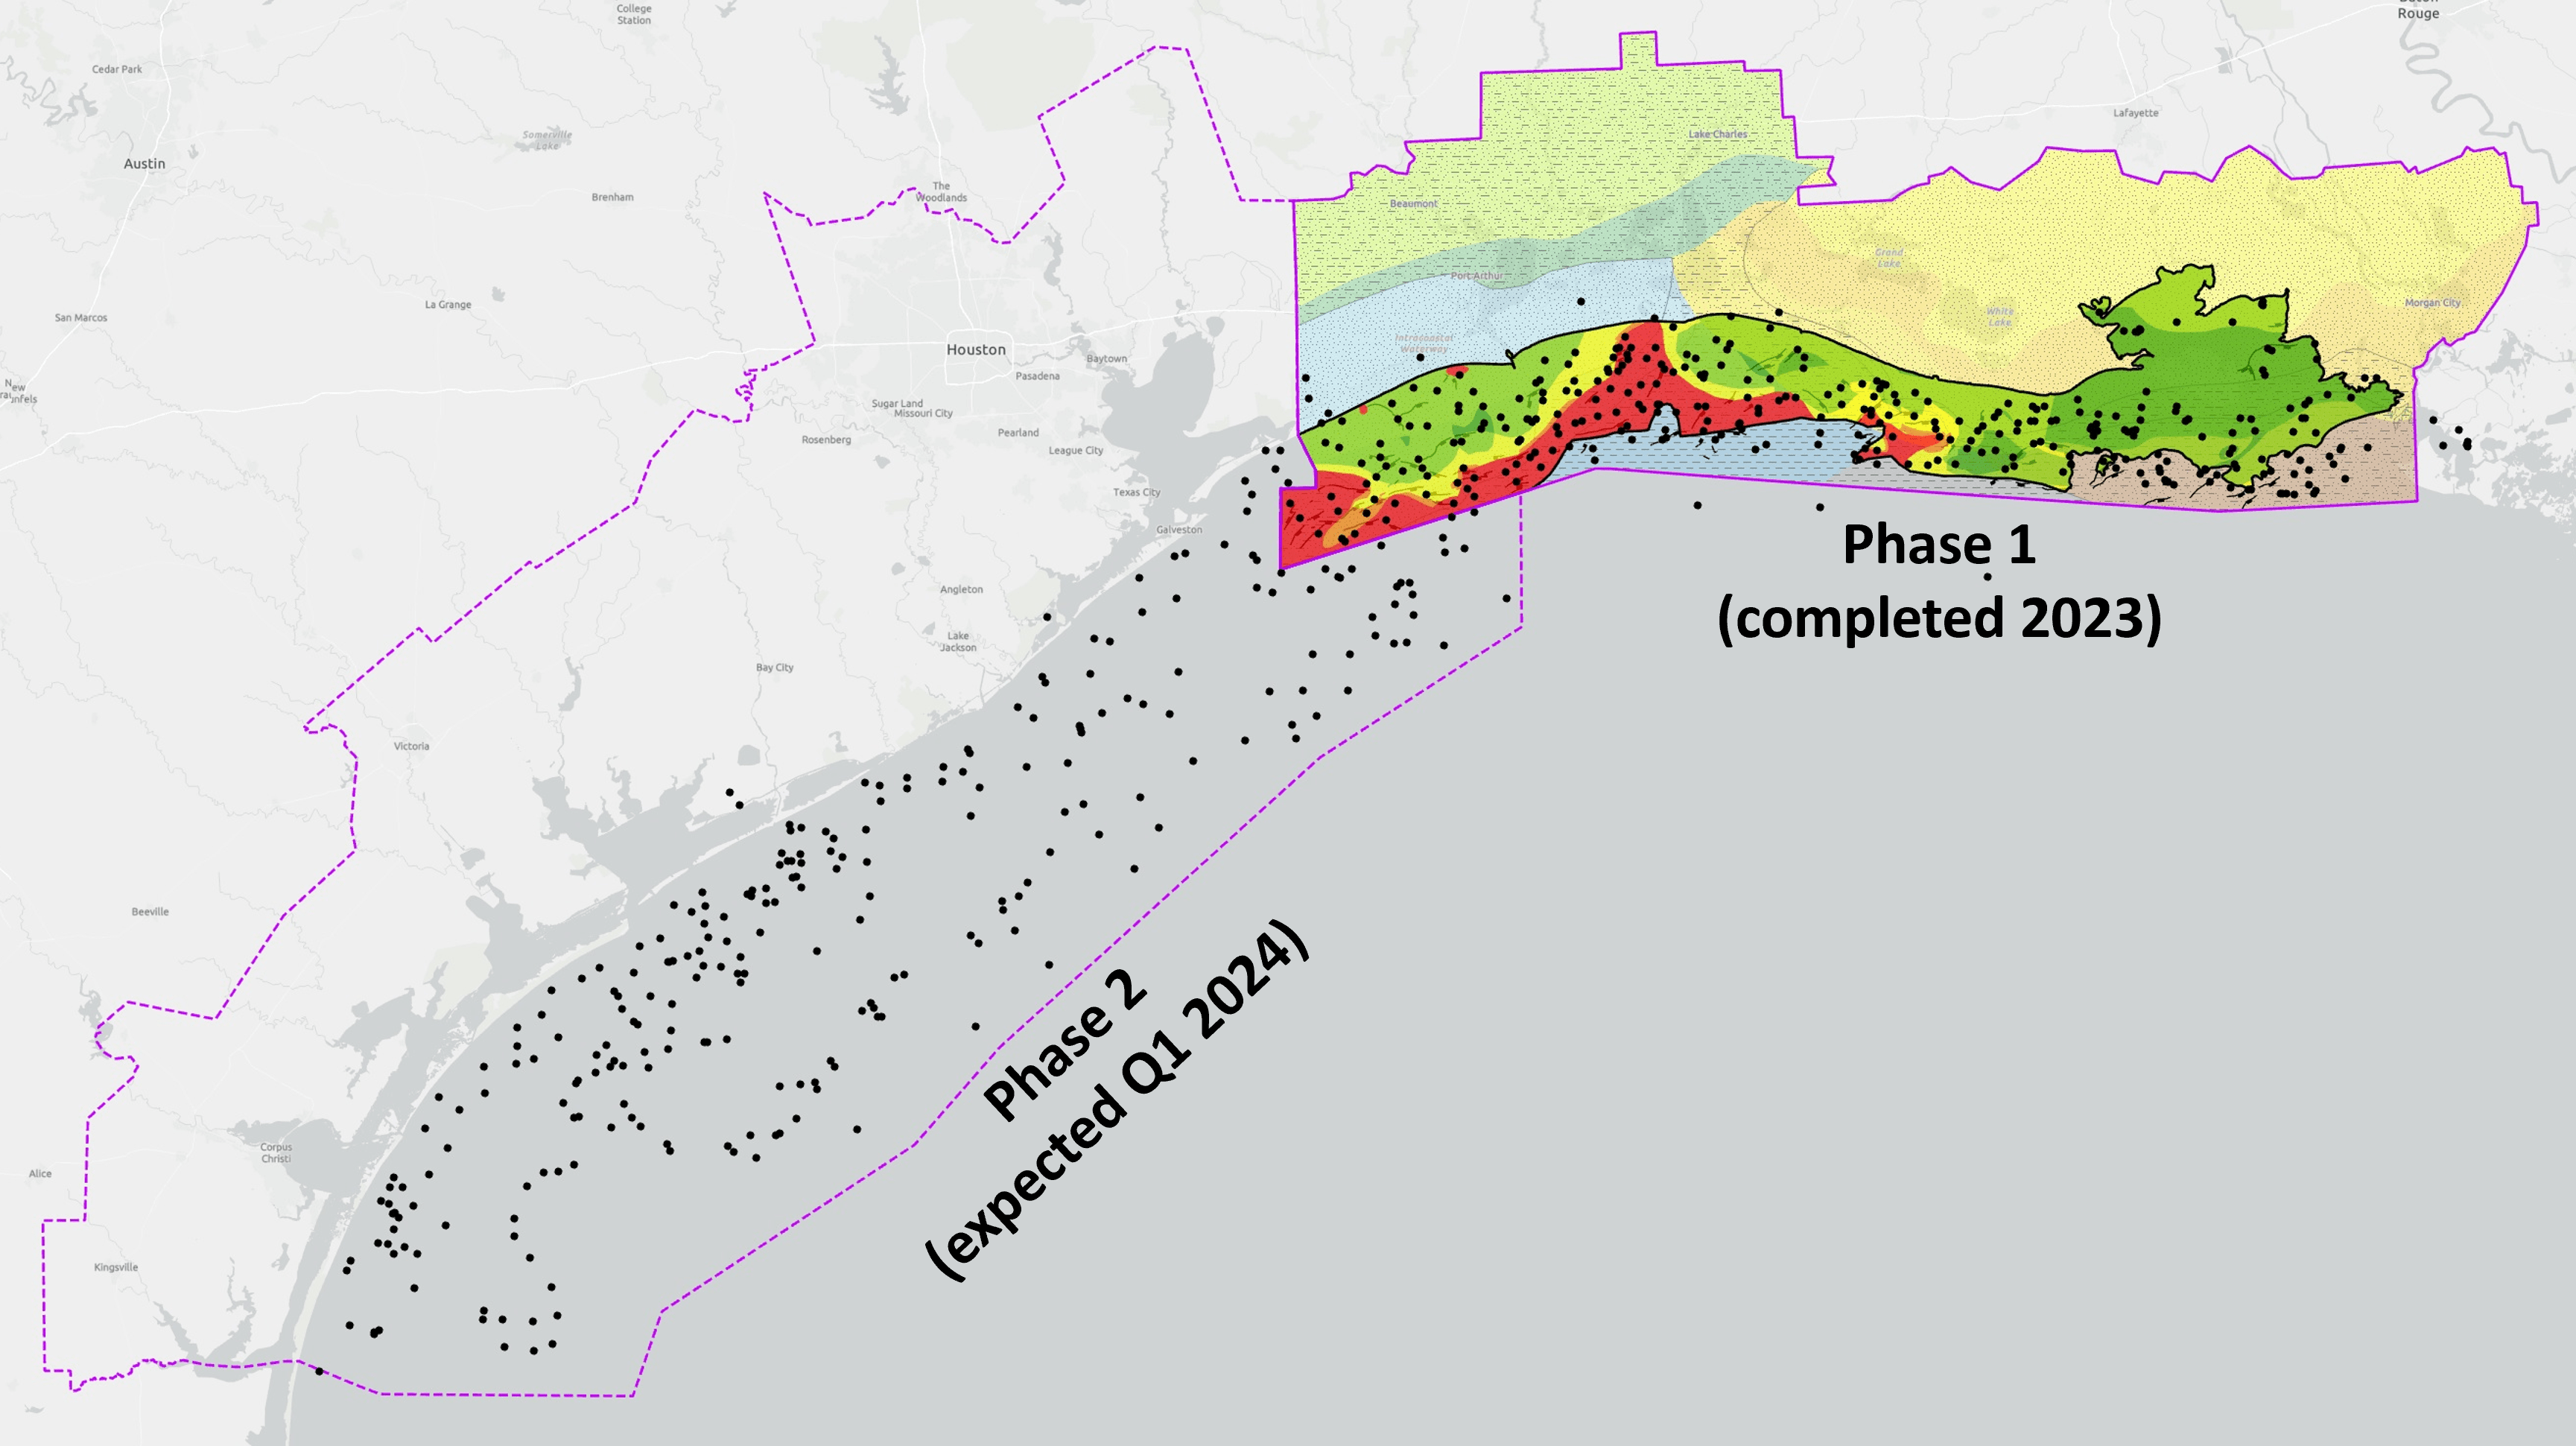
The process of SPQI mapping incorporates key properties for carbon storage evaluation mappable at play scale, including depth, structure, reservoir and seal properties, water chemistry, injectivity and containment integrity. Figure 1 shows the extent of the database and the screening study.
Stratigraphy is used to identify the key aquifers and build the framework of the geological model. This was developed using biostratigraphic data, including micropaleontological and nannofossil distribution data. Key surfaces were tied to seismic reflection data using time-calibrated well logs. The structural framework was based on over 70,000 km of 2D seismic and approximately 25,000 km2 of 3D seismic.
A total of 16 key properties were extracted from the well data, mapped, and combined to produce a composite SPQI map (Figure 1). This was performed for each play to identify the most prospective geographic areas to investigate further for carbon storage sites.
Rejuvenating Legacy Seismic
Following successful screening of the targeted aquifers, seismic imaging then becomes critical to the next stage of characterising carbon storage sites in 3D.
CGG carried out a reprocessing pilot study in the High Island offshore area of the GOM. The legacy seismic image used vintage narrow-azimuth (NAZ) data which had not benefitted from modern-day processing techniques, such as deghosting, model-based water-layer demultiple (MWD) and full-waveform inversion, resulting in problems with shallow-water multiples, poor to non-existent shallow overburden imaging and poorly imaged faults.
In this example, the legacy seismic was reprocessed using state-of-the-art Time-Lag FWI algorithms that utilize iterative data fitting, using the full wavefield of seismic data, including multiples and diving wave energy, to update the velocity model and reflectivity image simultaneously.
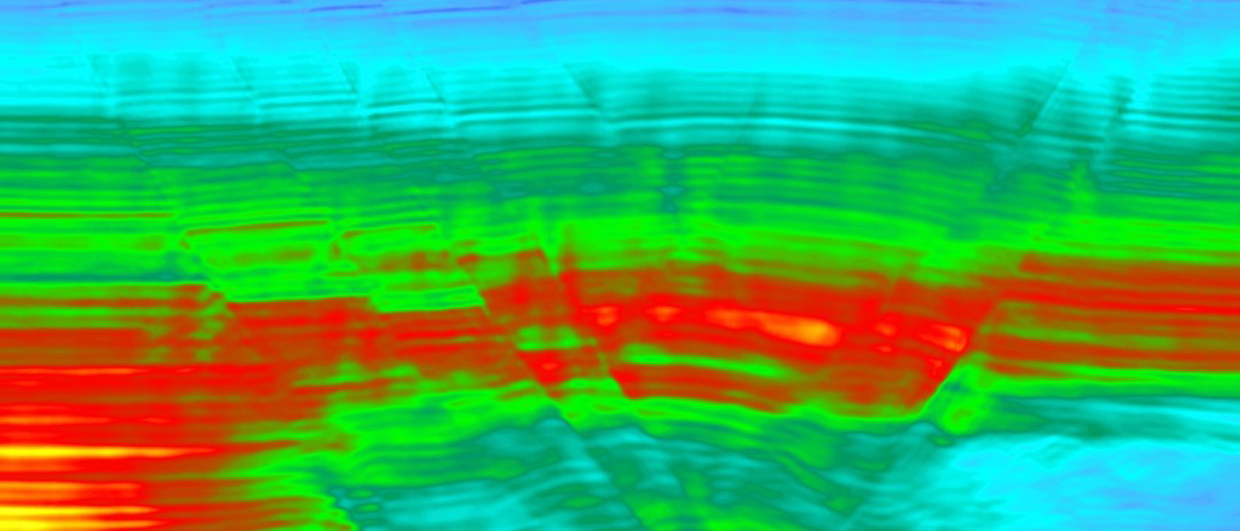
Figure 2a shows how the smooth legacy data velocity model lacks detail to represent the complex geology. In contrast, the 35Hz FWI velocity model exhibits high-resolution results, imaging the faults more accurately and better defining stratigraphic layers and features of the underlying geology.
Figure 2b compares a legacy Kirchhoff PSDM image with the 35Hz FWI mage. The FWI Image filled in the missing information in the shallow section and enhanced the amplitude fidelity of stratigraphic events. This improved approach benefited from least-squares fitting of the data and improved utilisation of the lower frequencies, resulting in broadband images ideally suited to reservoir mapping and delineating possible escape routes for CO2 from potential storage sites.
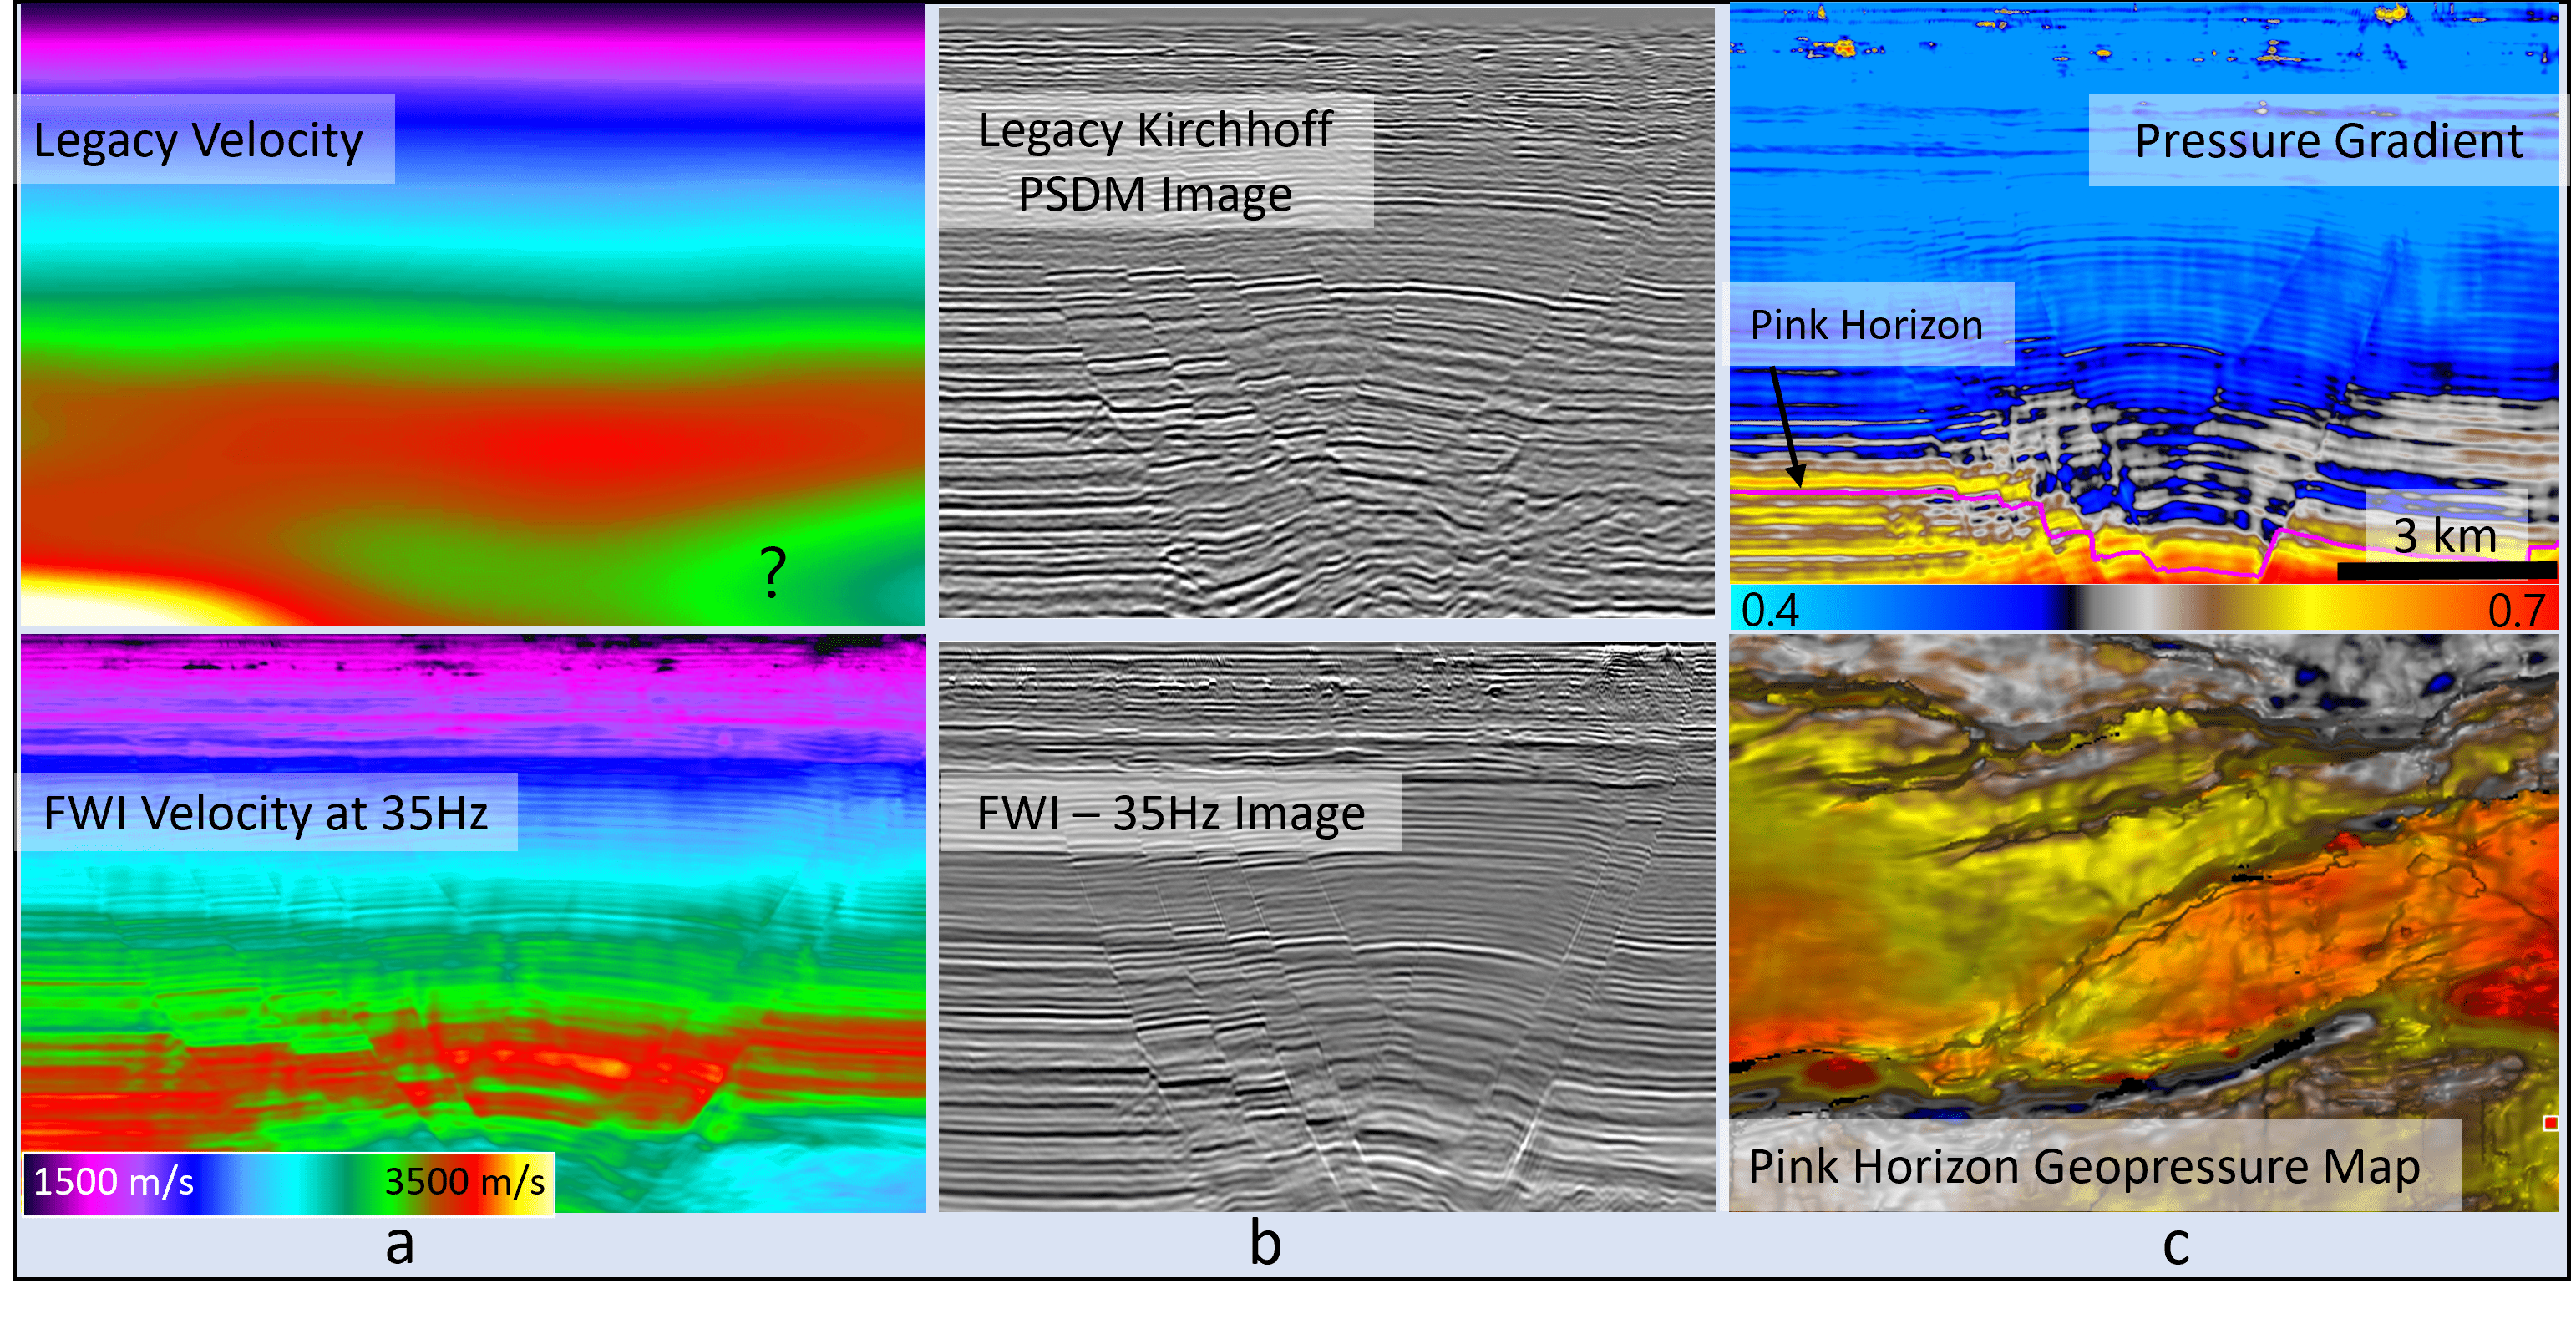
The FWI velocity provides a detailed subsurface model which was augmented with well data to enable the generation of a detailed 3D pore pressure prediction volume. In Figure 2c, significant pressure changes can be identified across faults. Cold colours indicate pressures close to hydrostatic pressure (~0.45 psi/ft). Hotter regions are significantly overpressured. At the pink horizon level on the geopressure map, overpressured fault compartments can be recognised that would likely pose significant development challenges in terms of compartmentalisation of the pore space and low pressure headroom for injection.
Providing critical support to site characterisation
After evaluating a large volume of legacy wells and seismic data, the SPQI mapping approach identified high-grade areas suitable for carbon storage sites in the shallow water GOM. Meanwhile, the rejuvenation of the legacy seismic data, using Time-Lag FWI reprocessing, has been shown to significantly enhance the seismic imaging, providing essential detail and insight into the true subsurface complexity and thus providing critical support to the site characterisation phase.