At quite uncertain times and places,
The atoms left their heavenly path,
And by fortuitous embraces,
Engendered all that being hath.
And though they seem to cling together,
And form ‘associations’ here,
Yet, soon or late, they burst their tether,
And through the depths of space career.
— James Clerk Maxwell (1831-1879), From ‘Molecular Evolution’, Nature, 8, 1873.
The absorption spectra of greenhouse gases and the physics of radiative transfer in the Earth’s atmosphere are a key to understanding changing climate. For Earth’s greenhouse effect, the CO2 molecule’s absorption of radiation (photons) close to 667 cm-1 (15 μm) is of particular interest since those wavenumbers are near the peak radiation wavelength for Earth’s temperature and thus important for terrestrial radiative transfer in the atmosphere. If infrared (IR) absorption took place only at 667 cm-1 it would have negligible climatic effect. But collisions between CO2 molecules and other molecules remove or add energy during radiative transitions and this process, called pressure or collisional broadening, allows absorption and emission to take place over a broader range of photon energies. Therefore, pressure broadening is a key source of IR opacity in the troposphere.
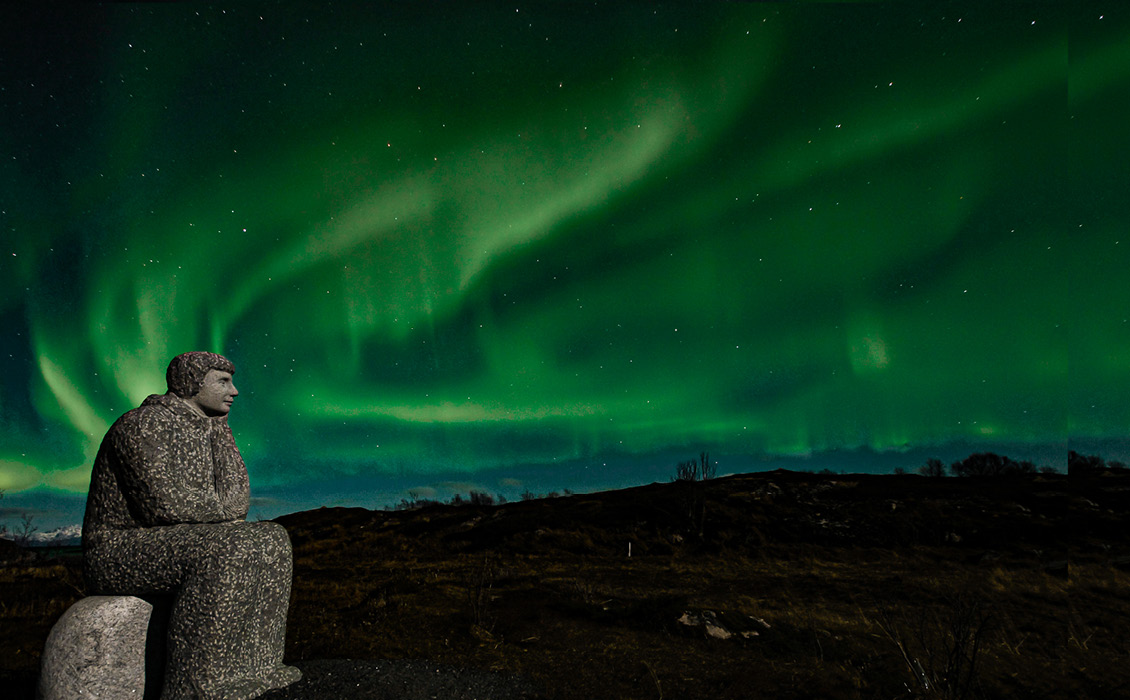
Figure 1: “Boy in Thought”, a granite sculpture sitting under the Northern Lights in Tranøy, Hamarøy (Norway) is well aware how the green lights are created 100–250 km above him. Charged particles from the solar wind first bump into diatomic nitrogen, ionising N2 into N2 +, making N2 lose an electron. This electron bumps into and excites a nearby oxygen atom. To de-excite, the oxygen atom emits a photon of visible light with wavelength of about 550 nm. Our eyes and cameras interpret this colour as lime green. Ketil Kåsli.
In fact, the CO2 absorption spectrum shows thousands of separate lines between 500 and 850 cm-1 (Figure 2). The CO2 absorption cross-section denoted by σ is a measure for the probability of absorption, or the ability of a CO2 molecule to absorb a photon of a particular wavenumber. The density or number n of absorbing CO2 molecules per unit volume must also affect the probability of absorption.
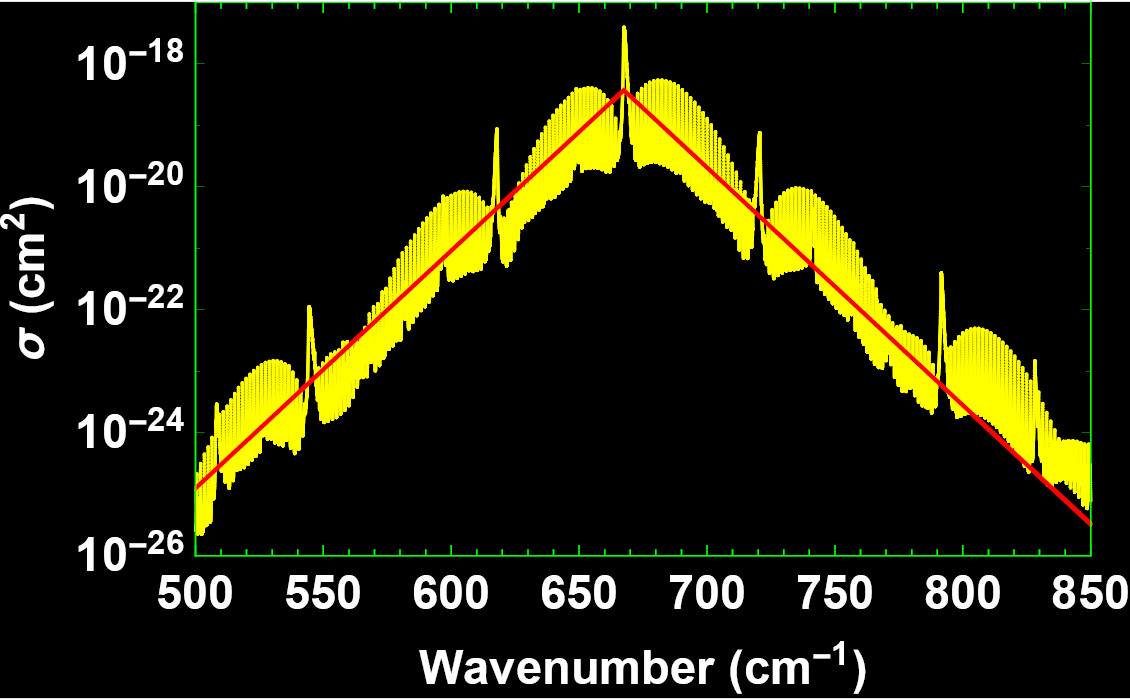
Figure 2: Absorption cross-section, in cm2, for a CO2 molecule as a function of wavenumber from the HITRAN database (http://hitran.iao.ru/home.overview), shown at 1 atm and 285K; note the logarithmic scale. The red line shows an approximation to the cross-section, used in calculations. Although the unit is given as an area, it does not refer to an actual size, because the density of the CO2 molecule will affect the probability of absorption. For further detail see the HITRAN database (http://hitran. iao.ru/home.overview). Source: HITRAN.
Absorption Coefficient
The absorption coefficient is the product of CO2 density and CO2 cross-section, αν = nσν. A simple way to calculate αν follows. The yellow line in the absorption cross-section (Figure 2) seen by the IR photon can be simplified by the red line given by σν = σ0 exp(-r|ν-ν0|), where σ0 = 3.71·10-19 cm2, r = 0.089 cm and ν0 = 667.5 cm-1, close to an approximation suggested by Wilson and Gea-Banacloche (2012). We assume the absorption spectrum is independent of height. This is an approximation, since the broadening and the strength of the spectral lines depend on both pressure and temperature.
We also need a formula for how n changes with altitude; we use the ‘exponential atmosphere’ n(z) = n0 exp(-z/L) with ‘scale height’ of L = RT0/ mg ≈ 8,000m. Here R = 8.31447 J/(mol K) is ideal gas constant, m = 0.0289654 kg/mol is the molar mass of dry air and g = 9.80665 m/s2 is Earth-surface gravitational acceleration. We have used the temperature T0 = 273K. The exponential atmosphere takes the simplifying assumption that T is constant with altitude (T varies by only 20% below 80 km so this is acceptable). For every rise in altitude L, the air density and pressure drop by a factor e = 2.7; thus, L provides a convenient measure of atmospheric thickness.
CO2 is heavier than air, but is well-mixed throughout the atmosphere, so that its density can be taken to decay with the same characteristic constant as air itself, 2.5470·1019 molecules/cm3. Then, n0 is the number density of CO2 molecules near the surface of the Earth. When the concentration is given in ppm as [C], it becomes n(z = 0) = n0 = 2.5470[C]·1013 molecules/cm3.
Transfer for Spectral Radiance
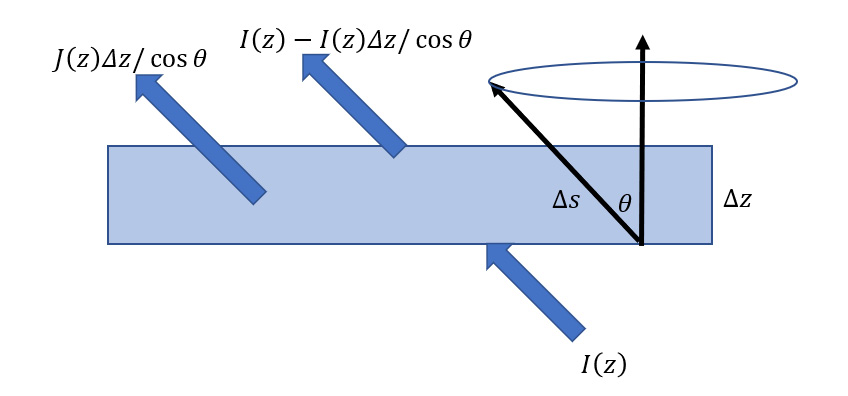
Figure 3: Sketch of the radiative energy balance for a slab of atmosphere illuminated by incident radiation from below. When the beam is inclined at zenith angle θ (from the vertical), the elemental path along the beam is related to that along the vertical path Δz by geometry as cos θ = Δz/Δs HITRAN.
We now have an approximation for the absorption coefficient in the troposphere due to the presence of CO2. To find how Earth’s IR radiation is transferred upwards (ignoring convection), we need an equation of transfer which recognises an atmosphere that is simultaneously absorbing and emitting. We invoke the plane-parallel approximation, where pressure, temperature and composition are assumed to be functions of height only. Suppose that, between z and z + dz, the absorption coefficient is αν at wavenumber ν. The emission coefficient is equal to the absorption coefficient as a result of Kirchhoff’s law (see Part VI – More on the Simple Greenhouse Model). In this interval, suppose that the spectral radiance, often called intensity, increases from Iν to Iν + dIν along a path s at an angle θ to the vertical; geometry gives ds = dz/μ; μ = cosθ (Figure 3). The radiance on its way upwards (+) will be reduced by absorption and increased by emission described by a source function Jv . Thus, it has the differential form:
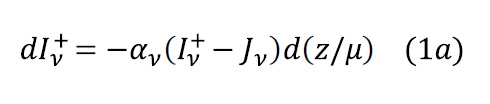
Losses and gains in intensity must obey the second law of thermodynamics: for any term that introduces a loss there must be a term that introduces a gain. The formal solution to this equation for radiative transfer in the upward direction is:
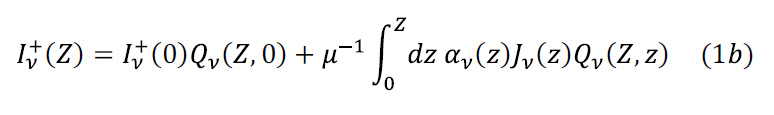
where Iν +(0), being a boundary condition, is the upwards radiation rate at the surface of the Earth, which we take to be equal to Earth’s blackbody radiation:
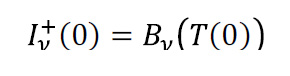
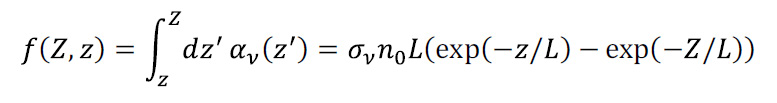
with T(0) = 288K, the average surface temperature. Further, Qv is the function which transfers intensity upwards from height z to height Z where we imagine an observer is looking down on our planet:
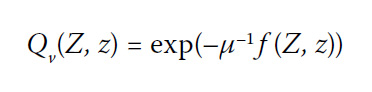
where:
The physics of the source function is crucial for radiative transfer. We assume that the atmosphere is in local thermodynamic equilibrium. The emission of energy from a volume element can then be specified in terms of the Planck spectral energy distribution and the radiative absorption coefficient, regardless of the spectrum of the flux passing through the element. Thus, the source function acts according to Planck’s radiation formula:
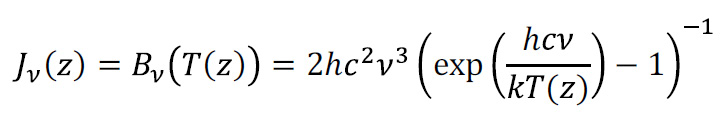
which tells the power radiated per unit area, per unit solid angle of emission, per unit wavenumber by the surface of a blackbody at temperature T. To proceed with the source function, we need to specify how the average equilibrium temperature changes with height, taking as a guide the ‘International Standard Atmosphere’, which has a temperature lapse rate of 6.49 K/km from sea level to 11 km (the tropopause) so that T(z) = T(0)-6.49K·z/1,000m.
The first term of the solution in equation (1b) is simply the exponential attenuation of the emission from height 0 to Z. The second term is the sum of the emissions from each level z along the path from 0 to Z, each emission exponentially attenuated by the path length from z to the observer at Z.
Upwards Transfer with Absorption
Let’s investigate the first term of the solution, Iν+(Z) = Iν+(0) Qν(Z,0), which transfers Earth’s blackbody radiation to height Z without including the effect of emission. Let μ = 1. Of course, keeping only the first term is unphysical; if the Earth were allowed to continuously send IR energy upwards into the atmosphere without any emission from the atmosphere, CO2 photon absorption would make the air get increasingly hot. But this kind of analysis provides some learnings.
In the exponential atmosphere where its composition is assumed to be function of height only, the transfer function becomes Qν(Z,0)≈exp(-Z/lν), where the approximation holds when Z<<L. In physics, lv is the absorption or attenuation length, being the distance lv into the atmosphere when the probability that the photon has not been absorbed has dropped to 1/e≈1/3: lv is also called the mean free path because it equals the mean distance travelled by a photon before being stopped. Mathematically, Iν +(0) Qν(Z,0) is the probability of finding the photon at height Z into the atmosphere.
To explore this equation’s implications, suppose a photon close to the centre of the absorption band, between 650–690 cm-1, is emitted upwards at the surface of the Earth. The CO2 concentration is assumed to be [C] = 400 ppm. How high will it travel before it is absorbed? The absorption length is l0 = 1/n0σ0 = 2.65m – not very far at all! In fact, the bottom of the troposphere might be seen as an impenetrable wall of CO2.
Clearly, the probability of absorption is different for IR radiation at wavenumbers towards the edges of the band, below 580 or above 760 cm-1, where σ is much lower, so the mean free path is 100s of metres to a kilometre. These photons make their way to a substantial height. The density of CO2 reduces at higher altitudes, thereby increasing the probability of them travelling even higher before absorption. Radiation at these wavenumbers is most sensitive to changes in the atmospheric CO2 level. An increased CO2 concentration yields a reduced absorption length.
Transfer with Absorption and Emission
This discussion disregarded much of the real physics of the transfer solution: to avoid being continuously heated, the atmosphere must emit radiation, as taken into account by the second term of the solution. The term is a ‘source term’ for generating photons, which acts continuously at every height above Earth. Every upward-going radiation at some height Z (first term in equation (1)) according to Kirchhoff’s law will be the source for new radiation with local emissivity equal to local absorptivity, half of which will radiate downwards. The rest will go upwards, and this effect is included in the source term in the radiative transfer equation (1).
The complex form of Planck’s formula does not allow a straightforward analytical solution of the transfer solution, but we can calculate the integral over height numerically for every wavenumber to the altitude of top of troposphere (TOT) at 11 km. Doing so for θ = 0, we find the intensity curve shown in yellow in Figure 4. If we disregard emission and only include absorption, we get the intensity curve display in red.
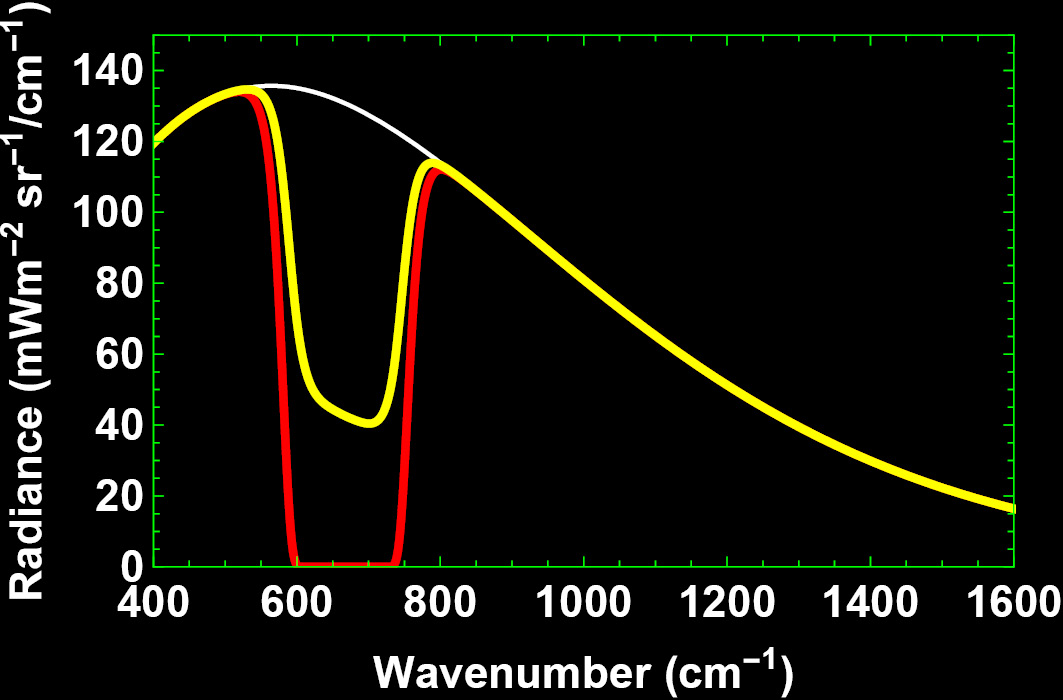
Figure 4: The transmitted spectral radiance from Earth’s surface through the troposphere with presence of CO2 for the model in this article, with scale height L = 8 km, to top of troposphere at height 11 km. Red line: transmission upwards with absorption only, which is impossible, since the atmosphere would overheat. Yellow line: transmission upwards with absorption and emission, which allows Earth to cool due to upward travelling emission, but at the same time heat due to downward travelling emission. White line: Earth’s emitted blackbody radiation (not visible where absorption is insignificant).
In an atmosphere with emission equal to absorption for every wavenumber, the model shows that parts of Earth’s blackbody radiation in the presence of atmospheric CO2 is allowed to escape to the TOT, thereby carrying thermal energy away from Earth and cooling it. However, what does not go up will have to go down to Earth, to be absorbed by the surface and converted to heat, followed by blackbody IR photon emission in accordance with an adjusted thermodynamic equilibrium.
Over the long term, for the Earth-atmosphere system to be in equilibrium, top of atmosphere emission must match the solar incoming radiation. In this article, we have analysed the one-way differential equation for radiative transfer upwards. There is, of course, also a one-way differential equation for radiative transfer of IR radiation downwards, which has opposite signs to the equation we have worked on.
Terrestrial Radiation Spectrum
Satellite measurements show the real spectrum above Earth. An example (Figure 5) is the radiation spectrum measured from a satellite over the Sahara in 1990. This spectrum is a combination of blackbody spectra for temperatures ranging from 220 to 320K for the day of measurement. The bottom of the dips in the curve indicate the effective temperature of the emission where photons are emitted not from the surface but a cooler atmospheric height. The bottom of the CO2 band at 667 cm-1 emits at about the tropopause temperature of 215K. The spectrum over the IR atmospheric window has the appearance of a blackbody curve at around 320K surface temperature. In this window there is relatively little absorption of terrestrial thermal radiation by atmospheric gases.
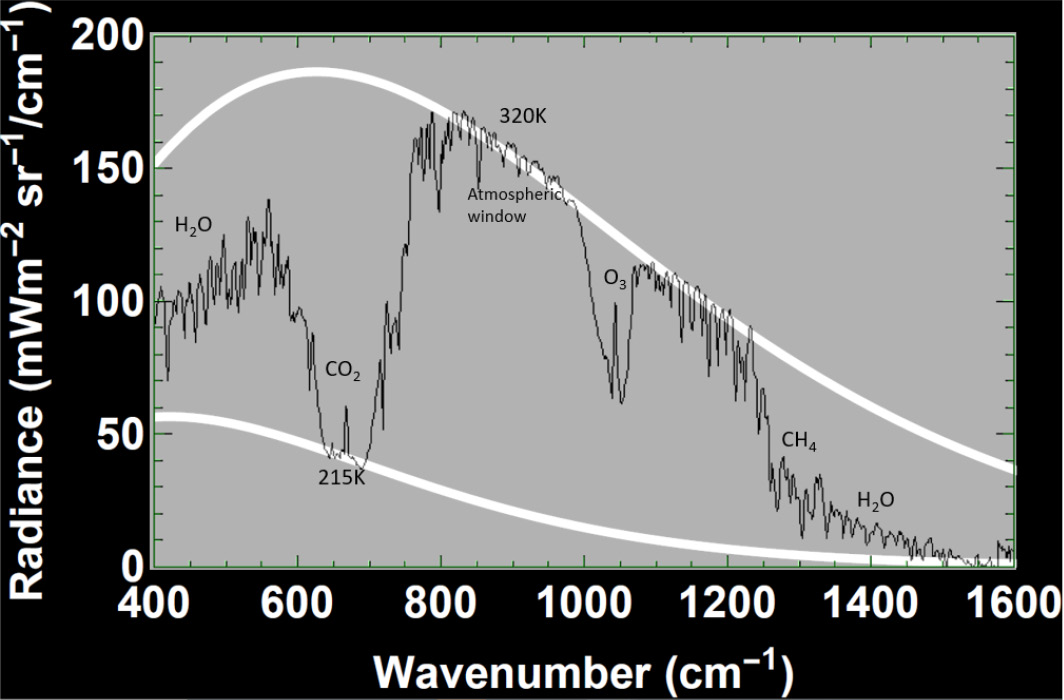
Figure 5: Thermal emission spectrum of the Earth’s atmosphere and surface from 400–1,600 cm−1 recorded over a hot Sahara on 5 May 1970 by infrared interferometer spectrometer IRIS-D on Nimbus 4. Calculated blackbody curves for temperature 320K and 215K are superimposed. The greenhouse effect of CO2 is visually manifest by the bite taken out of the IR spectrum near 667 cm-1. This feature agrees nicely with the numerical calculations based on the equation of radiative transfer. The maximum temperature measured in the atmospheric windows between 850 and 950 cm-1 indicates surface temperatures around 320K. If residual atmospheric absorption is ignored, this temperature refers to the top layer of exposed soil or vegetation. Credit: Hansen R A et al. (1994) IRIS/Nimbus-4 Level 1 Radiance Data V001.
To cite the data in publications
Hansel R A et al. (1994) IRIS/Nimbus-4 Level 1 Radiance Data V001, Greenbelt, MD, USA, Goddard Earth Sciences Data and Information Services Center (GES DISC), Accessed: [Data Access Date], https://disc.gsfc.nasa.gov/datacollection/IRISN4RAD_001.html
Acknowledgment
The authors have enjoyed many helpful discussions with Tore Karlsson. Thanks also to Ketil Kåsli for providing the Northern Lights photography.
*Lasse Amundsen is a full-time employee of Equinor.
Further Reading in the ‘Recent Advances in Climate Change Research’ Series
Recent Advances in Climate Change Research: Part I – Blackbody Radiation and Milankovic Cycles
Martin Landrø and Lasse Amundsen, NTNU / Bivrost Geo
Geoscience will probably play an important role in mitigating carbon dioxide emissions. In part one of this series, we discuss some history and physics behind the topic of climate change including the concepts behind blackbody radiation and Millankovic Cycles.
This article appeared in Vol. 16, No. 2 – 2019
Recent Advances in Climate Change Research: Part II – Arrhenius and Blackbody Radiation
Martin Landrø and Lasse Amundsen, NTNU / Bivrost Geo
In Part II we look at Arrhenius’ seminal 1896 paper and see how it relates to blackbody radiation and absorption of infrared radiation by the atmosphere, taking a closer look at his model of the greenhouse effect.
This article appeared in Vol. 16, No. 3 – 2019
Recent Advances in Climate Change Research: Part III – A Simple Greenhouse Model
Martin Landrø and Lasse Amundsen, NTNU/Bivrost Geo
What would the temperature of Earth be without the atmosphere? By using simple physical models for solar irradiation and the Stefan-Boltzmans law for blackbody radiation, we can estimate average temperatures with and without atmosphere.
This article appeared in Vol. 16, No. 4 – 2019
Recent Advances in Climate Change Research: Part IV – Challenges and Practical Issues of Carbon Capture & Storage
Martin Landrø, Lasse Amundsen and Philip Ringrose
The basic idea behind CCS (Carbon Capture and Storage) is simple, but what are the main challenges and practical issues preventing a more global adoption of this method?
This article appeared in Vol. 16, No. 5 – 2019
Recent Advances in Climate Change Research: Part V – Underground Storage of Carbon Dioxide
Eva K. Halland, Norwegian Petroleum Directorate. Series Editors: Martin Landrø and Lasse Amundsen, NTU/Bivrost Geo
By building on knowledge from the petroleum industry and experience of over 23 years of storing CO₂ in deep geological formations, we can make a new value chain and a business model for carbon capture and storage (CCS) in the North Sea Basin.
This article appeared in Vol. 16, No. 6 – 2019
Recent Advances in Climate Change Research: Part VI – More on the Simple Greenhouse Model
Lasse Amundsen and Martin Landrø, NTNU/Bivrost Geo
We continue the discussion of the simple greenhouse model introduced in Part III.
This article appeared in Vol. 17, No. 1 – 2020
Recent Advances in Climate Change Research: Part VII – Arrhenius’ Greenhouse Rule for Carbon Dioxide
Lasse Amundsen and Martin Landrø, NTNU/Bivrost Geo
Here, we investigate the relationship between radiative forcing (heat warming) of carbon dioxide and its concentration in the atmosphere to better understand climate feedback and sensitivity.
This article appeared in Vol. 17, No. 2 – 2020
Recent Advances in Climate Change Research: Part VIII – How Carbon Dioxide Absorbs Earth’s IR Radiation
Lasse Amundsen and Martin Landrø, NTNU/Bivrost Geo
Skydive with us into the quantum world and find out how carbon dioxide molecules absorb thermal IR radiation.
This article appeared in Vol. 17, No. 3 – 2020
Recent Advances in Climate Change Research: Part IX – How Carbon Dioxide Emits IR Photons
Lasse Amundsen* and Martin Landrø, NTNU/Bivrost Geo
Skydive with us into the quantum world, where we provide to those unafraid of molecular energy transfer an answer to the question: what happens to Earth’s radiated infrared (IR) photons after they are absorbed by IR active CO₂ molecules in the lower atmosphere?
This article appeared in Vol. 17, No. 4 – 2020
Recent Advances in Climate Change Research: Part X – How Quickly Does Atmospheric CO₂ Mix into the Ocean and Biosphere?
Lasse Amundsen* and Martin Landrø, NTNU/Bivrost Geo
In this article, we revisit unique radiocarbon data from the 90s and discuss briefly why this is of importance to our understanding of how CO₂ is circulating between the atmosphere, biosphere, and the oceans.
This article appeared in Vol. 17, No. 6 – 2020