Utilising all hybrid acquired waveforms in a revolutionary MP-FWI processing approach
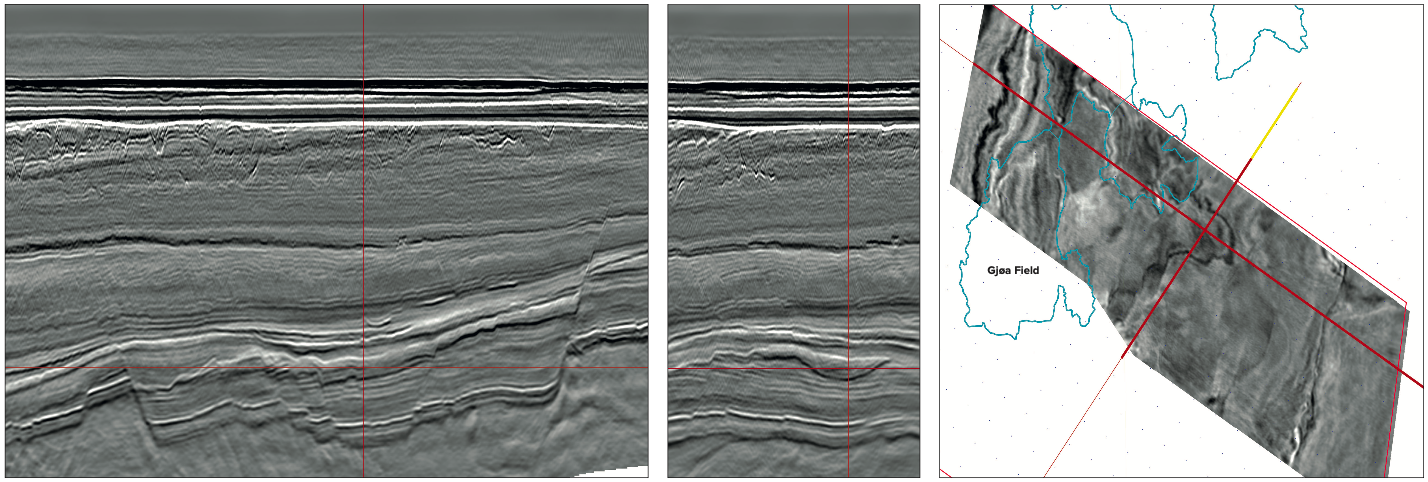
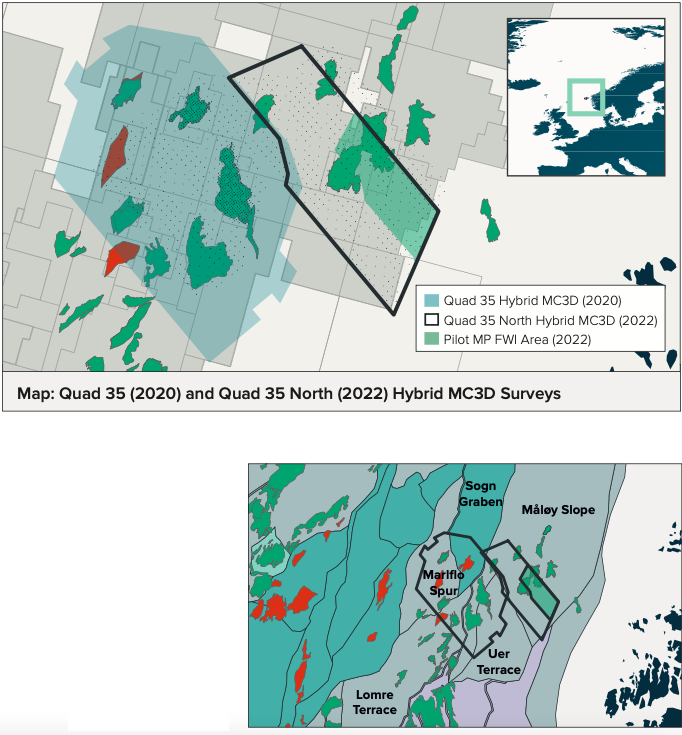
The Hybrid Q35N MC3D was acquired in 2022 in the Måløy Slope, towards the Uer Terrace, in the Northern North Sea. Spanning 420 square km, the survey covers the Titan and southern section of the producing Gjøa field (Figure 3). This also envelops the Tethys discovery. Predominantly, the area is held by operators such as DNO and Neptune as well as the newly awarded PL1180 license from the APA 2022 Round.
Not all Jurassic reservoir is created evenly…
The Titan and Tethys are quite well understood discoveries in the Upper Jurassic. However, surrounding exploration has had varying success with different hydrocarbon types and reservoir quality in alternative intervals. This demonstrates that sand distribution is not yet fully understood due to the variation in age and deposition of the reservoirs.
For example, the Gjøa field was discovered by the 35/9-1 well in 1989, encountering hydrocarbons in the Upper Jurassic Viking Group, the Middle Jurassic Brent Group and the Lower Jurassic Dunlin Group. A further target was the Lower Cretaceous, which was unfortunately dry due to lack of reservoir. Subsequently, 35/9-2 confirmed Upper and Middle Jurassic reservoir presence showing variations of success within this interval. Further drilling of well 36/7-1, drilled in 1996, discovered oil and gas in both the Intra Draupne sandstones and the Sognefjord Formations of Late Jurassic age as well as in the Middle Jurassic, Fensfjord Formation. The Gjøa field came into production in November 2011 and has currently more than 50% gas production.
Further to the north-east, higher up on the slope, the Duva prospect was drilled in 2016 with oil discovered in the Lower Cretaceous Agat Formation. It came on stream in 2021 and is tied into the Gjøa field. Successful drilling of the Hamlet and Ofelia proved hydrocarbon in the Agat Formation northwards on the ‘Gjøa Ridge’ to the northeast of the Q35N region.
Solving the Jurassic Conundrum
This demonstrates a highly prospective area but in order to understand and solve the challenges associated with which reservoir intervals are prospective and present, innovative seismic acquisition and processing is required. The Hybrid, LumiseisTM, Ultra High Density (UHD) 3D method has proved to resolve both the structural and stratigraphical challenges (i.e. thin reservoirs), while preserving the integrity of geophysical information.
Developing our experience from the 2020 Hybrid project, the new 2022 Hybrid acquisition was enhanced by using 5 sources and a streamer separation of 75 m. This resulted in very small bins of 7.50 m in crossline direction and 6.25 m in the inline direction. In these small bins (46.9 square m) we again obtained a high fold of 128. The nodes were placed in a 900 m x 900 m grid simultaneously receiving shots from a uniform source grid of 31.25 m x 60.00 m.
This Hybrid acquisition with UHD streamer and OBN data is ideal for velocity model building using diving waves in Full Waveform Inversion (FWI) and lends itself to new and innovative seismic processing, Multi Parameter FWI, as described in the text box below.
Proof is in the seismic
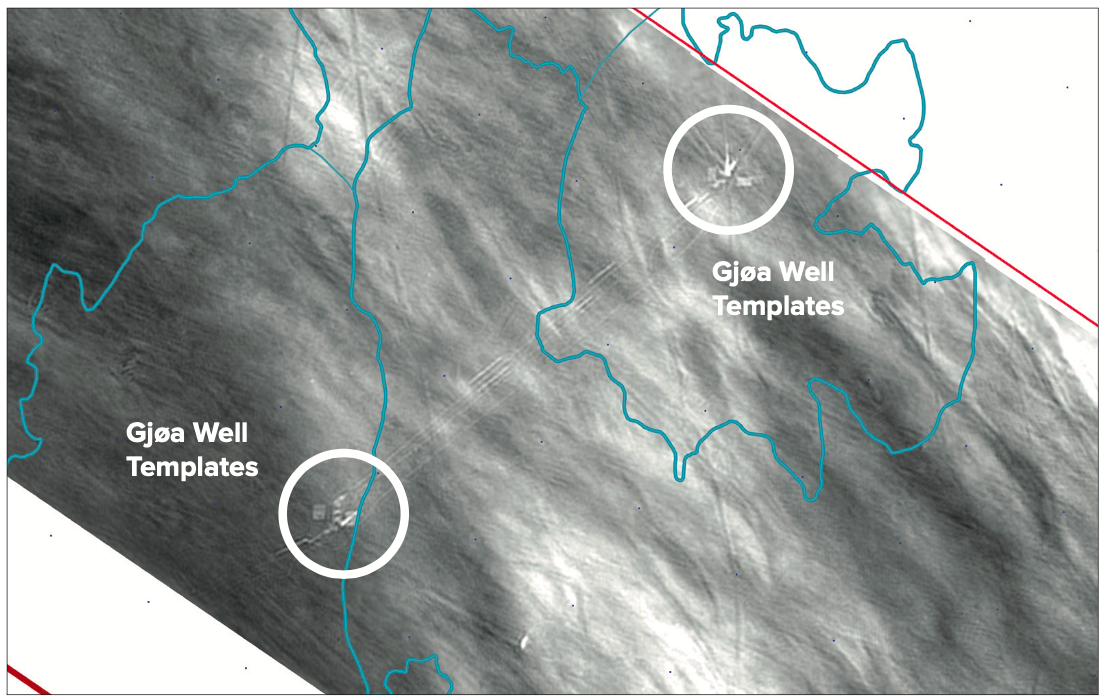
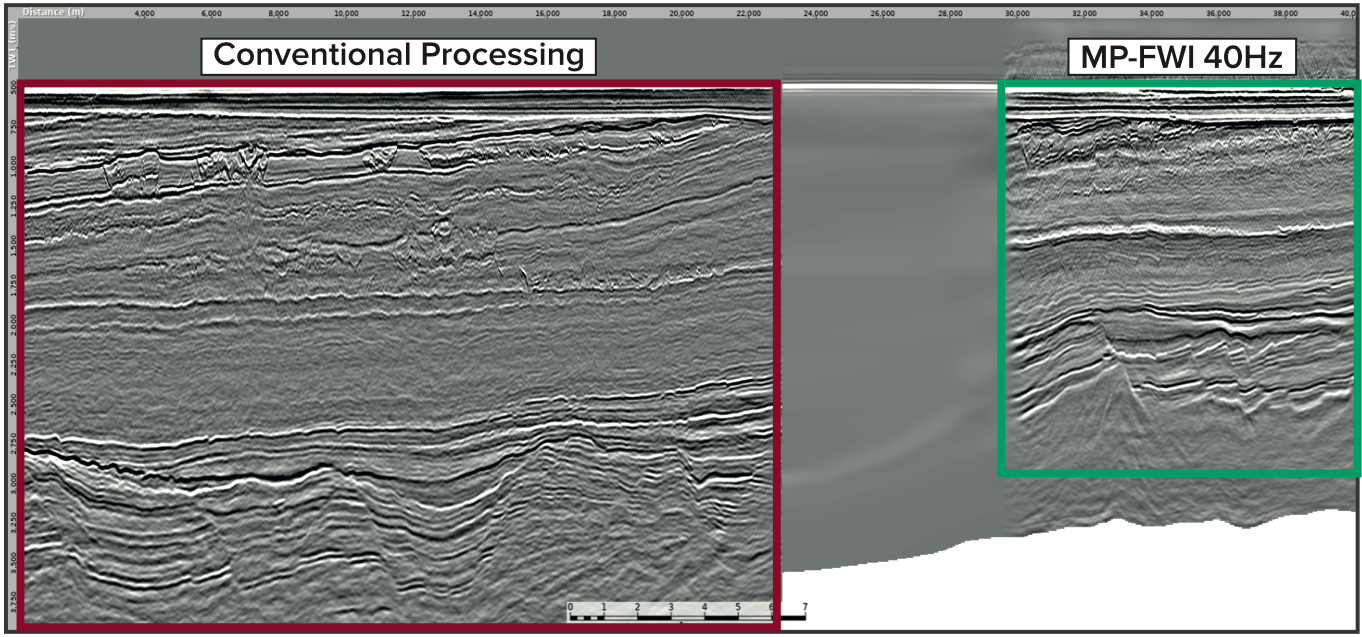
A 100 square km pilot test area was carefully selected to highlight both existing challenges on the Gjøa producing asset and to reveal potential new prospectivity in the recently awarded PL1180 license. The test cube at 40 Hz shows that the data has delivered the desired results. Examples of the well-defined Jurassic and Cretaceous sections are well displayed in Figures 1a (inline), 1b (crossline) and 1c (timeslice). The spectacular Upper Jurassic unconformities, shown as a white and a black event can clearly be seen, as well as the Agat and Kyrre sands. The resolution is significantly improved and the imaging is excellent. The MP-FWI processing has resolved multiple and noise issues, showing the primary data clearer and at the same time simplifying the interpretation. Figure 4 shows a comparison between ‘conventional’ processing, whereby the OBN has been used for velocity model building only and the innovative MP-FWI result. Figure 2 shows amazing detail just blow the seafloor! The timeslice displays some of the well templates in the Gjøa field and possible trenching between them.
AVO prospect Mapping from MP-FWI
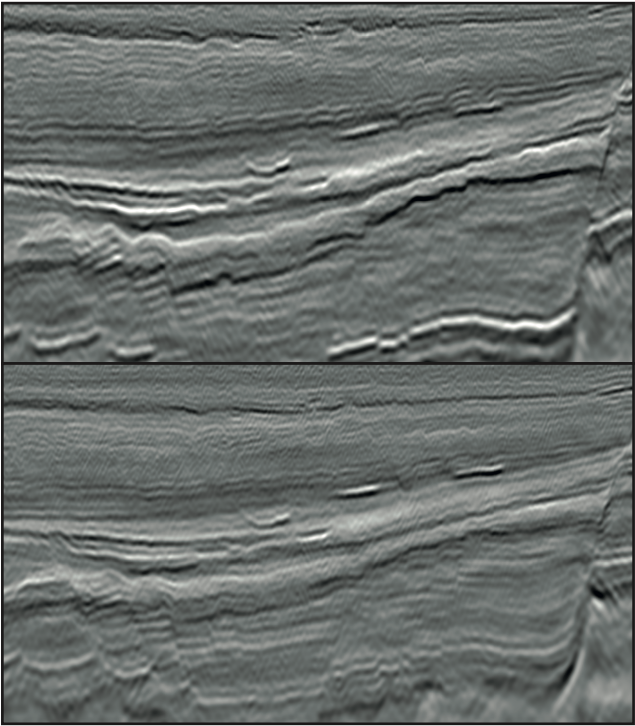
Having first generated the full fold data, we also generated angle stacks, showing that MP-FWI can deliver offset information as well, see Figure 5. This is particularly important in an AVO driven prospect mapping exercise. This frontier acquisition method, combined with state-of-the-art processing, is proof of the detail that can be achieved to solve problems in a complex basin.
Geoex MCG and partners are confident that this newly available data will assist near-field exploration in the region by finally answering questions surrounding the Jurassic and Cretaceous reservoir locations in this highly prospective region.
Multi-Parameter FWI imaging
A complete replacement of the conventional workflow
Traditional seismic processing workflows can be extremely time-consuming since subsequent stages only begin after extensive testing and QC of the current process. This serial approach takes the raw field data and passes it through a plethora of conditioning tools such as designature, deghosting, demultiple and regularisation to transform the data into a form that can be imaged by legacy migration algorithms, such as Kirchhoff or reverse time migration.
DUG Multi-Parameter FWI (MP-FWI) Imaging is a novel approach to seismic processing and imaging. This unique implementation of full waveform inversion delivers simultaneous model-building and full wavefield least-squares imaging directly from raw data, without the need for the conventional, extensive pre-processing and model-building workflow.
When including reflections in FWI, both the kinematics (timing) and dynamics (amplitudes) of the wavefield must be utilised as part of a simultaneous, multi-parameter inversion. DUG MP-FWI Imaging permits two significant improvements over traditional FWI to be realised. Firstly, it allows the kinematic part of the reflections, the so-called “rabbit ears”, to generate velocity updates over the full depth range. Secondly, it enables least-squares imaging utilising the entire wavefield which includes ghosts, primary reflections, surface-related and interbed multiples. This is in contrast to traditional imaging algorithms which image primary reflections only. The output velocity and reflectivity volumes can be derived from multiple surveys as was the case here, with both the streamer and OBN data used as input.
At high frequency, this approach provides true-amplitude reflectivity images for both structural and quantitative interpretation (including angle stacks for AVA analysis), without the need for the subjective and time-consuming conventional processing and imaging workflow.